The efficient operation of a gas well or gas field requires constant monitoring of the total field and individual well performance in order to detect problems that may seriously reduce gas recovery or producing capacity. Parameters to be monitored include pressure, flow rate, cumulative production, water production, and condensate production.
- Pressure-Cumulative Production Plots
- p/Z Versus Gp Plots
- Energy Plots
- Rate Versus Time Plots
- Hydrate Formation
- Causes, Occurrence and Prediction
- Hydrate Formation in the Flow String and Surface Lines
- Hydrate Formation in Flow Provers, Orifices and Back-Pressure Regulations
- Hydrate Control
- Sour Gas Production
- Corrosion
- Corrosion Control With Inhibitors
- The Short Batch Method of Application
- The Tubing Displacement Method
- Methods of Inhibitor Application Using Nitrogen Gas
- Method of Continuous Treatment with Inhibitors
- Formation Squeeze
- Sulfur Deposition
- Safety
- Well Testing
The best way to detect abnormal behavior is to plot these parameters, either as a function of time or cumulative production, and observe any sudden changes in behavior from the past or any deviation from expected behavior. Several of the most common production problems and the methods to detect them are described in this article.
Pressure-Cumulative Production Plots
By plotting total field or reservoir gas recovered versus p/Z on various scales, production problems such as abnormal pressure, water influx, leakage, or loss of gas, or bad data can be detected.
p/Z Versus Gp Plots
As described in Manual for Engineers to Calculate Amount of Gas in ReservoirsEssential Calculations of the Gas Reservoir Performance, for a volumetric gas reservoir, a plot of p/Z versus Gp on Cartesian coordinates should yield a straight line of constant slope.
Once sufficient production history has been obtained under reasonably stabilized operating conditions, it is possible to extrapolate the historical plot to the anticipated abandonment pressure and thus arrive at an estimate of ultimate reserves.
Unfortunately, several factors will affect the validity of this method of estimation. If a full or partial water drive is present, the rate of pressure decline will be less than would have been observed had the reservoir been on a straight pressure depletion, as shown in Picture 1.
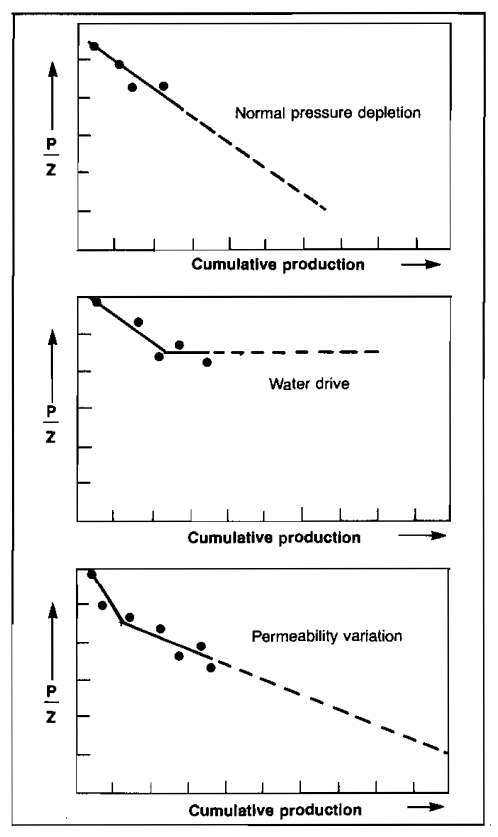
Such a decline would be erroneously interpreted as indicating a much larger reservoir than actually exists. The performance observed must thus be closely tied to the known geological configuration of the reservoir so that the reasons for the particular performance observed can be properly evaluated.
In certain other cases, it may be found that the gas reservoir is actually a gas cap on top of an oil reservoir. In this case, the pressure decline will be influenced by the rate of oil production and the evolution of solution gas from the oil into the gas cap as the pressure declines. In such a case, the entire reservoir must be analyzed, including the effects of the oil production rate and the effect of pressure reduction on solution gas. Transfer between the oil and gas cap can go either way depending on reservoir conditions of temperature, pressure, and fluid composition.
Variation in the reservoir permeability can also affect the observed pressure performance. A typical pattern is a sharp drop in the reservoir pressure during the early depletion, which will yield a very low ultimate recovery if extrapolated in a straight-line manner, but which breaks to a lower slope on a balance between the flow capacity of the unfractured matrix and the fracture system, as shown in the lowest diagram of Picture 1. In such cases, it is necessary to pass this breakpoint before any kind of reliable pressure decline estimate can be made.
In order to determine reserves by the pressure decline versus cumulative method, ideally one should have accurate cumulative production histories and accurate bottom-hole pressure data based on a shut-in period that is sufficient for the well to achieve static conditions. Although current practices normally yield adequate production data, bottom-hole pressure data is often sparce and, even when available, is based on short shut-in periods. The most usual test provided is a shut-in wellhead pressure test that was obtained to meet regulatory requirements or as a result of the well having been shut-in for some other purpose.
In the event that the well produces a dry gas without condensate or water present, it is a very simple matter to arrive at a reasonable estimate of bottom-hole pressure from a shut-in wellhead pressure. If the well is producing condensate and/or water with the gas stream when it is shut-in, there will usually be an accumulation of liquids in the bottom portion of the wellbore that will account for a substantial part of the bottom-hole pressure. Unless the depth to the liquid is reasonably known, it is impossible to estimate the bottom-hole pressure from the shut-in surface pressure. In such situations, bottom-hole pressure recordings are imperative.
In some cases, the slope of the p/Z versus Gp plot will decrease with increasing Gp. This can result from bad pressure or production data, loss of gas through leakage to some other formation, or abnormal reservoir pressure. A plot of p/Z versus Gp for an abnormally pressured gas reservoir is shown in Picture 2.
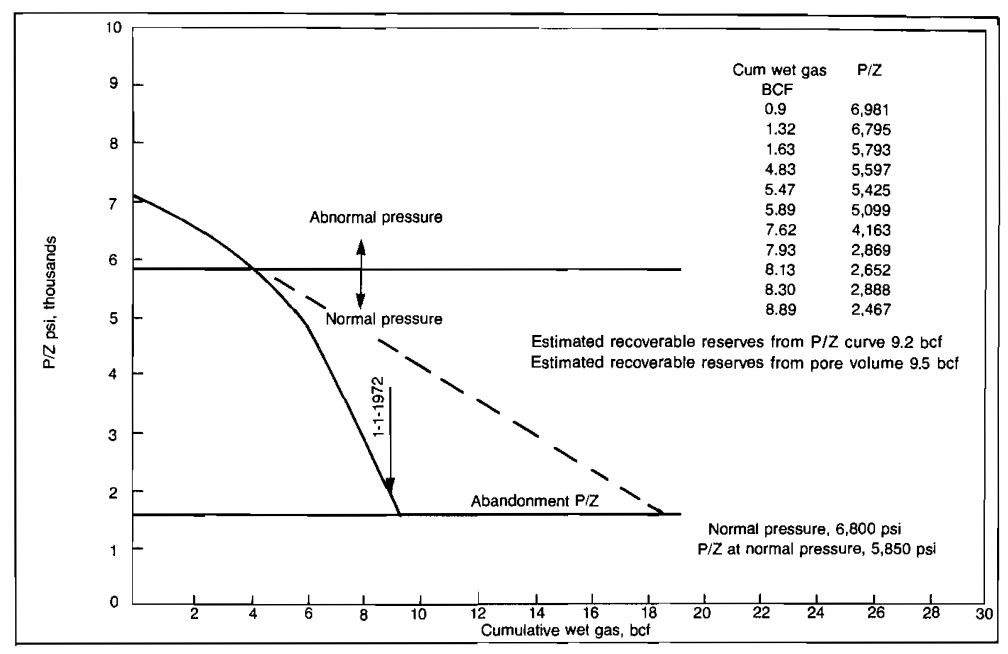
Once the reservoir pressure reaches a normal value, the slope remains fairly constant but is steeper than the initial slope. In this case, if the early data had been extrapolated to the abandonment conditions, a recovery twice the actual would have been predicted.
Energy Plots
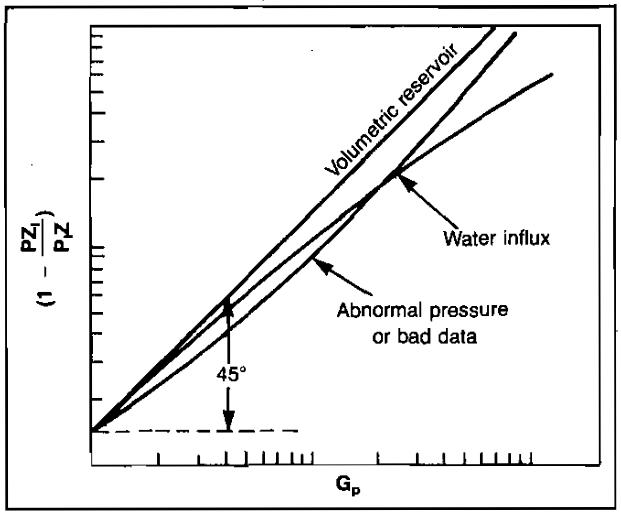
In Manual for Engineers to Calculate Amount of Gas in ReservoirsEssential Calculations of the Gas Reservoir Performance, it was shown that a plot of (1 – pZi/piZ) versus Gp on log-scales would yield a straight line with a slope of one for volumetric gas reservoirs.
These energy plots are very useful in detecting water influx or abnormal pressure very early in the life of the reservoir. An early estimate of gas-in-place can also be made more accurately than by using p/Z versus Gp plots. The principal reason for the advantage of using energy plots is that the slope of a p/Z plot depends on the initial gas-in-place, which may not be known early in the reservoir’s life. Therefore, the magnitude of the slope is of no value in detecting abnormalities. Enough data must be obtained to determine if a straight line plot occurs before problems can be detected.
Conversely, the slope of an energy plot must be one for normal behavior. Therefore, only enough data to detect deviation of the slope from 45° are required to reflect abnormal behavior. This could conceivably be only two data points. An example energy plot is shown in Picture 3.
Rate Versus Time Plots
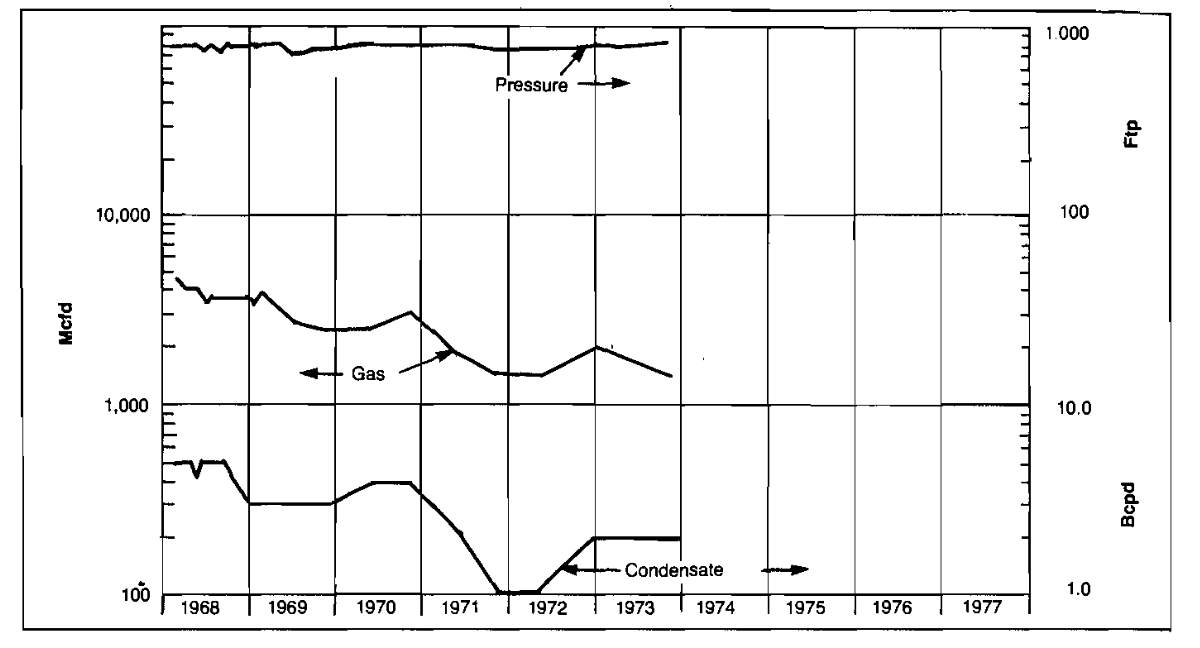
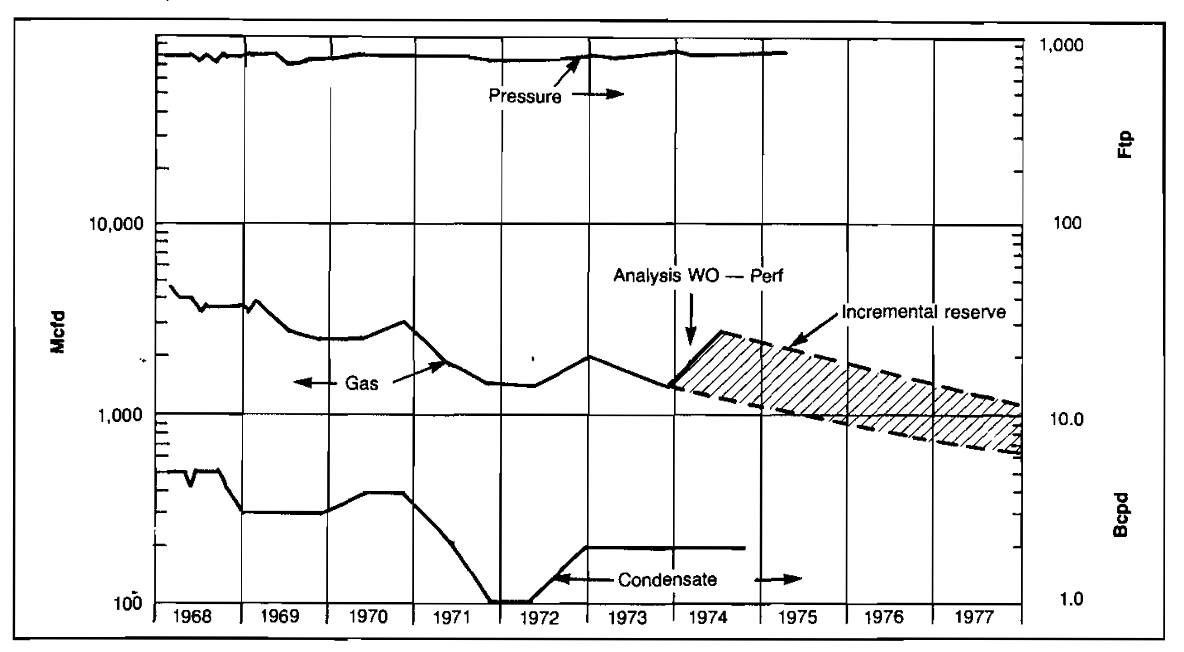
Various types of production problems can be detected by monitoring the performance of a gas well by plotting production rates of gas, condensate and water, and pressure versus time. A typical performance plot is shown in Picture 4.
Rate-time performance plots are especially useful when used in conjunction with well status maps. A well status map, such as shown in Picture 5, allows the engineer to compare the performance of wells in the same area and to determine if a well is performing abnormally compared to the other wells.
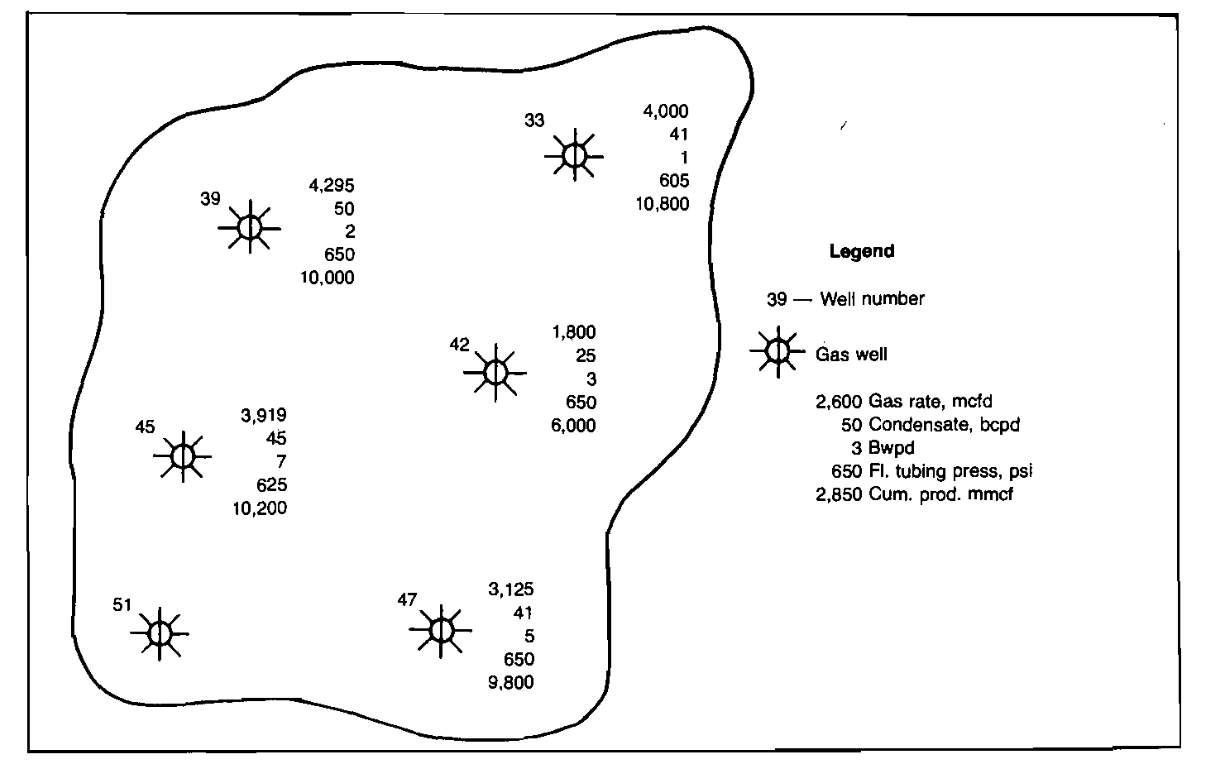
An example of abnormal production rate decline is shown in Picture 4. The well’s pressure remains high but the gas production rate is declining. Also, by comparing Well No. 42’s performance with the surrounding wells on the well status map, it can be seen to be producing at a much lower rate than the other wells. This could be caused by such things as formation damage or perforation plugging by scale. After this well was reperforated, performance improved considerably, as shown in Picture 6.
Water production problems can also be analyzed by observing rate-time plots. An increase in water rate without an increase in drawdown can result from normal advance in the gas-water contact in a water drive reservoir.
If the water rate increases after the gas production rate has been increased, tbis may indicate water coning. The well rate should then be reduced to see if the water rate returns to normal.
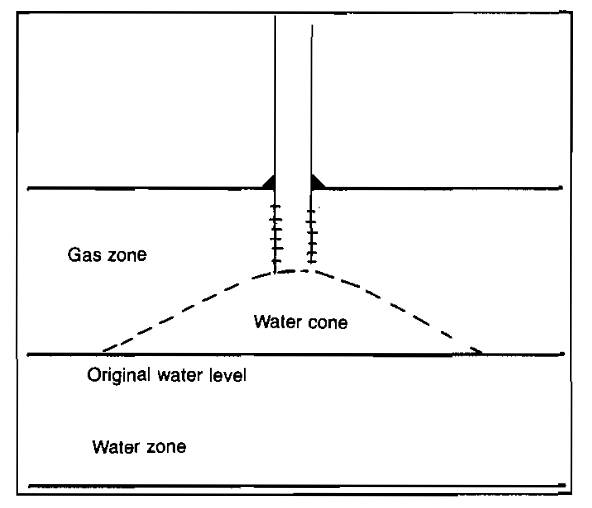
Water coning is the term used to describe the entry of water that underlies the gas in a reservoir under excessive drawdown pressures. The coning phenomenon is illustrated in Picture 7. If the vertical and horizontal permeabilities are known, a maximum allowable production rate to prevent water coning can be calculated.
Once the coning has occurred, a reduction in producing rate will not necessarily eliminate the problem. This results from the fact that once a high water saturation has built up around the wellbore, the permeability to water will have increased, and therefore a lower drawdown will be required to support the coning process. Even if the well is shut-in, capillary forces will usually prevent the water from subsiding to its original level. Therefore, if it is known that a gas reservoir is underlain by water, calculations should be made to estimate the maximum safe production rates for each well.
Hydrate Formation
Most natural gas contains substantial amounts of water vapor at the time it is produced from a well or separated from an associated crude-oil stream. Water vapor must be removed from the gas stream because it will condense into liquid and may cause hydrate formation as the gas is cooled from the high reservoir temperature to the cooler surface temperature. Liquid water almost always accelerates corrosion, and the solid hydrates may pack solidly in gas-gathering systems, resulting in partial or complete blocking of flow lines.
Hydrates are solid compounds that form as crystals and resemble snow in appearance. They are created by a reaction of natural gas with water, and when formed, they are about 10 % hydrocarbon and 90 % water. Hydrates have a specific gravity of about 0,98 and will usually float in water and sink in hydrocarbon liquids. Water is always necessary for hydrate formation as well as some turbulence in the flowing gas stream.
Causes, Occurrence and Prediction
The temperature at which hydrates will form depends upon the actual composition of the gas and the pressure of the gas stream. Therefore, the chart shown in Picture 8 cannot be completely accurate for all gases, but it is typical for many gases.
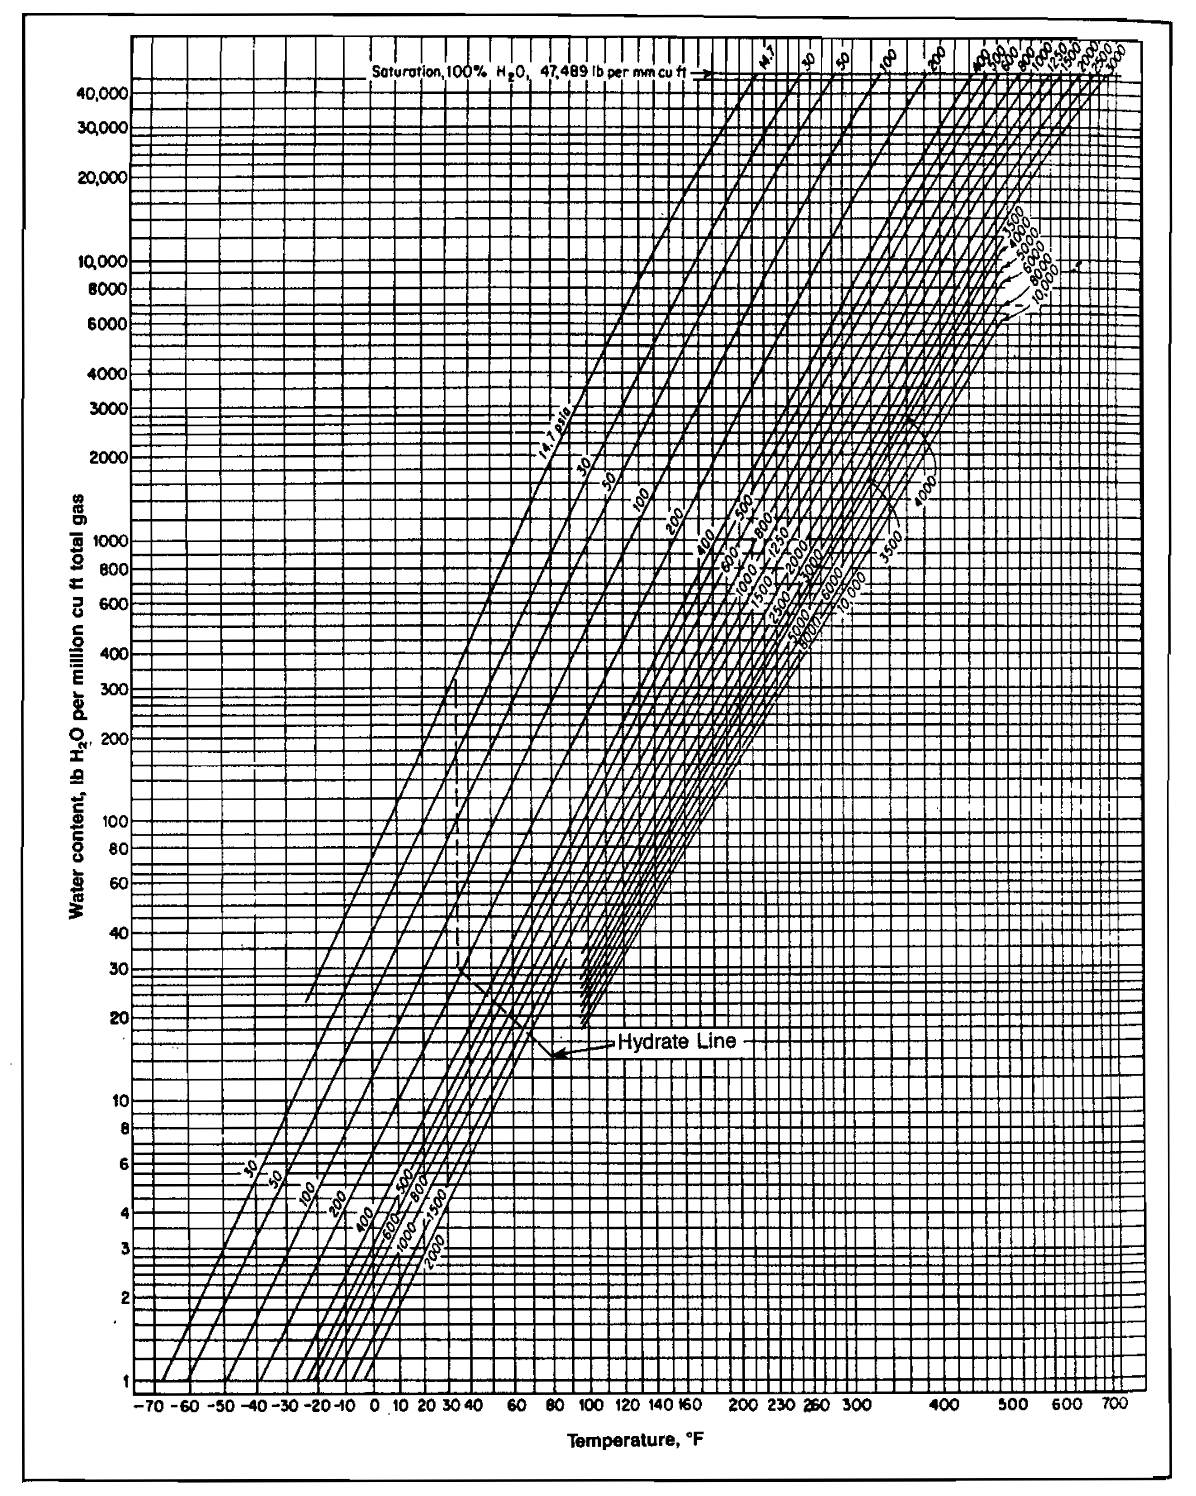
The chart shows the water content in pounds of water per MMscf of saturated gas at any pressure or temperature, The dotted line crossing the family of curves shows the temperature at which hydrates will probably form at any given pressure. Note that hydrates form more easily at higher pressures. At 1 500 psig, for example, hydrates may form at 70 °F, whereas at 200 psig, hydrates will not form unless the gas is cooled to about 39 °F. Each curve on the chart shows the water content of a saturated gas at that pressure when the temperature is at any of the various points shown along the bottom of the chart. For example, at 100 psia and 60 °F, each 1 million cu ft of gas would contain about 130 lb of water vapor. The same gas at 100 psia and 20 °F (instead of 60 °F) could only hold 30 lb per MMscf. At O °F, this gas could only hold 13 lb per MMscf.
It can thus be seen that as a gas is cooled, it can hold less water in the vapor form. Therefore, cooling a gas will cause some of the water vapor to condense with the balance remaining in the gas as water vapor. Pipeline specifications usually require that the water vapor content of natural gas be 7 lb/MMscf or less in order to minimize the problem of hydrate formation in the transmission lines from the field to ultimate user. In some fields, hydrates form in the tubing and the wellhead valves necessitating the application of heat down the hole to keep the well from freezing up. In most fields, fortunately, the temperature of the gas at the wellhead is 100 °F or more; therefore, the hydrate problem does not usually begin until the gas passes through the Christmas Tree.
An all-important factor in the movement of gas saturated with water vapor is the retention of the heat, which is in the gas when it is produced. The temperature is lowered at the wellhead when the gas is expanded through a choke to reduce the pressure and control the rate of flow. After passing the choke, the gas enters the gathering lines, which are cooled by the ground. The effects of the ground temperature are shown in Picture 9.
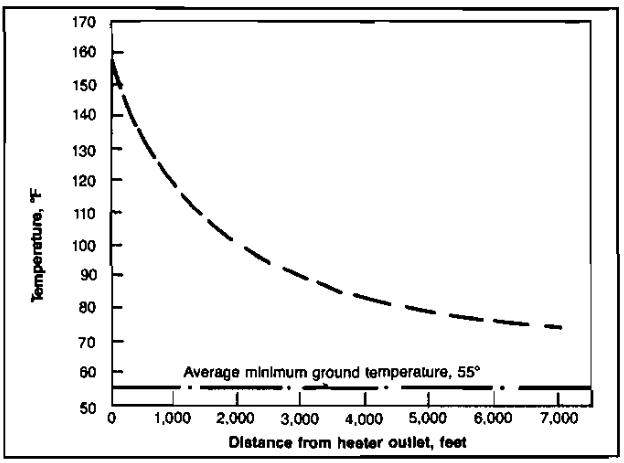
This curve was prepared from data taken in the Carthage gas field of east Texas. Gas leaving a heater at 160 °F had dropped to 75 °F by the time the gas had traveled 1-1/2 miles due to a ground temperature of 55 °F. At a higher rate of flow, the gas would travel farther before the formation of hydrates would become a problem. With a line pressure of 900 psi, it could be predicted that hydrates would form at a temperature of about 60 °F. Some of the flow lines in this field are as long as 15 miles between the well and the gasoline plant, so it would appear that this gas would need to be heated again before it reached the plant.
Minimum ground temperatures at a depth of 18 in. in the various gas-producing regions of the southwest are as follows:
- Upper Gulf Coast of Texas and Louisiana, 50 °F to 56 °F;
- Permian Basin, east Texas, and north Louisiana fields, 45 °F;
- Hugoton-Panhandle gas areas, 25 °F to 30 °F.
The figures are approximate and represent minimum values. The ground temperatures may be expected to reach higher levels than this during most of the year, especially in the southern part of Texas and Louisiana. On the other hand, it is probable that in the gas-producing areas of the Rocky Mountain states and in western Canada, the frost line is below the 18-in. level. Gas lines in those areas should be buried at correspondingly greater depths.
It is convenient to divide hydrate formation into two categories:
- Hydrate formation due to a decrease in temperature, with no sudden pressure drop, such as in the flow string or surface lines and;
- Hydrate formation where a sudden expansion occurs such as in flow provers, orifices, back-pressure regulators, or chokes.
Hydrate Formation in the Flow String and Surface Lines
As mentioned above, free water is essential to hydrate formation. Free water is almost certain to be present during well testing since gas reservoirs are essentially water saturated, and a decrease in temperature results in a lower solubility of water in gas. The hydrate temperature depends on the pressure and composition of the gas. Picture 10 gives approximate values of the hydrate temperature as a function of pressure and specific gravity.
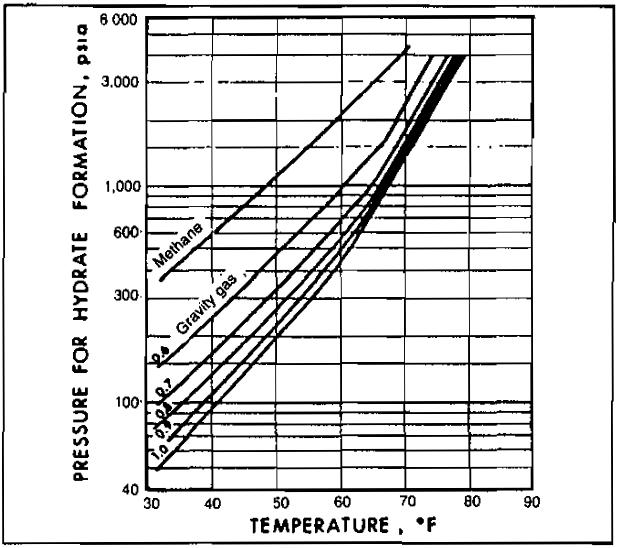
with various gravities
Hydrates will form whenever temperature and pressure plot to the left of the hydrate formation line and the water dew point line for the gas in question. The water dew point may be obtained from Picture 8 as follows:
Find water content Ws at
- Draw a horizontal line on Picture 8 at Ws.
- Read the dew point temperature for various pressures at the intersection of the horizontal line and each pressure line.
Example 1:
A gas of specific gravity 0,8 is at a pressure of 1 000 psia. To what extent can the temperature be lowered without hydrate formation, assuming presence of free water?
Solution:
From Picture 10, at a specific gravity of 0,8 and a pressure of 1 000 psia, hydrate temperature = 66 °F. Hydrates may form at or below 66 °F.
Picture 10 is applicable only to sweet natural gases. For sour gases it may be used, keeping in mind that the presence of H2S and CO2 will increase the hydrate temperature and reduce the pressure above which hydrates will form. In other words, the presence of H2S or CO2 enhances the possibility of hydrate formation.
Hydrate Formation in Flow Provers, Orifices and Back-Pressure Regulations
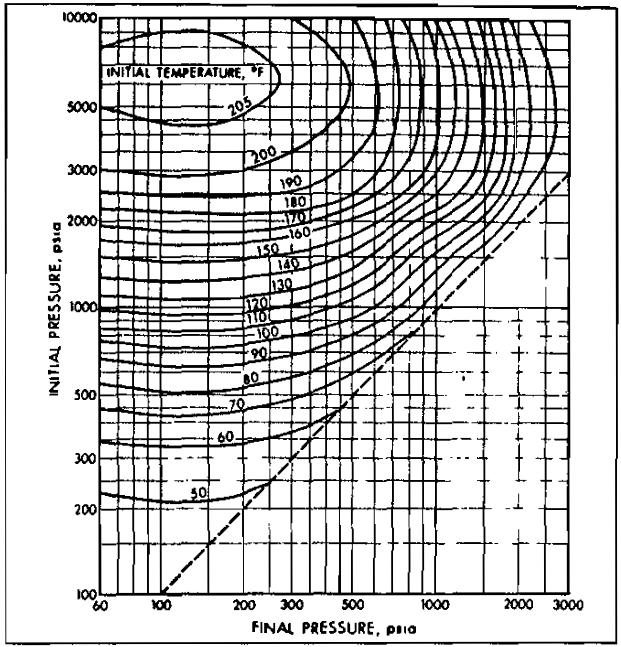
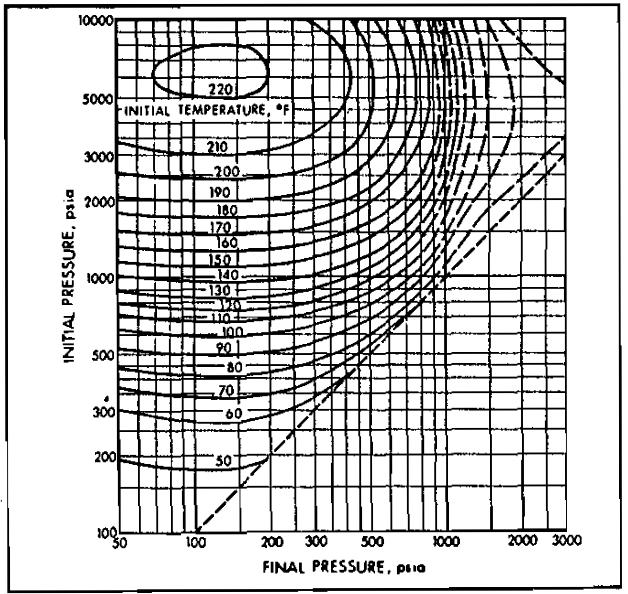
Sudden expansion in one of these devices is accompanied by a temperature drop, which may cause hydrate formation. Pictures 11 through 15 may be used to approximate the conditions for hydrate formation.
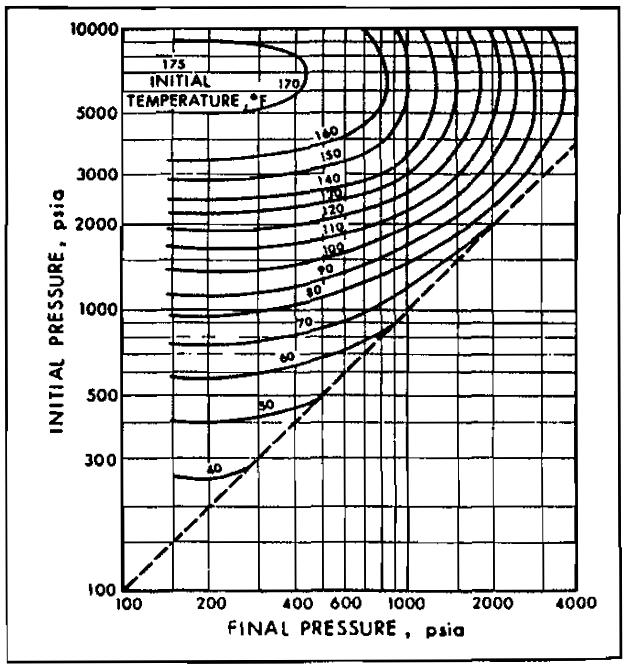
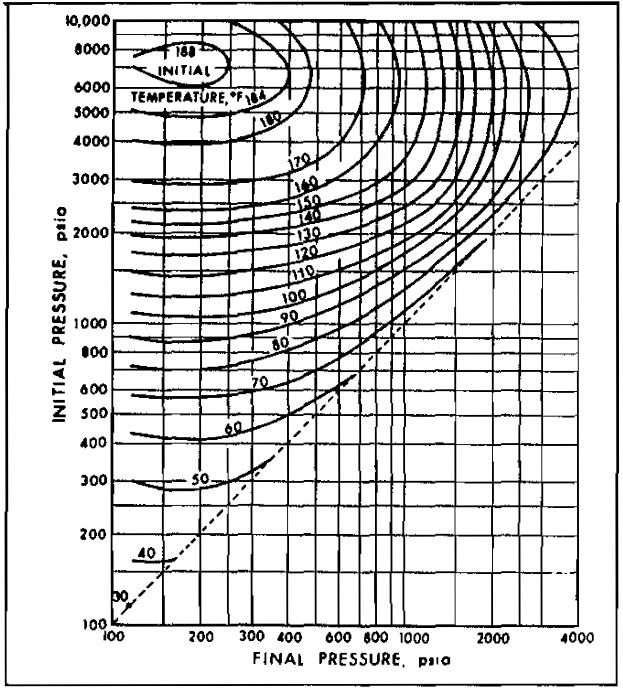
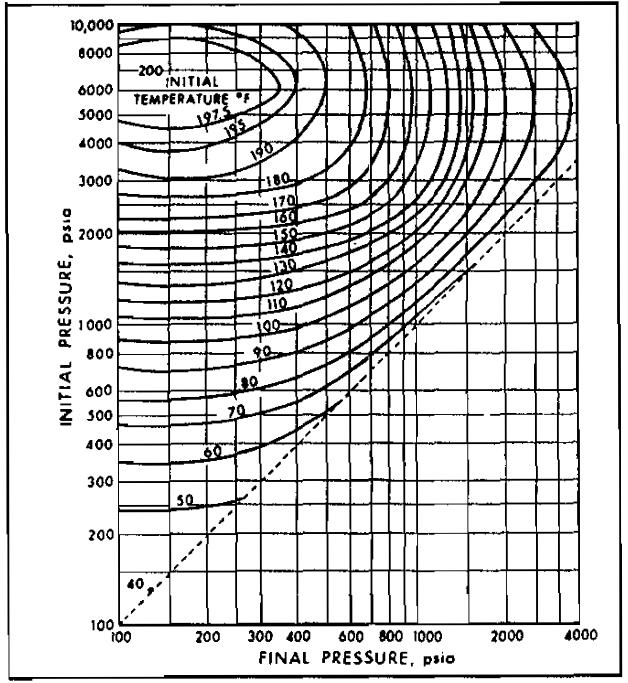
The limitations of Picture 10, discussed above, also apply to Pictures 11 through 15. Pictures 11 through 15 may be used for gases of other specific gravity by linear interpolation.
Example 2:
A 0,8 specific gravity gas is to be expanded from a pressure of 1 000 psia at 100 °F. Determine the minimum final pressure for no hydrate formation.
Solution:
From Picture 13, the intersection of the 1 000 psia initiai pressure line with the 100 °F initial temperature line gives a finai pressure of 440 psia, Therefore, lowering the pressure below 440 psia wili possibly result in hydrate formation.
Example 3:
A 0,6 gravity gas is to be expanded from 1 000 psia to 600 psia. What is the minimum initial gas temperature permitted without the danger of hydrate formation?
Solution:
From Picture 11, the 1 000 psia initial pressure line intersects the 600 psia final pressure line at an initial temperature of approximately 74 °F. Therefore, if the gas is cooler than 74 °F at 1 000 psia, hydrates may form on expansion.
Hydrate Control
Ammonia, brines, glycol, and methanol have all been used to lower the freezing point of water vapor and thus prevent hydrate formation in flow lines. Low-volume injectors or pumps are used to feed the inhibitor fluid into the gas flow system. Methanol and glycol are the inhibitors most widely used; however, they are expensive. When hydrate problems arise so rarely that the installation of a heater or dehydration equipment is not economically feasible, methanol or glycol are usually used. For example, in some fields gas-producing operations may be carried out without hydrate trouble except for two or three days each year. Injection of inhibitors might conceivably be preferred in such cases over investment in additional equipment. More information about hydrate control by methanol injection can be found in Separation of the Gas Produced in Field from Unnecessary Components“Gas Processing and Separation During Natural Gas Production”.
In a majority of the situations where dehydration of the gas is not economical and where some measures must be adopted to control hydrate formation, application of heat is the method used. The reasons for this are: initial investment is not excessive, fuel is conveniently available, and the heaters operate with a minimum of attention. Where it is desirable to handle the gas by means of temporarily holding the temperature above the ground temperature, heaters seem to offer the best solution. For long-distance transmission, the gas will eventually reach the groundtemperature and, for such gas movement, water will ultimately have to be removed.
Most natural gas is produced at relatively high flowline pressures, ranging from 1 500 to 10 000 psig, and then transferred to pipelines operating at 1 200 psig and lower. Heat must almost always be used to compensate for the natural refrigeration of the gas, which is caused by this pressure reduction. An indirect heater is the most widely used heater for natural-gas well streams because it is simple, economical, and if properly sized, is usually trouble-free. Field treating of natural gas is described in more detail in Separation of the Gas Produced in Field from Unnecessary Components“Gas Processing and Separation During Natural Gas Production”.
Sour Gas Production
Many natural gas reservoirs contain hydrogen sulfide (H2S) and carbon dioxide (CO2) along with the hydrocarbon gases. These two gases are called acid gases because they form acids or acidic solutions in the presence of water. A gas is called sour if it contains (H2S in amounts above the acceptable industry limits, usually about four paris per million.
Since the early 1970’s, many deep, high-pressure sour gas reservoirs have been discovered in France, Germany, Canada, and the United States. Producing these gases involves several problems not encountered in normal gas production operations. Some of these problems are:
- Toxicity – H2S is an extremely poisonous gas, and therefore special safety measures are required.
- Sulfur deposition – sour gases with high H2S contents often contain desolved elemental sulfur. Under certain conditions this leads to sulfur precipitation in the formation, tubing, and gathering lines.
- Corrosion – the extreme corrosivity of sour gases, especially in the presence of brines, causes problems such as tubing and surface equipment failure.
Corrosion
Corrosion can be defined as the deterioration of a metal or its properties because of a reaction with its environment. Corrosion due to H2S occurs in three ways:
- In the presence of water, where H2S forms an acidic solution that causes pitting and/or a continuous metal loss;
- Blisters and pitting resulting from hydrogen diffusion into the metal, and;
- Stress corrosion cracking.
The first corrosion type is extremely difficult to define and predict. Without CO2 and/or oxygen also being present, H2S will not necessarily be corrosive. H2S reacts with steel to form a film that tends to stop corrosion. If CO2 is present, it combines with water to form carbonic acid. This reacts with steel and causes a continuous washing away of the metal. It also washes away the protective H2S film, and the H2S corrosion rate is accelerated considerably.
Hydrogen diffusion occurs when the atomic hydrogen (H) from the reacting surface of steel diffuses into the crystal structure, concentrating in voids, inclusions, and minor laminations. The atomic hydrogen changes to non-diffusable molecular hydrogen, building up high localized pressures that lead to blistering and corrosion pitting.
Stress corrosion cracking, sometimes called sulfide stress cracking, also results from embrittlement of the steel by the atomic hydrogen diffusion into the crystal structure. The exact failure mechanism is uncertain, but the failure is normally spontaneous. Three factors must be present before this phenomenon will occur:
- Materials must be susceptible to stress corrosion cracking; this would include any carbon, alloy, or stainless steels with a hardness over 22 on the Rockwell C scale;
- H2S and water (in the liquid phase) must be present, and;
- The metal must be under dynamic or static stresses.
The general H2S corrosion reaction can be stated as:
When CO2 dissolves in water, it forms carbonic acid, decreases the pH of the water, and increases its corrosivity.
In a gas-condensate well with few dissolved minerals and at relatively high temperatures, pressure is the controlling factor influencing CO2 corrosivity. The partial pressure of CO2 can be used as a criterion for predicting corrosivity of gas wells producing CO2. The partial pressure of CO2 can be calculated from:
Using the partial pressure, the following relationships have been found:
- above 30 psig usually indicates corrosion;
- between 3 psig and 30 psig may indicate corrosion, and;
- less than 3 psig generally is not considered corrosive.
The combination of H2S and CO2 is even more aggressive than H2S alone. Also, even minute quantities of oxygen can accelerate corrosivity tremendously.
Corrosion Control With Inhibitors
The types of applications that have been used for gas wells cover a wide range including batch and continuous methods such as:
- Low volume, pump, and fall;
- Tubing displacement;
- Inhibitor carried or pushed with nitrogen;
- Continuous injection, and;
- Formation squeeze.
In the types of wells encountered in the past, there was a continuously available liquid phase in the tubing bore that carried the inhibitor and distributed it to all of the surfaces that needed protection. In deep, hot wells, the tubing bore, and especially the formation, experiences an essentially dry condition with very little liquid to carry and distribute the inhibitor. Thus, special phase behavior requirements are placed on the inhibitor and on the solvent/carrier used in the application. Because of these latter considerations, two of the more popular modern treatment media are water and nitrogen used either as pusher or as carrier for the inhibitor mixture.
The Short Batch Method of Application
Traditionally, the short batch method has used 5 to 50 barrels of inhibitor solution containing one-half to five drums of inhibitor carried in water (as a dispersion of oil soluble inhibitor or perhaps as a solution of a water soluble compound), or diesel, or sometimes condensate. The inhibitor mix is pumped into the shut-in well and allowed to travel to bottom. Radiotracer investigations have shown that the liquid mix bridges over at the top of the hole and fllls the tubing bore. Then a film of liquid falls down the tubing walls proceeding from the bottom of the filled column as a bubble of gas rises through the center of the liquid column. To get proper distribution of inhibitor from top to bottom of the string requires about one drum of inhibitor mixed in 7 to 10 barrels of diluent for each 10 000 feet of depth. If significant evaporation of diluent occurs in the hole, then even larger treatment volumes are required to get even distribution of inhibitor from top to bottom. Of course, if corrosion occurs only high in the hole, proper distribution all the way to bottom and consequent large volumes are not required. Even so, in especially hot wells, there is a tendency for flash evaporation of diluent to form tiny bubbles and a stabilized foam at the bottom edge of the liquid column of the inhibitor mix. Many times these foams prevent proper fall of the mix because they are too viscous to run down the tubing walls. Sometimes the addition of a surfactant helps.
The combination of possible evaporation and of not falling to bottom makes it difficult to achieve good corrosion control by this method when applied to deep, hot wells where corrosion occurs deep in the hole. Possibly with appropriate use of water or of a special solvent with a very high boiling point, the method would be more feasible. Since gases always contain water vapor, when water is used as solvent/carrier, fewer moles are required to achieve complete saturation than if diesel or some other solvent is used that is not contained in the gas. Furthermore, one barrel of water contains 19,6 moles of water; whereas one barrel of diesel contains 1,5 moles of hydrocarbon. Thus, it is ten times easier to increase the mole fraction of carrier in the hole by injection of a few barrels of water than by injection of diesel. Water is also cheaper than diesel or other solvents and less hazardous to pump. However, truly water soluble corrosion inhibitors are sometimes less effective than oil soluble compounds. Thus, frequently oil soluble/water dispersible compounds are chosen for use with water as a carrier.
For wells in the mid to upper range of the deep, hot category, it is desirable to put in enough diluent to displace from 1/4 to 1/2 of the tubing volume (for a 20 000 foot well, the range is from 20 barrels for 1/4-full 2-3/8-in. tubing to 120 barrels for 1/2-full 4-in. tubing). After the mix is pumped, the well is shut-in for four to eight hours for each 10 000 feet of tubing. This recommended volume provides for guaranteed treatment of the top 1/4 to 1/2 of the tubing surface as well as allowing for approximately half the diluent to evaporate as the solution falls, leaving enough liquid to distribute evenly. Of course, the gas that is displaced from the tubing back into the formation does not have to be saturated, and this lowers the evaporation volume requirement. When full coverage is achieved, the indicated corrosion rate will be reduced to at least as low as 25 % of the uninhibited value.
The life of a treatment will depend on how much total inhibitor is left in the hole. Many times, analyses of inhibitor returns immediately after the treatment show that 80 % or more of what went into the hole is produced back out almost immediately. This leaves only 20 % to provide protection in the hole. This condition is especially true when not much of the inhibitor mix falls below the injection depth. As the inhibitor mix falls to bottom, a thin liquid film is formed-approximately 0,030 in. thick. When the well returns to production, some of this liquid is swept off by the gas flow, but much of it is evaporated into the undersaturated formation gas, leaving solvent-free inhibitor behind so that with a successful application, only 20 % or so of the inhibitor is brought back out of the hole immediately.
The Tubing Displacement Method
By this method of treatment, a tubing full of fluids is pumped into the well with the objective of displacing inhibitor completely top to bottom to ensure contact with the tubing surface. The most common mode of treatment is to use inhibitor-free solvent to push to bottom 2 to 20 barrels of a concentrated inhibitor solution (5 to 20 %; sometimes 100 % inhibitor is used). Diesel or condensate are the most frequently chosen solvents for the inhibitor mix, although sometimes special aromatic or higher boiling point solvents are chosen. Water, nitrogen, or natural gas are frequently used to push the mix to bottom. Diesel and condensate are also used.
Although it is fairly certain that all of the surface is contacted with inhibitor when this method is used, it is not certain how much film is left behind. If the volume of inhibitor mix is too small and is pushed with a non-miscible solvent, then there may be a lack of adequate distribution of inhibitor to all the necessary areas of the tubing surface because of spiralling flow down the hole or other factors. These factors are especially likely to occur when neat, oil soluble inhibitor is pushed with water or gas.
The inhibitor mix chosen for these treatments should be relatively nonvolatile in the hole so that as little as possible evaporates and as much of the liquid volume as possible is available to form a film on the tubing surface. When a liquid displacement is made, the gas volume in the hole decreases to a small volume so that there is no problem achieving saturation on the down trip. However, as gas flows out, displacing the push fluid, redistribution of inhibitor is aided by a nonvolatile mix. In order for the treatment to be effective for a long time, the same volatility principles apply to the active ingredient (that is, nonsolvent components) of tubing displacement compounds as for limited batch compounds. The immiscible push mode produces the best retention of inhibitor in the hole but runs the risk of poor distribution so that not all the corrodible areas are covered.
Methods of Inhibitor Application Using Nitrogen Gas
Nitrogen gas is frequently used to push a slug of inhibitor mix to bottom. The principles of this mode are the same as for the other tubing displacement methods. The other mode of nitrogen application is to displace the gas in the hole with nigrogen gas containing a mist of inhibitor solution. One to four drums of inhibitor contained in a 2 % to 50 % solution are used. Nitrogen is taken to the well site in liquid form and expanded into gaseous form at a pressure slightly greater than that in the well. Displacement is calculated from the gas law modified to account for deviations of nitrogen from an ideal gas. The inhibitor mix is aspirated into the flowing gas as droplets and carried with it to bottom. Rapid displacement helps ensure that the mist droplets penetrate all the way to bottom. After the weIl is shut-in for a few hours, the inhibitor mist settles onto the tubing walls. It is desirable to resume flow in the well at a relatively slow rate and then build up to full flow rate. In this way, solvent evaporation fixes the active inhibitor ingredient on the tubing walls with only a minimum amount swept back out of the well. Thus, this method offers the best possible utilization of inhibitor. Evaporation and other removal processes operating after a nitrogen treatment are identical to those operating after a short batch or tubing displacement treatment.
Method of Continuous Treatment with Inhibitors
The most effective and reliable method of corrosion control is to continuously add inhibitor to the bottom of the producing string in an adequate amount to cover the surface and with an amount of liquid carrier adequate to produce a liquid phase condition in the hole. When these conditions are met, the periodic corrosion rate highs and lows found in the batch methods are avoided. Thereby overall metal loss is significantly less over the life of the downhole equipment, and thus the chance for premature failure is greatly reduced.
The two methods most widely used for conducting the inhibitor to the bottom of the well are the use of a tubing kill string and injection down the annulus through a bottom-hole chemical injector valve. In some cases, a parallel string of tubing is run and used for chemical injection. Picture 16 (a) shows the installation of a kill string.
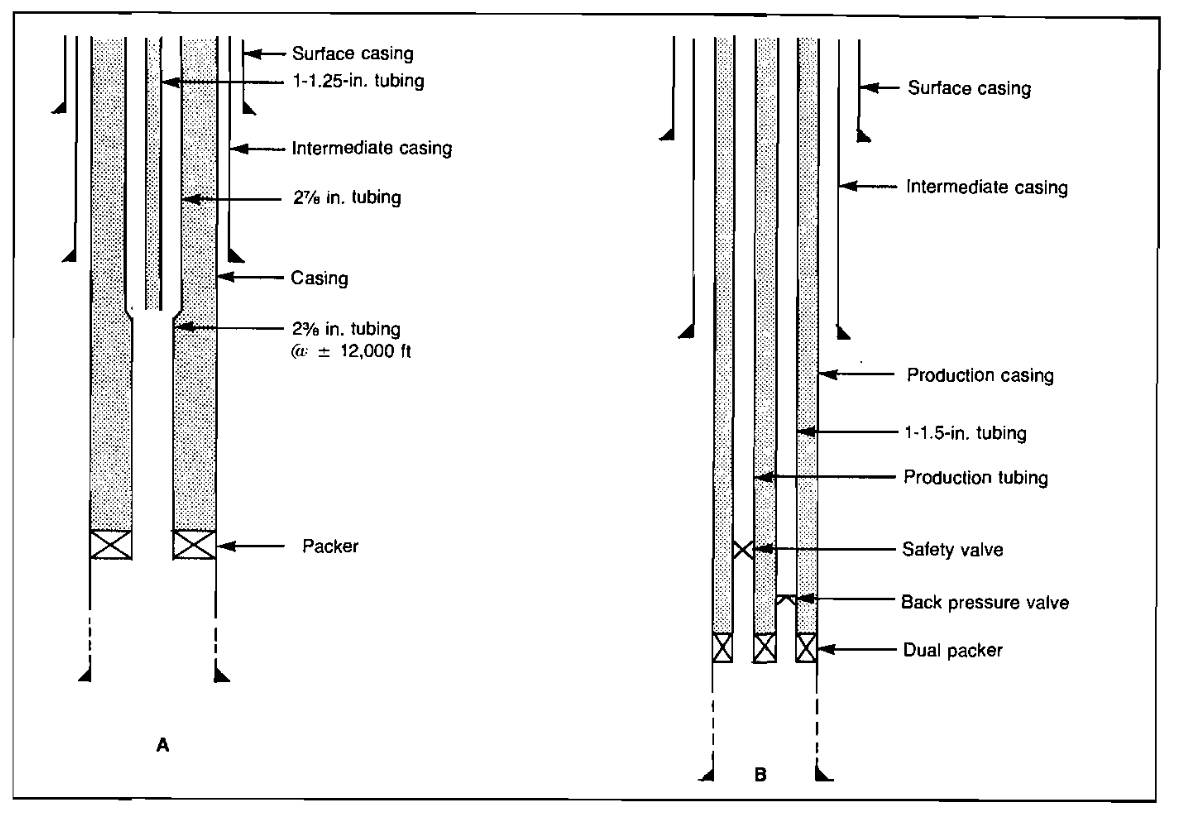
The primary purpose of the kill string is to provide a means to fill the well with a high density fluid that kills the well so that it may be entered safely for workover operations. It also provides a means for continuous or batch application of inhibitor. If the kill string does not extend to the bottom of the tubing, a baked-on plastic coating is usually used for tubing protection below the kill string.
Picture 16 (b) also illustrates a parallel kill string that allows inhibitor to be pumped to the bottom of the hole. While this type of completion costs more initially, it eliminates the need to interrupt production to inhibit the well. This would be necessary if both the kill string and the tubing-kill string annulus were normally used to conduct fluids to the surface. Positive injection below the packer can be accomplished by placing a check valve in the kill string and loading the string with inhibitor.
The completion shown in Picture 17 utilizes a packer and a bottom-hole chemical injection valve. The tubing-casing annulus is filled with inhibitor. Pressure applied at the surface forces the injection valve to open.
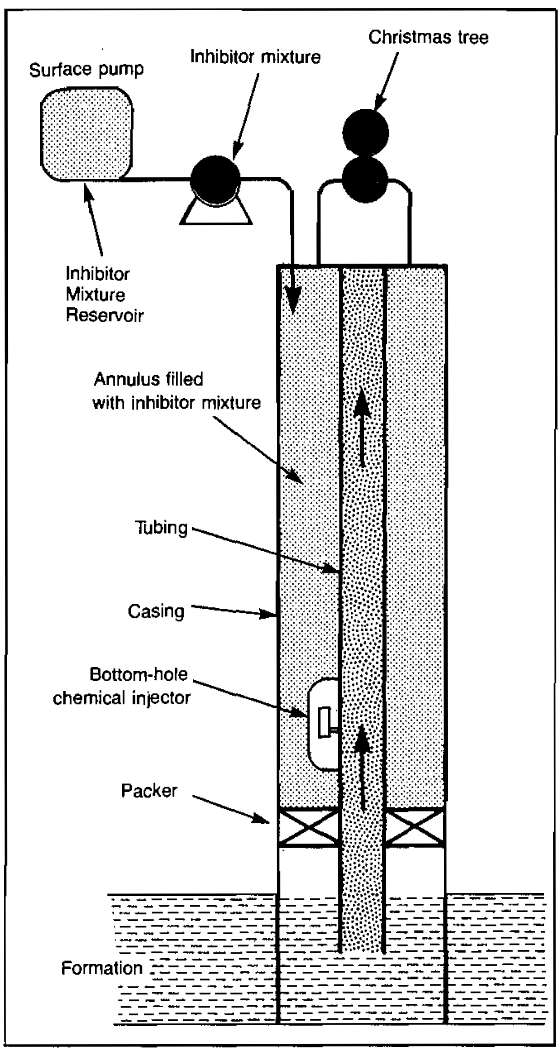
From a technical standpoint, the parallel tubing string concept is preferable to the use of downhole injection valves. Solids can plug injection valves, and the bottom-hole pressure may exceed the desired working pressure of the casing annulus. Another advantage of the parallel tubing string concept is that the inhibitor mixture or the neat inhibitor is not exposed for such long periods to elevated temperatures and pressures. The inhibitor reaches the bottom of the well in a much shorter period, and thermal degradation of the inhibitor is minimized.
High alloy, high strength capillary tubing is available for use in gas wells by coupling it to the tubing at bottom-hole and running it into the hole with the tubing string. A high pressure liquid pump is used at the surface to inject neat chemical at bottom-hole by pumping through the capillary tubing. Because of friction losses, as much as 20 000 psi injection pressure is required to overcome downhole pressure and to put up to 20 gallons per day of chemical into the wellbore. To maintain adequate flow rate, the viscosity of the chemical must remain low while contained in the capillary tubing, and it must be free of solids. For this latter reason, very fine pore size filters are incorporated into the system to prevent plug-ups.
Up to now, these applications have been used for cooler, low pressure wells. However, because of the evidence reported above, where some compounds appear to have a low enough vapor pressure, it now appears possible to use the method for some deep, hot wells in the lower end of the range. It must be recognized that low volatility, good thermal stability, and low solids requirements are extremely stringent for this application.
This system of inhibitor injection has been used successfully in the Gulf Coast area of the U. S. Some of the advantages claimed for the small tubing system are:
- Assures delivery of clean, debris-free inhibitor to the downhole injection chamber.
- Capillary volume is small, minimizing time and well temperature effects on the inhibitor.
- Inhibitor types and injection rates can be quickly changed.
- Design of the capillary system minimizes possibility of communication between tubing and casing annulus.
- Capillary can be used for batching of combination treatments, i. e., corrosion and scale inhibitors, foaming agents, cleaning agents, and methanol.
- Capillary can be used for continuous recording of bottom-hole pressures.
Formation Squeeze
The corrosion inhibitor squeeze treatment involves placement of an inhibitor solution into the producing formation. Its principal advantages are that:
- It can be used in tubingless or multiple completions and;
- Treating frequency is reduced
It may be effective for 3 to 18 months, depending on the inhibitor, the formation, the placement technique, and the fluids being produced. In the squeeze treatment, a relatively large volume of inhibitor (1 to 4 drums) is mixed in a compatible diluent (10 to 20 % inhibitor). The mixture is displaced down the tubing and into the formation. The amount of displacing fluid is normally 25 to 75 drums plus the tubing volume. When a well is returned to production after a squeeze, the initial concentration of chemical in the returned fluids is high, with a relatively fast decrease in concentration with production. A protective film is thus formed on the metal surfaces during the squeeze operation and during the short time that the chemical concentration in the returned fluid is high. The continuous return of chemical at a lower concentration maintains the initially formed protective film. When the returning inhibitor can no longer repair the protective film as rapidly as it is removed, the effectiveness of the treatment declines.
Practically all types of formation materials will adsorb the various squeeze inhibitors to some degree. The adsorptive capacities of clays are several hundred-fold greater than the capacity of sand or limestone. Adsorption in sand or limestone is reversible. Much of the inhibitor adsorbed by clays is bound so tightly that it is irreversibly adsorbed and unavailable for desorption. However, clays adsorb such a large amount of inhibitor that the fraction that desorbs can still provide substantial corrosion protection. During desorption, the inhibitor concentration in the produced fluid falls rapidly to a few hundred ppm, and then the inhibitor continues to be desorbed at low concentrations for several hundred pore volumes of hydrocarbon production. Because of irreversible adsorption, only a portion of the originally adsorbed inhibitor is desorbed. Obviously, more inhibitor should be used on the initial squeeze (2 to 4 drums).
Significant permeability reduction seldom occurs from the action of corrosion inhibitors on formations; however, clays present in many sandstones are often sensitive to inhibitors and may swell or disperse upon contact with the inhibitor. The resulting permeability changes vary widely, although most are negligible. In areas where formation damage has been known to occur or in which sensitive clays are known or suspected to exist, core samples from the formation should be tested and an inhibitor selected that does not cause damage.
Sulfur Deposition
Sulfur deposition problems can arise in the production of deep sour natural gas reservoirs if a source of elemental sulfur exists and fluid composition and pressure/temperature changes have appropriate characteristics.
There is a greater potential for sulfur deposition if:
- H2S content is high;
- Condensate (C5+) content is low;
- Aromatic components are not present in the fluid;
- Bottom-hole pressure and temperature are high, and;
- Pessure and temperature changes from formation to wellhead are high.
The sulfur-carrying capacity of the produced fluid is principally due to hydrogen polysulfide formation and/or physical dissolution of the sulfur in the dense fluid. The relative importance of these two mechanisms at very high pressures may well determine whether sulfur deposition will be a serious problem in ultra-deep sour gas wells.
Some control of sulfur deposition is possible by limiting pressure/temperature changes through production rate, and a variety of physical and chemical solvents are available for well injection to remove sulfur as it is deposited. Physical solvents are adequate for low or moderate sulfur deposition. Solvents that function by chemical incorporation of the sulfur into the molecular structure of the solvent have much higher sulfur carrying capacity and may be required in cases where sulfur deposition is heavy.
It should be recognized that if elemental sulfur is deposited in formations, tubing, gathering lines, or inlet separators, such depositions may be minimized by heating and maintaining high pressures that discourage sulfur deposition in production equipment and gathering lines, or the sulfur may be removed by continuously or periodically injecting appropriate solvents into the tubing or gathering lines. Solid sulfur that is contained in the inlet well stream normally is carried away, and disposed of, with liquid oil or condensate products.
In the event that a high hydrogen sulfide content lean gas stream is processed, it may be necessary to squeeze the formation or to wash wells periodically with solvent. Such squeezing or washing also removes some of the deposited sulfur from the gathering lines.
Safety
High pressure sour gas can be produced safely, but because of the serious consequences that can arise if this gas is released near a populated area, special attention must be given to safety and contingency planning.
Contingency planning is complex and must be thoughtfully detailed for the locale of each sour gas operation. Among other things, the plans should be based on population density, local terrain (including roads), housing and medical facilities, and local weather patterns.
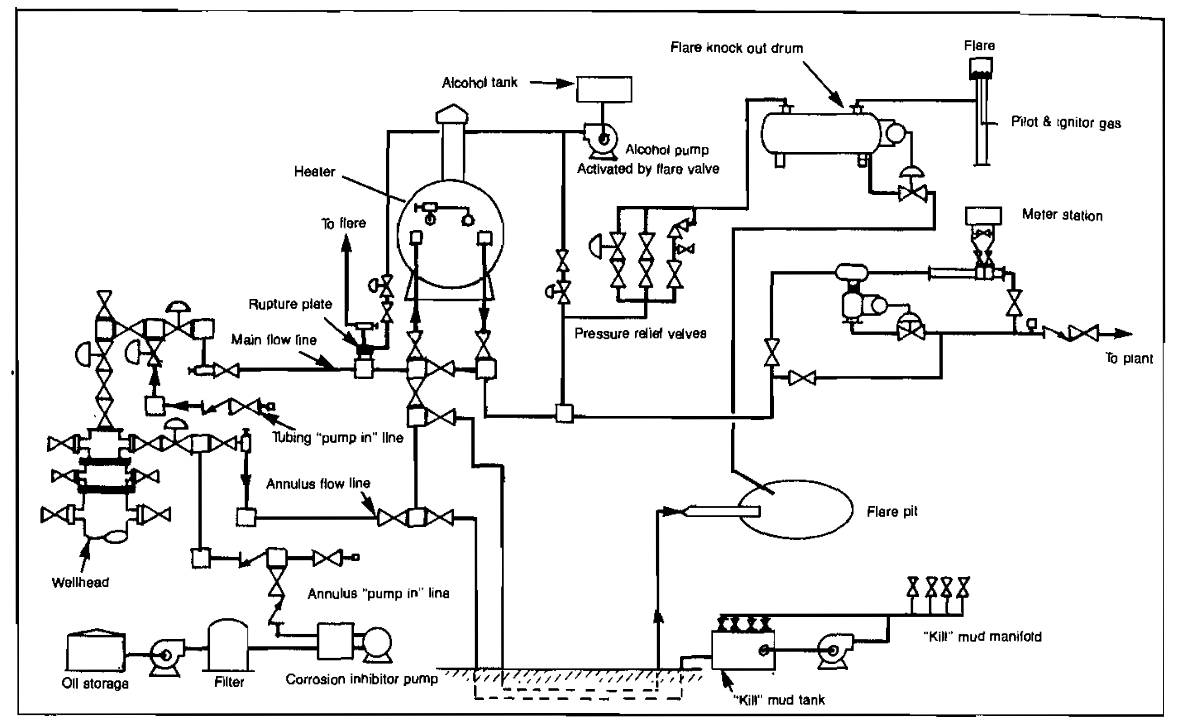
Facilities should be provided to shut-in a well automatically in case of leaks. A typical facility for accomplishing this is shown schematically in Picture 18.
Some of the safety procedures to be observed when working around sour gas facilities are listed below.
1 In low concentrations, H2S has a characteristic odor of rotten eggs and a sweet taste. In higher concentrations, the sense of smell is quickly paralyzed. The sense of smell, therefore, can never be relied upon to indicate the amount of H2S present.
2 Hydrogen sulfide may be present in natural gas produced alone or in combination with crude oil. Concentrations may be from the faintest odor to a percentage that will result in sudden death. Accordingly, whenever H2S is present, respiratory protection is of extreme importance.
3 Hydrogen sulfide is heavier than air, having a specific gravity of 1,19 with respect to air, so heavier concentrations will be found at ground or lower levels, such as well cellars, open ditches, and natural topographical low spots.
4 Hydrogen sulfide is highly flammable and has an explosive range of 4,3 % to 45,5 % concentration by volume in air.
5 When H2S is known to be present in natural gas or crude oil, all products are handled in systems designed to confine and, when necessary, dispose of the gas in a safe manner.
6 When, through accident, leakage or necessary opening of a closed system, H2S becomes present in the atmosphere, prescribed respiratory protection should be worn.
7 Whenever hydrogen sulfide is present or thought to be present, the H2S content must be determined, or an air supplied breathing apparatus must be used.
8 If eyes become irritated or a halo is noticed around an electric light while working in a plant or area that has been determined to be “safe” from H2S, take the following precautions:
- Leave the location at once.
- Wash eyes thoroughly with water.
- Wear air supplied respiratory equipment with full face protection, if necessary, to return to the location.
9 Permissible limit of concentrations of H2S for continuous exposure during an 8-hour period is 0,001 %, or 10 parts per million by volume in air. Exposure to higher concentrations of H2S will have the following effect:
- 0,001 to 0,010 % (10 to 100 ppm) for 30 to 60 minutes results in eye and respiratory tract irritation.
- 0,010 to 0,020 % (100 to 200 ppm) for 2 to 15 minutes results in loss of sense of smell; exposure for 8 to 48 hours may be fatal.
- 0,020 to 0,050 % (200 to 500 ppm) for 1 to 4 hours will be fatal.
- 0,050 to 0,060 (500 to 600 ppm) for 30 to 60 minutes is fatal.
- 0,060 to 0,150 % (600 to 1 500 ppm) for 2 to 15 minutes is fatal.
10 Since the result of exposure to H2S is paralysis of the nerves controlling respiration, persons stop breathing and lose consciousness quickly. If the victim is promptly removed to a clear area and artificial respiration is started immediately, the chances of complete recovery are good.
Any delay in the start of artificial respiration appreciably reduces chances of recovery. Even though chances of recovery may seem slim, artificial respiration should be continued until normal breathing is resumed or, if a physician is not available, it should be continued for a minimum of two hours.
Any person overcome by hydrogen sulfide should be treated for shock-that is, kept warm while artificial respiration is being applied and kept quiet until he can be checked and released by a physician.
11 Hydrogen sulfide reacts with iron and steel to form iron sulfide. Iron sulfide reacts with air to form iron oxide. The conversion of iron sulfide to iron oxide creates heat sufficient to ignite flammable vapors.
Well Testing
Due to the extreme safety hazards involved in testing sour gas wells, care must be taken to not allow any unflared gas to escape to the atmosphere, especially in populated areas.
If possible, extensive testing should be delayed until the gas can be sent to a pipeline or gas plant. All gas produced during preliminary tests should be flared.
Testing equipment such as separators, pressure gages, and meters should be thoroughly tested before beginning a sour gas well test, especially if the equipment has previously been used in sour gas service.