The fatigue evaluation of LNG carriers (LNGCs) is a critical aspect of ensuring the long-term durability and safety of these specialized vessels, especially given the harsh maritime environments they operate in and the cryogenic nature of their cargo. Fatigue in LNGCs primarily arises from repeated stress cycles experienced by the ship’s structure due to varying load conditions, material behavior at low temperatures, and continuous exposure to harsh marine environments. A comprehensive fatigue evaluation involves analyzing the vessel’s structural components, particularly those made of high tensile steel, which, while strong and lightweight, must be carefully examined for signs of wear and stress over time. Additionally, the heating systems in LNGCs, which are essential for maintaining optimal temperature conditions within the cargo tanks and preventing the cargo from freezing the tank structure, also play a crucial role in the overall structural health of the ship. These systems must be designed to uniformly distribute heat while minimizing thermal stress, which could otherwise contribute to fatigue. Regular inspections and maintenance of both the structural components and heating systems are vital to mitigating fatigue-related failures, ensuring the vessel’s longevity and operational safety.
The fatigue evaluation of LNG carriers (LNGCs) is crucially influenced by factors such as sloshing dynamics and filling ratios of the cargo tanks, both of which can significantly impact the structural integrity of the vessel over time. Sloshing refers to the violent movement of LNG within partially filled tanks, a phenomenon that can exert considerable dynamic pressures on the tank walls and supporting structures during vessel motion. This effect is particularly pronounced in rough sea conditions or during sharp maneuvers, potentially leading to structural fatigue or even damage if not properly accounted for in the design and operational strategies. The filling ratio, or the proportion of the tank volume that is filled with liquid, directly affects sloshing intensity. As such, maintaining optimal filling ratios is a critical operational consideration to minimize sloshing impacts. Ship designers and operators use detailed computational models and physical tank tests to predict sloshing behaviors and define safe operational limits for filling ratios. These measures help mitigate the risk of fatigue-related damage, extending the service life of the vessel and ensuring safety in LNG transportation.
Heating of Cofferdams
In general, the temperatures of the hull structures of a LNGC are contained within acceptable limits of “cold“, even though the cargo is loaded at a temperature lower than minus 160 °C. This occurs in part due to the efficiency of the insulation and the “infinite” thermal capacity of seawater and air to continue to supply heat to the bottom, side shell and deck of the ship. Based on this, hull structures adjacent to cargo tanks are kept within temperature ranges, which do not impair the mechanical characteristics of the steel.
However, same situation does not occur in the transverse spaces between the cargo holds (cofferdams). These spaces, facing cold cargo holds on two sides with their large surfaces obtain very little benefit from the thermal capacity of sea and air. Therefore, while the actual temperature inside the longitudinal compartments adjacent to the cargo tanks range from few degrees above 0 °C to the coldest possible whether temperatures, the temperature inside the cofferdams would be in the range of minus 50 / minus 60 ºC. This temperature is not acceptable for the materials normally used for the hull construction.
To solve this problem, membrane LNGC’s are fitted with a heating system for heating in the cofferdams. This heating system is so important for the life of the ship, that the IGC Code, and The ABS and USCG Additional Rules and GuidesABS Rules, consider it as an “essential” equipment – which means that this equipment must remain operational in any condition.
This is why the cofferdams are actually fitted with two separate duplicated heating systems (some of the older vessels actually had three duplicate heating systems). Each of the two systems is designed in such a way, so as not to be affected by a failure of the other system. Each system has the capacity to keep the temperature of the cofferdams at an acceptable value – even in case of complete loss of the primary barrier of the cargo containment system.
Details of cofferdam heating systems are given in Module 14.
It is to be noted that independent tank LNG carriers do not need any heating system, as they do not have any structure in direct contact with cargo tank insulation systems, and the insulation and the air gap between the tank and the structure are sufficient to prevent excessive cooling of hull structures.
Structural Details and Fatigue
The Importance of Fatigue
Of equal importance to the correct selection of steel and material grades appropriate to the temperatures of LNGC’s structures (to minimize the risk of crack propagation) is the correct application of structural design details for a long service life. It is known that poor structural details shorten fatigue life. For this reason the quality of workmanship on a LNGC and the fatigue assessment is of critical importance and possibly more so than for other types of ships.
It has been often asked whether shipyards apply greater accuracy work standards for LNGC than for other ships. In general, the answer to this question is “no“. The normal working practices of a good shipyard are in general adequate for the construction of a LNGC – provided they are faithfully adhered to, and the geometry of the details are accurately selected taking into account allowable stress range and fatigue life.
Fatigue life of a structural detail may be roughly summarized as follows:
- Any discontinuity in a structure creates stress concentration, commonly referred to as a “stress riser” that can be several times greater locally than the nominal stress of the surrounding structure without any discontinuity. Therefore, poor details, or a poor workmanship can create very highly stressed spots in structures where low nominal stresses usually exist.
- If this structure is subject to alternate, a progressive reduction of the mechanical characteristics of the steel may occur.
- After a certain number of cycles (years of service) the tensile strength of the material becomes lower than the stress concentration and a crack starts.
The above concept is explained in a simplified way on Figure 1.
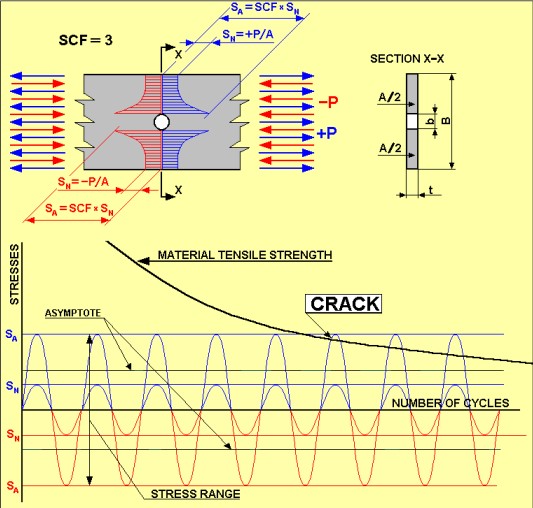
Lets consider a plate of width B, and thickness t, subject to an alternate tensile and compressive force P, in the direction of its length, so that the force continuously changes from +P to –P (in the drawing tensile forces and stresses have been indicated in blue and compressive forces and stresses are indicated in red). In the middle of the plate a hole of diameter b is drilled. It is obvious that in correspondence of the hole the maximum nominal stress will be:
Where: A is the “net” area of the hole:
However, the discontinuity creates a stress concentration peak close to the hole. If we assume a Stress Concentration Factor (SCF) of 3, being 3 a reasonable value for this type of discontinuity, the actual stress close to the hole will be:
that is three times greater than the nominal stress. This localized peak value reduces to the nominal stress through the width of the plate, as shown in Figure 1.
Variation of both the nominal and the actual peak stress. In the diagram is also indicated the same curve of decay of the mechanical characteristic of steel shown on Safehull Construction Monitoring of LNG“Standart LNG Construction Alignment” and it has been assumed that its asymptote lays somewhere between SN and SA. This would mean that if there was no concentration factor the SN stress level was so low as to assure an indefinite life length. However, being the value of SA above the asymptote, when the two curves crosses, the actual stress exceeds the material strength and a crack starts. The number of cycles (years), before the crossing of the two curves, is the life length of the detail. If this number exceeds the design period of life of the ship, it is acceptable, if not the detail is to be reconsidered either, for instance increasing the plate thickness to increase SN, and, so doing, shifting the two lines representing SN and SA towards lower values in the diagram, or improving the discontinuity detail, for instance improving the quality of steel cutting in way of the hole, so reducing SCF and lowering the SA line in the diagram and shifting to the right the crossing point of the two lines up to an acceptable detail life.
Finally, the life of a structural detail depends by a combination of Stress Concentration Factor, actual stress range in the detail and the actual decay path of the mechanical characteristics of the steel, which depends on the path of cyclical variation of the stress (in particular whether the stress are pulsating or
alternating).
A typical example is of fatigue damage found on the first 250 000 DWT tankers built in the 1970’s were cracks at the connection of the side longitudinals to the side webs in the area between the minimum and the maximum draft of the ship were quite common. The lowest longitudinals, even built with same detail and same workmanship and subject to greater nominal stresses, were not affected by these damages. The reason was the fact that the lower longitudinals, being always below the water level were subject to pulsating stresses between a minimum and a maximum without changing the direction of the stresses, while the upper longitudinals being below or above the sea level depending whether the ship was traveling at full load or in ballast were changing the direction of the stress at each voyage.
The Evaluation of Fatigue Life
Unfortunately, while the concept is simple, the reality is quite complicated and the actual life of a structural detail is quite difficult to predict. The reasons are that the actual variation of the stresses are not as simple as indicated in the diagram (a regular sinusoidal curve) but depends on a lot of variable factors such as weather and sea conditions, ship motion, cargo loading, etc., so that the actual decay curve of the mechanical characteristics of the material is far from easy to be determined; from another side considering the great number of different structural details and their complexity, it is not easy to determine the actual nominal stress distribution in the various parts of the detail (including welding) and the relative stress concentration factors. Therefore, also approximate predictions require a large quantity of statistical data and/or sophisticated analysis.
A detailed description on how analysis are performed is beyond the scope of this course, this being part of the engineering review of the structural drawings. To simplify, it is possible to state that there are two approaches.
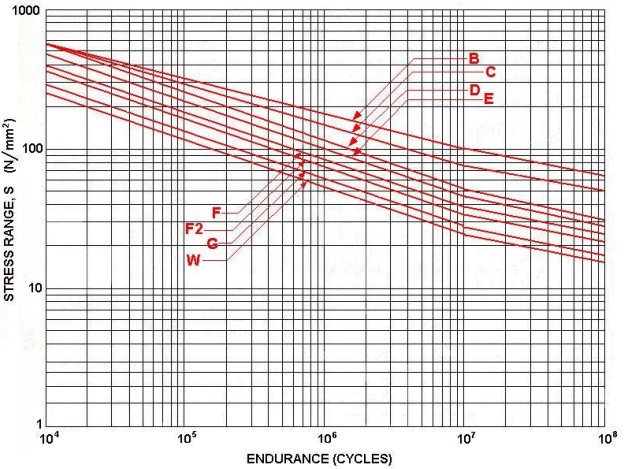
The simplest and most accurate approach makes use of the SN curves shown in the Rules. These curves are straight lines in a double logarithmic diagram. Each of the line is relative to a certain class of structural details (being a class of details characterized by similar stress concentration factors) and indicates a relation between the allowable stress ranges and the number of cycles (life) of the ship. They are based on experimental and statistic data and on a standard life of 20 years. Correction factors are calculated using ABS Rules for longer lives.
Figure 2, taken from the Rules, shows typical SN curves.
Figures 3 and 4 illustrate some structural detail examples, taken from the Rules.
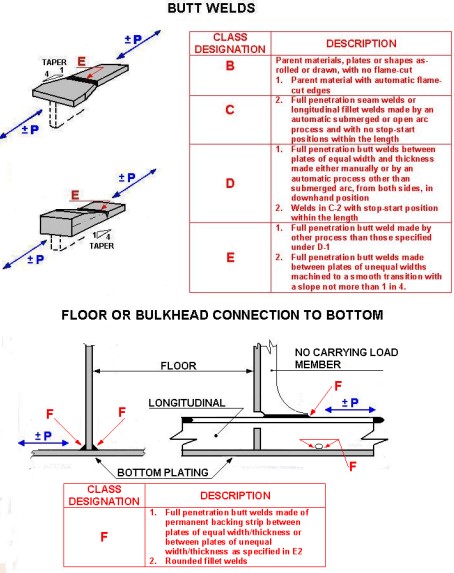
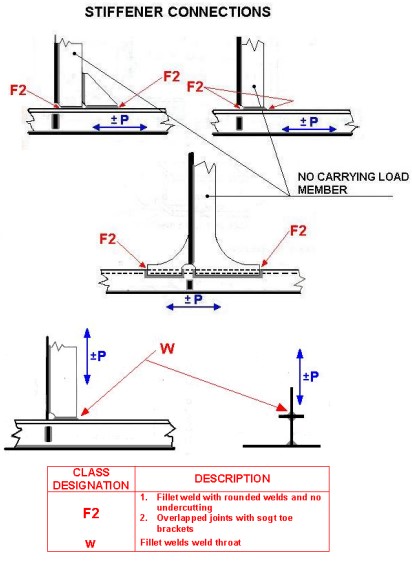
For each of this detail there is the indication the detail class designation letter to be used in association with the S-N curves in Figure 2.
The second approach is a thorough analysis of loading cycles the ship will most probably encounter during her design life cycle. Anticipated routes, known sea conditions and vessel characteristics, including calculation of stress concentration factors through fine mesh refined Finite Element Analysis are considered.
Sloshing and Filling Ratio
The volume of the current LNGC cargo tanks continues to increase, with design exceeding 40 000 m3. Additionally, the insulation design renders the tank inner surface relatively smooth except for the membrane small corrugation and weld seams. The pump tower remains the only structure within this space. Note, SPB tanks differ as they are internally stiffened.
In case where a tank is not completely filled, a free surface area of liquid could extend full width and length (40 m · 40 m = 1 600 m2 ). It is easy to imagine the kind of waves that could be generated due to the ship motion, with such a large free surface area. These waves can hit the upper portion of the boundary of the tanks and the pump tower structures, with such intensity as to impair the strength of these structures. In order to minimize this free surface effect (which is more intense on the membrane type gas carriers) the first step taken was to design a trunk in the upper part of the tanks (the first membrane type ships had flat upper deck). The trunk effectively reduces the free surface area of liquid in the upper part of the tank and effectively reduces, or almost eliminates the sloshing when the tank is full, or almost full.
Accordingly, as the filling level of the tank is lowered, the free surface area increases and the sloshing becomes more and more severe. For this reason, especially in the membrane ships, there are severe operative limitations on the quantity of cargo that must be loaded in the tanks. These filling limits are given as a percentage of the allowable cargo depth and are established for each project on the basis of the sloshing calculation. This percentage is indicated as the filling ratio. Generally, the minimum allowable value of filling ratio of modern membrane LNGC’s are around 80 %. However, there is increased demand from the owners to lower this value as much as possible, allowing greater trading flexibility by partial loadings and discharges in different ports. This can be obtained by adequately strengthening the membrane insulation in the upper part of the ship, the pump tower supports and anchoring structures. Having taken these precautions, values of filling ratio of about 70 % can be reached and have been approved.
Finally, a LNGC cargo tank is almost never empty during the ship service. After discharge a certain amount of LNG remains in the tank. This LNG is used to produce the boil-off necessary as fuel for the voyages in ballast, as well as to maintain the tank temperature within cryogenic range. In order not to create sloshing problems, this quantity of LNG is also to be limited to filing ratio not exceeding values around 10 % of the length of the tank.
For the aforementioned reasons, in general membrane types LNGC’s have loading limitations.
More and more Owners are now requesting to reduce or to eliminate the filling limit restrictions, in order to maximize the vessels flexibility on the spot trading market. Presently more advanced analysis of sloshing and of the strength of the cargo containment insulation are being carried out by designers and Classification Societies.