LNG trade is poised to be an important catalyst for economic growth in many countries. Natural gas and LNG development can enable economic development and stimulate further investment in national infrastructure.
Global gas demand has increased over the past decade and is expected to grow rapidly into the future with increased interest by governments in clean energy to fuel economic growth. Historically, most natural gas has been sold locally or by gas pipeline to adjacent markets. Liquefaction of natural gas into LNG allows the gas to be transported from producing regions to distant countries. There are vast known global natural gas resources that are considered ‘stranded’ because companies are not able to economically produce and deliver resources to markets.
LNG History
The U.S. has been a leader in the LNG industry since its inception. In 1959, the world’s first LNG carrier, the Methane Pioneer, set sail from Lake Charles, Louisiana with a cargo of LNG destined for Canvey Island, UK. This first ever U.S.-UK shipment of LNG demonstrated that large quantities of LNG could be transported safely across the ocean, opening the door for what would become the global LNG industry.
As the LNG markets evolved over the decades, they tended to develop in regional isolation from each other, primarily due to the high cost of natural gas transportation. Historically, two distinct LNG trade regions developed – the Asia-Pacific region, and the Atlantic Basin region which included North America, South America and most of Europe. Until Qatar began to export LNG to both regions in the mid-1990s, the two regions were largely separate, with unique suppliers, pricing arrangements, project structures and terms. In recent years, the increase in inter-regional trade, as well as the development of a more active spot market, has tended to blur the distinction between the two main regions.
There are three main global gas markets:
- the Asia-Pacific region, the European region;
- and the North American/Atlantic Basin region which includes North America, South America, and Latin America.
The Asia-Pacific region has historically been the largest market for LNG. Japan is the world’s largest LNG importer, followed by South Korea and Taiwan. China and India have recently emerged as LNG importers and could become more significant buyers of LNG over time.
The growth of LNG in Europe has been more gradual than that in the Asia-Pacific, primarily because LNG has had to compete with pipeline gas, both domestically produced and imported from Russia. The traditional European importing countries include the:
- UK,
- France,
- Spain,
- Italy,
- Belgium,
- Turkey,
- Greece and Portugal.
A growing number of European countries have constructed, or are planning, LNGG import terminals, including:
- Poland,
- Lithuania,
- and Croatia.
In North America, the United States, Canada and Mexico have strong pipeline connections and abundant supplies of natural gas. Historically, this region had been able to supply virtually all of its natural gas requirements from within the region. During the supply-constrained 1970s, however, the U.S. began importing LNG from Algeria and four LNG import terminals were built between 1971 and 1980. The 1980s was a period of oversupply and U.S. LNG import terminals were either mothballed or underutilized.
In the late 1990s, the United States was forecasting a shortage of natural gas, which led to the reactivation of the mothballed terminals and the building of additional import terminals, including Cheniere Energy’s Sabine Pass. But by 2010, it became apparent that the U.S. would be a major shale gas producer, making LNG imports unnecessary. The cargoes that were to be sold in the U.S. were then available to be sold on global markets. Many of the existing U.S. import terminals are now being repurposed as LNG liquefaction and export terminals.
In February 2016, Cheniere Energy’s Train 1 came online, thus heralding a new wave of LNG supply. As of early October 2016, DOE had issued final authorizations to export 15,22 billion cubic feet per day (Bcf/d) of U.S. Lower-48 States domestically sourced natural gas to non-FTA countries.
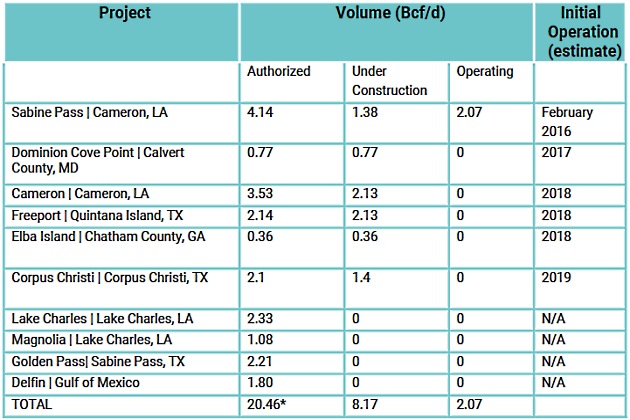
The following table shows the U.S. large-scale projects that have received regulatory approvals and are under construction or operating as of August 2017.

Supply and Demand Balance
In 2016 global LNG trade accounted for 258 million metric tonnes per annum (MTPA). Also in 2016, there were 34 countries importing LNG and 19 countries that export LNG. In terms of the global supply balance for LNG, the key features of the last few years have been:
- the emergence of the U.S. as a major LNG exporter, potentially adding more than 60 MTPA to global supplies;
- the completion of a number of major LNG export facilities in Australia, which will soon achieve a nameplate capacity of about 85 MTPA;
- slower than expected demand increase from Asian markets;
- and new gas discoveries, particularly large discoveries in frontier regions.
The confluence of these four factors, which continue to evolve, has created a short-to-medium term situation of material LNG oversupply. Oversupply is depressing spot and medium term prices for gas that has not already been contracted. In addition, a major portion of the LNG market has long-term contracts indexed to oil prices and oil prices have also dropped significantly.
All these factors have created a difficult environment to develop greenfield The International Trade LNG and LPGLNG export facilities but has increased demand and markets for LNG.
For excess LNG that has not been contracted on a long term or destination-specific basis, prices in most key consuming markets, such as Europe or Asia, have fallen from a high of $10-$15 per million British thermal units (MMBtu) to below $5/MMBtu at times for certain destinations, and while this remains above the marginal cost of production for some projects, it typically falls well short of the whole-life costing of an LNG project, once amortization of capital and loan repayments are taken into account.
Read also: Environmental management of ships during transportation of LNG/LPG gases
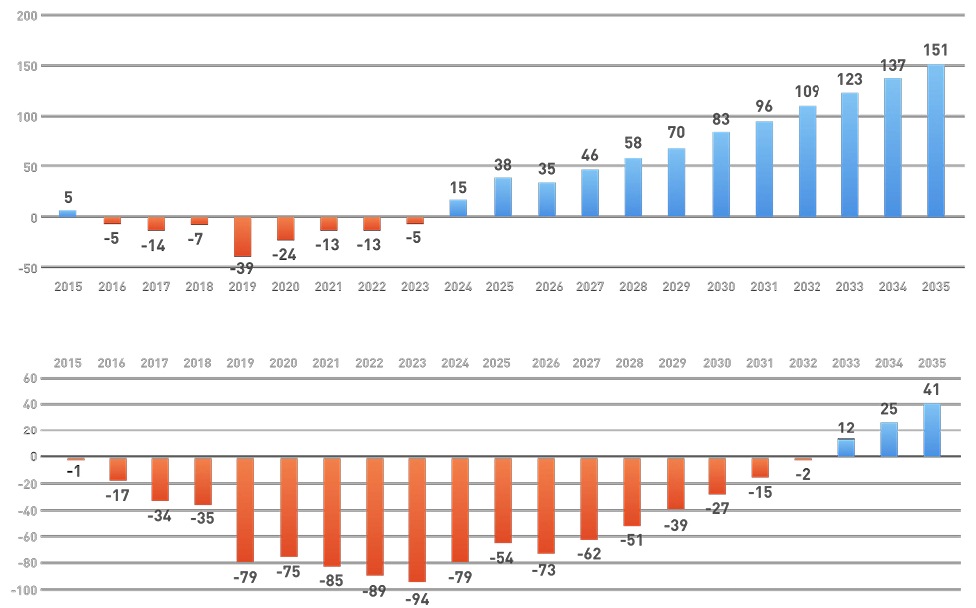
For a gas/LNG project developer/investor or host government, one of the main challenges is to determine when a rebalancing of gas markets might take place, as this would have implications on LNG price projections and a project’s economic viability. Opinions vary on when, and in what manner LNG global markets will rebalance. Even if a number of the existing LNG liquefaction terminals, either in production or under construction, take steps to re-phase their output or delay completion to realign with market demand, it appears likely that the market will continue to be oversupplied at least into the early 2020s. If development plans proceed, based on the completion dates and FID decisions currently quoted in investor’s and press materials, the oversupply could continue through the next decade. While commercial and financial pressures suggest that some kind of shorter term realignment will result, it is not yet apparent how this realignment will happen, and what the implications are for gas and LNG projects.

Source: Gaffney, Cline & Associates
The charts above indicate two possible realignment scenarios, based on a prompt (short term) market realignment, or a longer term oversupply. The red bars represent the amount of global LNG oversupply in MTPA.
Global Shipping Considerations
The LNG shipping market is also experiencing some major changes that resulted from overbuilding LNG carrier capacity. Some shippers have also suffered due to technology changes that substantially improved the fuel efficiency and reduced the operating costs of more modern ships, making older ships less competitive. LNG carriers trended towards a 125 000 cubic meter standard in the 1980s.
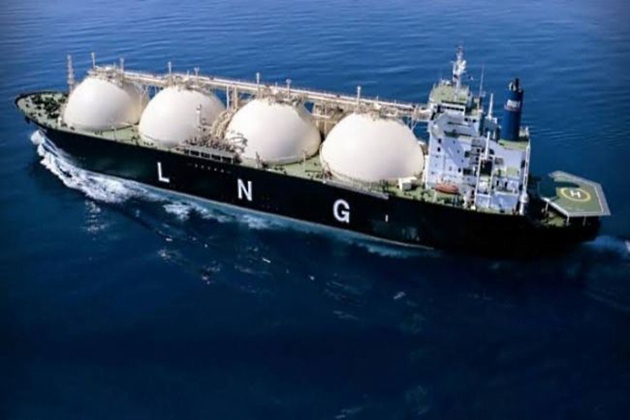
Later, economies of scale and newer technology gave rise to increased ship sizes of 160 000 to 180 000 cubic meters, with the newest generation of Qatari ships being 216 000 to 266 000 cubic meters. The largest ships can carry around 6 billion cubic feet of gas, equivalent to one day’s average consumption for the entire UK, or around 10 % of U.S. daily gas production.
A new build LNG carrier might be expected to cost around $200 million to $250 million, which would typically require a charter rate of about $80 000-$100 000 per day to support capital and operating costs. Spot charter rates in the industry are currently only at around a third or a quarter of these levels, so ships without long-term charter arrangements are struggling to find economically viable short-term charters. Also, LNG sellers are passing on cost/revenue pressures created by the gas oversupply to shippers. For example, charterers are now typically paying only for the loaded leg of a journey, perhaps augmented by a small fee or bonus for the return ballast (empty) leg of the trip.
The depressed shipping market does have some spin-offs for the gas/LNG development industry. Relatively new LNG carriers (even post 2000), which have a limited prospect of finding viable future long-term charters, are becoming available for conversion to other types of floating facility.
Conversion to a floating storage and regasification unit (FSRU) would be the easiest and quickest conversion to carry out. More recently and less frequently, ships have become a candidate for conversion to a floating liquefaction (FLNG) facility. FLNG conversion usually requires more structural alteration of the hull, given the significant additional tonnage of equipment on the topside, but the advantages of an existing hull/cryogenic storage facility can represent a significant cost saving.
A converted LNG carrier is to be used for the FLNG facility proposed for Cameroon, as well as the planned Fortuna project in Equatorial Guinea. Benefits claimed in both examples include shorter time to market and lower cost.

Source: Freeimages.com
Countries may want to capitalize on short-to-medium term low-cost LNG to provide an initial gas stream for power projects. Governments could promote local market development using converted LNG carriers as floating storage and import terminals. Later, as domestic markets develop and natural gas development projects are implemented, countries could replace or supplement LNG imports with indigenously-produced gas.
Possible options include a variety of configurations with combinations of Ship to Shore Access Guidelines for Gas Terminal and Vessel OperatorsLNG storage, regasification, and/or ship-mounted power generation. Some proposed configurations even include water desalination in a coordinated package. In light of these shipping market dynamics, engineering solutions for gas and LNG projects include a much wider spectrum of options than in the past.

