Discover the dynamic world of international trade in LNG (Liquefied natural gas) and LPG (Liquefied petroleum gas). From the bustling ports to the intricate logistics networks, explore the global exchange of these vital energy resources.
Stay informed on market trends, trade routes, and industry insights to navigate this ever-evolving landscape. Whether you’re a supplier, trader, or investor, unlock opportunities and stay ahead in the LNG and LPG trade market.
Liquefied petroleum and petrochemical gases
The fleet LPG
The LPG fleet started with pressurized ships of less than 5 000 m3 capacity. The first semi-pressurized ships were delivered at the end of the 1950’s and sizes in this category did not go much above 10 000 m3 before the 1970’s. The first fully-refrigerated ships appeared in the 1960’s but it was in the 1970’s that the first 50 000 m3 vessels were delivered.
Fifty-two gas tankers were either converted or newly-built prior to 1960 and another 233 between 1961 and 1968. In 1970, the fleet included more than 220 ships under 2 000 m3, approximately 80 vessels between 2 000 and 10 000 m3 and 50 vessels of more than 10 000 m3. At the end of 1998, the situation had changed substantially and the fleet comprised 444 pressurized vessels of less than 10 000 m3, 276 semi-pressurized vessels and 186 fully refrigerated vessels.
In 1973, pressurized vessels accounted for 63 % of the total number of ships and 9,5 % of the total capacity and refrigerated vessels made up 4,5 % of the total number but already almost 20 % of the total capacity. At the end of 1997, pressurized vessels accounted for 49 % of the total number of ships but only 7,3 % of the total capacity. By then, refrigerated vessels only accounted for 20,5 % of the total number of ships but 78,6 % of the total capacity.
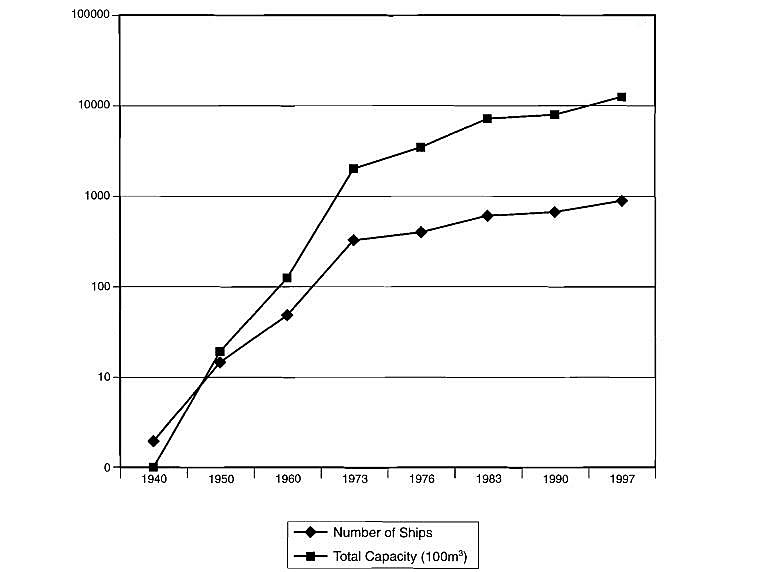
Table 1 show the evolution of the fleet over the years.
| Table 1. Growth of World LPG Fleet to End 1997 | ||
|---|---|---|
| Number of Ships | Total Capacity (1 000 m3) | |
| 1940 | 2 | 1 |
| 1950 | 15 | 20 |
| 1960 | 50 | 130 |
| 1973 | 350 | 2 340 |
| 1976 | 414 | 3 606 |
| 1983 | 630 | 7 200 |
| 1990 | 680 | 8 100 |
| 1997 | 906 | 12 485 |
Table 2 shows the situation at the end of 1997.
| Table 2. Type, Number and Capacity of LPG Tanker Fleet | ||||||
|---|---|---|---|---|---|---|
| LPG WORLD FLEET | ||||||
| Type, Number and Capacity of LPG Carrier Fleet (at end 1997) | ||||||
| 0-4,999 | 5,000-19,999 | 20,000-59,999 | 60,000-101,000 | Total | ||
| Pressurized | Number of Ships | 418 | 26 | 0 | 0 | 444 |
| Total Capacity (m3) | 752,875 | 158,626 | 0 | 0 | 911,501 | |
| Semi-pressurized | Number of Ships | 133 | 136 | 7 | 0 | 276 |
| Total Capacity (m3) | 389,474 | 1,217,986 | 154,452 | 0 | 1,761,912 | |
| Refrigerated | Number of Ships | 14 | 13 | 69 | 90 | 186 |
| Total Capacity (m3) | 25,792 | 197,380 | 2,655,910 | 6,937,936 | 9,617,016 | |
| Total | Number of Ships | 565 | 175 | 76 | 90 | 906 |
| Total Capacity (m3) | 1,168,141 | 1,573,992 | 2,810,362 | 6,937,936 | 12,490,431 | |
Table 3 shows the number of ships on order at the end of 1997.
| Table 3. Type, Number and Capacity of LPG Tankers on Order. | ||||||
|---|---|---|---|---|---|---|
| LPG WORLD FLEET | ||||||
| Type, Number and Capacity of LPG Carrier on Order (at end 1997) | ||||||
| 0-4,999 | 5,000-19,999 | 20,000-59,999 | 60,000-101,000 | Total | ||
| Pressurized | Number of Ships | 16 | 0 | 0 | 0 | 16 |
| Total Capacity (m3) | 48,218 | 0 | 0 | 0 | 48,218 | |
| Semi-pressurized | Number of Ships | 6 | 21 | 7 | 0 | 34 |
| Total Capacity (m3) | 26,738 | 281,280 | 216,900 | 0 | 5,249,18 | |
| Refrigerated | Number of Ships | 0 | 0 | 2 | 4 | 6 |
| Total Capacity (m3) | 0 | 0 | 99,760 | 305,000 | 404,760 | |
| Total | Number of Ships | 22 | 21 | 9 | 4 | 56 |
| Total Capacity (m3) | 74,956 | 281,280 | 316,660 | 305,000 | 977,896 | |
Normal LPG ships are also used for the transport of ammonia and other petrochemical gases, such as propylene, butadiene and vinyl chloride monomer. Special cargo containment systems, resistant to very low temperatures, are required for the transport of ethylene, but the ships used for this trade are, except for this specific point, of a basic design similar to other LPG ships. All different types of LPG tankers are able to carry ammonia or propylene, butadiene or VCM and most of the existing ships have done so at one time or another. The very cumbersome tank cleaning operation required between a cargo of ammonia and the next cargo of LPG or other chemical gas does not make ammonia the ship operators favourite product. However, it is better to carry ammonia than to have a ship unemployed. Some ships are dedicated to ammonia and do not carry any other cargo for long periods. LPG tankers tend to be designed for flexible operation, to have the possibility to carry a maximum number of different cargoes under different conditions of pressure and temperature.
Despite the uncertainty of the trade, the fleet of liquefied Piping System of pressure vessels on gas tankersgas tankers is following a regular progression, with the number of ships increasing by 4,9 % per year during the period 1990 to 1997.
The range of size of the different types of ships has not changed much over the past twenty years and seems set for the foreseeable future.
Most liquefied gas tankers continue trading well beyond their 20th year and some even longer. This does not allow for a large number of new buildings. However shipyards around the world are keen to tender for liquefied gas carriers. In addition to those countries and regions traditionally specializing in building such vessels, Europe, Japan and more recently South Korea, the shipyards of countries new to the industry, such as China and India, are starting to acquire a reputation for the construction of these specialized tankers.
If the example of previous years is anything to go by, as soon as a balance is reached between the number of ships available and the number of ships in demand, owners start a flurry of orders for new buildings, with the result that, very quickly, the number of ships available is again in excess of demand. It seems, despite the prospects of an increase in the international sea-borne trade of LPG in the years to come, that this is happening again and the new century might very well start with an excess of available tonnage.
The trade LPG
a) General – Liquefied gas carriers transport three main cargoes: liquefied petroleum gas (LPG), ammonia and petrochemical gases, each group having its own shipping needs.
The LPG market features large cargo exports from the Arabian Gulf and an active small cargo trade in the North Sea. Ammonia is transported mainly from the Black Sea to the Mediterranean, and from the Arabian Gulf. The trade in petrochemical gases is more varied. At the time of writing, butadiene is moving from North-West Europe and the Mediterranean to the US Gulf, ethylene from the Mediterranean to India, propylene from South America and the US Gulf to North-West Europe and VCM from Japan, Venezuela and the US Gulf to the Far East.
There are more vessels employed on either annual contract of affreightment or time charter than on the spot market.
The demand for vessels is determined by the sea-borne trade in the three groups of cargoes mentioned above and by the distance over which these cargoes are transported.
One of the more interesting characteristics of the liquefied gas trade has always been its volatility. This certainly presents a constant challenge to ship-owners, brokers and traders. Despite this, the overall long-term trend, since the beginning of the trade, has been growth. But the short-term has, in general, been an alternation of short, very healthy bursts with gloom in between.
b) Liquefied Petroleum Gas (LPG) – In 1996, the world production of LPG was 165,5 million tonnes and world consumption was 166 million tonnes. This was almost 23 % higher than in 1990 and over the last 5 years the increase has been 4,4 % per year.
The United States is the largest producer in the world with 35,7 million tonnes and also the largest consumer with 46,5 million tonnes.
Japan is second only to the USA in terms of national consumption. Consumption in 1997 stood at 20,5 million tonnes. Contrary to North America and Western Europe, Japan has to import the bulk of its LPG requirements. This makes Japan the largest importer of LPG in the world, with 15,5 million tonnes of sea-borne delivery in 1997. Imports grew at an average rate of just 0,8 % per annum from 1990-1997. Imports to Japan are mainly from the Middle East, Indonesia, Australia and now Malaysia.
South Korea’s consumption of LPG has increased by an average of 11,4 % per year over the past seven years and in 1997 it reached 7 million tonnes. However, the largest part of its requirement must also be imported and South Korea is the second largest importer of LPG, with 4,5 million tonnes of sea-borne trade in 1997. More than 95 % of the LPG imported by South Korea comes from the Middle East.
The demand for LPG in China has increased by almost 23 % per year since 1990 and, despite the impressive growth in domestic production, China is the third largest importer of LPG, with a sea-borne trade reaching 3,5 million tonnes before settling at 2,3 million tonnes in 1997. A number of new receiving terminals are already in service or will be commissioned before the end of 2 000. China imports LPG mostly from the Middle East and South-East Asia.
Brazil consumes 6,1 million tonnes of LPG per year and demand has grown by 5 % per annum over the last five years. Brazil had to import up to 2,5 million tonnes of LPG per year but that was reduced to 2,1 million tonnes in 1997 due to an increase in domestic production. This makes Brazil the fourth largest importer of LPG. Most of the imports come from the Middle East but the amount coming from South America, Africa and the United States is steadily increasing. The quantity of sea-borne trade might be reduced in future, due to the increased availability of products in Argentina, which can be exported overland to Brazil.
LPG consumption in Western Europe was close to 29 million tonnes in 1997 and has increased by 1,6 % per annum since 1990. Production, however, has increased much faster, by 4,6 % per annum, and stands at 26,4 million tonnes in 1997. European countries imported 13,5 million tonnes of LPG in 1997, of which 9 million tonnes were from EU countries. During the same period, 11,5 million tonnes of LPG were exported from Europe. Much of these imports and exports were intra-regional trade, transported overland. Sea-borne trade came mainly from North Africa and the Middle East and reached a total of almost 4 million tonnes. Turkey alone absorbed close to 1,6 million tonnes.
The United States produced 36 million tonnes and consumed 46,5 million tonnes of LPG in 1997 and both these figures are the largest in the world. However USA is relatively unimportant in terms of international sea-borne trade as most exchanges are intra-regional and overland. The amount of LPG imported by sea was 1,4 million tonnes in 1997, coming from Africa, the Middle East, Europe and Latin America.
Other Far Eastern countries, such as Taiwan and India, saw their LPG imports increase substantially over the last 7 years, particularly India. In 1997, the amount of sea-borne trade to Taiwan was 0,7 million tonnes, coming mainly from the Middle East, whilst India received 1,1 million tonnes coming from the Middle East and other South East Asia producers, such as Indonesia and Malaysia.
The main LPG exporting areas are:
- the Middle Eastern countries: 26 million tonnes;
- Western Europe: 12 million tonnes, mainly transported overland;
- North America: 6 million tonnes, also mainly transported overland;
- Asia: 4,6 million tonnes;
- Africa: 4,5 million tonnes;
- Latin America: 2,7 million tonnes and Australia: 1,2 million tonnes.
Table 4 shows the main international sea-borne trade in LPG in 1997. LPG generates 80 % of Strategies and Best Practices of Ballast Voyage for Liquefied Gas Carriersliquefied gas carrier demand with a total international sea-borne trade of 41 million tonnes in 1997.
| Table 4. LPG – Main Seaborne Trade – 1997 | |||||||
|---|---|---|---|---|---|---|---|
| LPG – Main Sea-borne Trade – 1997 (million tonnes) | |||||||
| Imports | Exports | ||||||
| Middle East | Africa | North Sea | S. E. C. America | Far East | Others | Total | |
| Japan | 12,3 | 0,0 | 0,0 | 0,0 | 3,2 | 0,0 | 15,5 |
| OECDI/Europe | 1,0 | 2,6 | 0,9 | 0,0 | 0,0 | 0,0 | 4,5 |
| USA | 0,7 | 0,3 | 0,0 | 0,4 | 0,0 | 0,0 | 1,4 |
| S. America | 2,5 | 0,2 | 0,0 | 0,0 | 0,0 | 0,4 | 3,1 |
| Far East | 8,3 | 0,0 | 0,0 | 0,0 | 0,6 | 0,1 | 9,0 |
| Others | 1,2 | 1,4 | 0,0 | 2,3 | 0,8 | 1,8 | 7,5 |
| Total | 26,0 | 4,5 | 0,9 | 2,7 | 4,6 | 2,3 | 41,0 |
LPG world-wide production is expected to reach 195 million tonnes per annum by the 1 year 2 000 if the long-term average growth of 4,1 % per year is sustained. Thereafter the growth rate might drop to 3,5 % per annum.
International trade in LPG should rise to roughly 65 million tonnes per annum in 2000 and 80 million tonnes per annum in 2005 (Drewry).
c) Ammonia – World-wide ammonia production is currently estimated at 120 million tonnes per annum and has barely increased since 1990. Asia is the largest producer with a total output approaching 50 million tonnes of which 26 million tonnes come from China. China has increased its output by 10 million tonnes since 1990. North America has the second largest production with an output of 20 million tonnes which has increased by two million tonnes since 1990. The output from the ex-Soviet Union countries slumped from 22 million tonnes in 1990 to 14 million tonnes in 1994 but has now recovered to 16 million tonnes. Western European production has been reduced from 15 million tonnes in 1990 to 13 million tonnes at present.
Other producing regions are:
- Eastern Europe;
- Latin America;
- the Middle East;
- Africa and Australasia.
The main exporters are the former Russia, followed by Latin America and the Middle East. Many countries are involved in both the import and export of ammonia and this makes it difficult to differentiate between the actual and apparent level of trade. The main importers of ammonia are, again, the former:
- Russia and Eastern Europe;
- Latin America;
- Western Europe;
- the Middle East;
- North America followed by Asia;
- Africa and Australasia.
Table 5 shows the main movements of ammonia by sea in 1997. Ammonia generated 11 % of the liquefied gas carrier demand, with a total international sea-borne trade of almost 12 million tonnes in 1997.
| Table 5. Ammonia – Main Seaborne Trade – 1997 | |||||||
|---|---|---|---|---|---|---|---|
| Ammonia – Main Sea-borne Trade – 1997 (million tonnes) | |||||||
| Imports | Exports | ||||||
| W. Europe | South America | North America | Middle East | E. Europe FSU | Others | Total | |
| Australasia | 0,00 | 0,00 | 0,00 | 0,03 | 0,00 | 0,06 | 0,09 |
| Middle East | 0,00 | 0,00 | 0,00 | 0,18 | 0,00 | 0,00 | 0,18 |
| South America | 0,11 | 0,17 | 0,04 | 0,03 | 0,00 | 0,00 | 0,35 |
| Africa | 0,55 | 0,04 | 0,00 | 0,00 | 0,46 | 0,12 | 1,17 |
| Asia | 0,30 | 0,00 | 0,40 | 0,88 | 0,00 | 0,36 | 1,94 |
| North America | 0,14 | 1,86 | 1,15 | 0,04 | 0,95 | 0,20 | 4,34 |
| Europe | 0,54 | 0,10 | 0,00 | 0,03 | 3,05 | 0,15 | 3,87 |
| Total | 1,64 | 2,17 | 1,59 | 1,19 | 4,46 | 0,89 | 11,93 |
The forecast is for a slow increase of international trade in ammonia reaching about 13,5 million tonnes in 2002.
d) Petrochemical Gases – The international sea-borne trade in the main petrochemical gases, accounts for about 9 % of the LPG carrier availability and amounted to a total of 5,86 million tonnes in 1995. Table 6 shows the main international sea-borne movement of petrochemical gases in 1995. These figures include ethylene, propylene, butadiene and VCM.
| Table 6. Petrochemical Gases – Main Seaborne Trade – 1995 | |||||||||
|---|---|---|---|---|---|---|---|---|---|
| Petrochemical Gases – Main Sea-borne Trade – 1995 (million tonnes) | |||||||||
| Imports | Exports | ||||||||
| Europe | North America | Japan | Africa | Middle East | South America | Far East | Others | Total | |
| Others | 0,06 | 0,05 | 0,01 | 0,00 | 0,01 | 0,01 | 0,00 | 0,00 | 0,14 |
| N. America | 0,30 | 0,00 | 0,01 | 0,00 | 0,07 | 0,03 | 0,03 | 0,00 | 0,44 |
| S. America | 0,06 | 0,27 | 0,00 | 0,00 | 0,00 | 0,00 | 0,00 | 0,00 | 0,33 |
| Far East | 0,24 | 0,49 | 0,75 | 0,05 | 0,45 | 0,13 | 0,70 | 0,05 | 2,86 |
| Europe | 1,70 | 0,03 | 0,02 | 0,14 | 0,03 | 0,01 | 0,02 | 0,14 | 2,09 |
| Total | 2,36 | 0,84 | 0,79 | 0,19 | 0,56 | 0,18 | 0,75 | 0,19 | 5,86 |
i) Ethylene – The total world production of ethylene in 1996 was 75,77 million tonnes, which was 87 % of the total world production capacity. Ethylene production grew by an average of 5 % between 1990 and 1996. The main producing countries are:
- North America: 25,2 million tonnes;
- Western Europe: 17,78 million tonnes;
- almost equaled by the Far East: 17,65 million tonnes;
- the Middle East and Africa: 5,64 million tomes;
- Eastern Europe and the former Soviet Union: 4,99 million tonnes and Latin America: 4,52 million tonnes.
The main exporters are:
- Western Europe: 2,3 million tonnes;
- South Korea: 0,3 million tonnes;
- Japan: 0,2 million tonnes and the USA.
The main importers are:
- Western Europe: 1,948 million tonnes;
- India: 0,327 million tonnes;
- Taiwan: 0,186 million tonnes, then Thailand, Indonesia, Japan, South Korea and the USA.
Total world production of ethylene is forecast to increase by 4,8 % per year up to 95 million tonnes by 2002, but due to the development of domestic production in the main user countries, the prospects for growth in the international sea-borne trade in the coming years are not good.
ii) Propylene – The total world production of propylene has increased from 20 million tonnes in 1990 to almost 42 million tonnes in 1996, due to strong demand for polypropylene. Propylene trade is influenced by the fact that there is excess production in the:
- USA;
- Japan;
- South Korea;
- Italy and Libya and import demand in, for example, South East Asia.
The main exporting countries are:
- Western Europe: 2,176 million tonnes;
- USA: 0,286 million tonnes;
- South Korea: 0,235 million tonnes and Japan: 0,219 million tonnes.
The main importing countries are:
- Western Europe: 1,865 million tonnes;
- Taiwan: 0,261 million tonnes;
- Mexico: 0,193 million tonnes;
- South Korea: 0,115 million tonnes, and Thailand, USA, China and Japan.
Propylene demand is forecast to grow by 5,6 % per year up to 50 million tonnes in 2000. Serious propylene deficits are forecast for Europe and Asia which will be met by the USA and the Middle East. Contrary to ethylene, the prospects for long haul propylene trade in the near future are likely to improve.
iii) Butadiene – World production of butadiene stands at 6,7 million tonnes in 1996 and it is expected to increase by 4,2 % per annum in the coming years to reach 8,5 million tonnes in 2001.
The main countries exporting butadiene are:
- Europe: 0,86 million tonnes;
- South Korea: 0,190 million tonnes;
- and Japan: 0,075 million tonnes.
The main countries importing butadiene are:
- Europe: 0,493 million tonnes;
- the USA: 0,361 million tonnes;
- Taiwan: 0,195 million tonnes;
- and China: 0,044 million tonnes.
The total volume of international sea-borne trade in 1996 was approximately 0,8 million tonnes per annum.
iv) Vinyl Chloride Monomer (VCM) – World production of VCM was 23,3 million tonnes in 1996 and is expected to increase to 27,3 million tonnes in 2000. The USA has long been the world’s largest VCM exporter, mainly to the Far East and South East Asia. However, in recent years, Japan has gradually replaced the USA as supplier to the Asia-Pacific region. Taiwan used to be the largest importer of VCM, but the rapid development of its own domestic production has reduced its imports from 0,27 million tonnes in 1994 to less than 0,13 million tonnes in 1996. South Korea is now the largest importer of VCM, taking more than 0,3 million tonnes in 1996.
In 1996, the main VCM exporting countries were the:
- USA: 0,982 million tonnes;
- Japan: 0,315 million tonnes;
- and Europe: 0,293 million tonnes.
The main importing countries were:
- Europe: 0,869 million tonnes;
- South Korea: 0,3 million tonnes;
- the rest of the Asia-Pacific region: 0,397 million tonnes;
- and Latin America: 0,430 million tonnes.
Most of the increases in VCM production are forecast to take place in South East Asia and North America. This will considerably reduce the need for imports in South East Asia and the prospects for growth in international sea-borne trade of VCM in the coming years look poor, especially for long-haul trades.
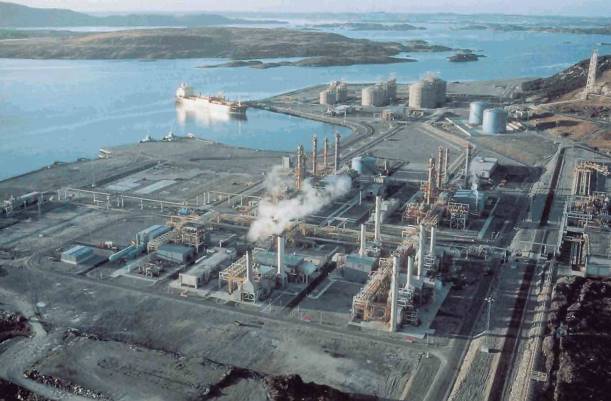
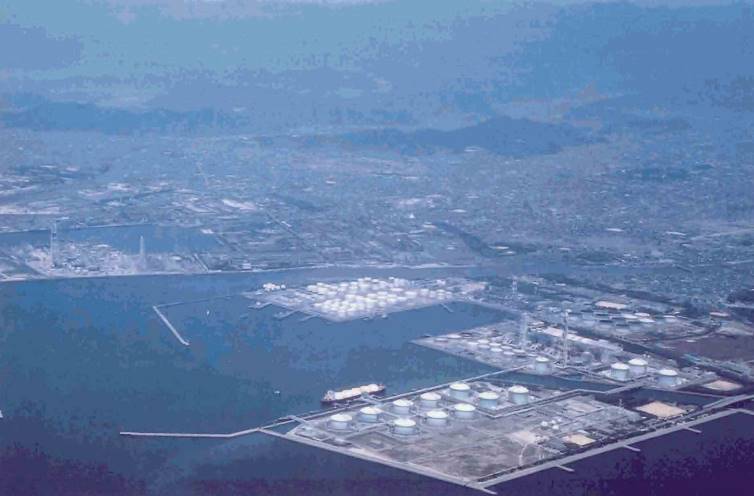
The terminals LPG
There are almost 100 exporting terminals and 180 importing terminals handling LPG and petrochemical gases around the world. This number does not exactly reflect the total number of LPG terminals, as some are dual purpose, exporting and importing at the same time. They vary greatly in the volume of storage available and in the size of ship which can be accommodated.
In the same way as the ships, terminals can easily be designed to handle all types of liquefied gases. Different types and levels of safety equipment would be installed depending on the products handled. The product to be handled by any given terminal will obviously depend on what is available in that particular area. Some large and very sophisticated terminals in Western Europe can load or discharge many different products at one time. Some other terminals, although equipped with large storage tanks, are only designed to handle the one type of product available in their geographic area.
Many terminals are only equipped with pressurized tanks and can only receive small, pressurized ships. This is why there are so many of these ships, mostly involved in domestic or regional trade. The large, fully-refrigerated terminals are to be found mainly in:
- Japan;
- Korea;
- Taiwan;
- United States;
- Europe and Australasia for importing terminals and the Far East,;
- the Middle East;
- North Africa;
- Australasia;
- Europe and United States for exporting terminals.
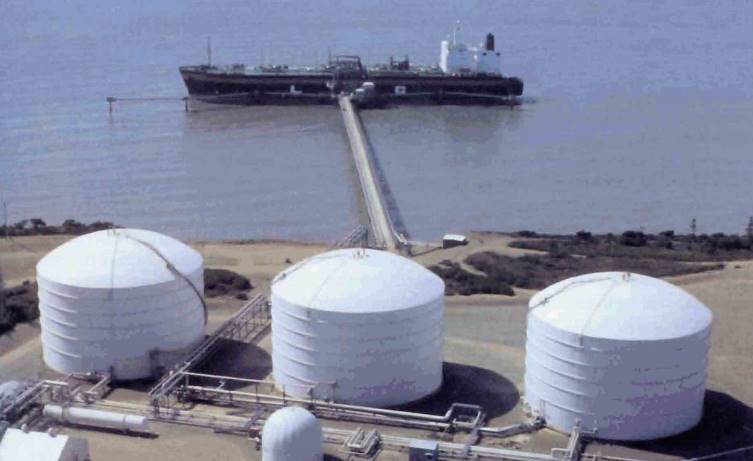
Ship-to-ship LNG transfer operationsShip-to-ship transfer has been extensively used in the LPG trade for delivering cargoes, either when no suitable terminal was available or when it was found more economical to use large ships discharging onto small ships, able to deliver the product to limited shore facilities. In some cases, such as in China in recent years, large ships were anchored off-shore, serving as floating storage pending the construction of shore tanks or because this was found a more economical means of delivery. The storage ships were supplied by visiting ships, bringing the product from the exporter and they then discharged into a fleet of smaller, usually pressurized, ships.
A trend developed over recent years is to use a modified ship or some purpose-built structure as floating storage on an offshore LPG production site. The floating storage receives the LPG, either propane or butane or a mixture of both, directly from the well or from a floating production platform. Visiting ships load from the floating storage and transport the product to its final destination. Several of these units are now in operation, mainly in Africa and the Far East.
Commercial titles LPG
LPG is sold on the international market in several different ways:
- Large quantities are sold under medium-term contracts by producing companies, as, for example Saudi Aramco or Sonatrach, to large users, such as the utility companies or petrochemical complexes, in Japan, or Europe or to large traders.
- Some quantities are sold, mostly on a spot basis, by the same large producers and other smaller producers to smaller users and distributors.
- Some quantities are sold by traders to small users.
The price of LPG varies substantially between summer-time, when demand is not so heavy and winter-time when demand increases, particularly if the winter is severe. It is obvious that producers and traders who are able to store LPG during the low-price seasons are able to make a considerable profit when selling during high-price seasons. This makes for an active spot market in periods of high demand. However, this can be risky as, if the winter temperatures remain high, prices will remain low and the opportunity for profit will slip away.
Among the petrochemical gases, ammonia is traded broadly along the same lines as LPG. Large quantities of ammonia are sold under medium-term contracts by producing companies to users, who are mainly urea producers. Some quantities are also sold by traders taking advantage of the market fluctuations. Finally, there are always some small quantities sold on a spot basis to compensate for unexpected shortages, due either to failed delivery or increased demand.
Other petrochemical gases, such as:
- ethylene;
- propylene;
- butadiene;
- and vinyl chloride monomer,
are sold mostly by refineries, directly to users, under medium-term contracts. However, there is always a demand for small quantities to be sold on a spot basis.
In both cases, medium-term contract or spot sales, a transportation contract has to be signed with the ship-owner. This is always in the form of a time-charter, which is essentially an operating lease. The only exception to this is when the ship-owner is also a trader and transports his own product.
A time-charter specifies the main characteristics of the vessel, the obligations of the ship-owner and of the charterer. LPG time-charters are based on conventional oil tanker charter provisions, with additional clauses relating to the specific products to be transported.
Hire charges are normally paid throughout the charter period, except when the ship is not available due to some failure of ship or owner. Hire is paid monthly in advance based on an all-inclusive daily rate applicable to the entire period. The ship-owner pays for all the operating costs of the vessel, except for fuel, port charges and canal dues (Suez and Panama), which are the responsibility of the charterer. In some very exceptional cases, for example, if the charterer should order the vessel to sail into a war zone where an insurance premium is required, this is also the responsibility of the charterer.
Special clauses applicable to LPG charters relate to the specification of the cargo to be loaded, the conditions of the cargo in terms of quality, pressure and temperature at loading and at discharge and the provisions for measuring the cargo quantity on board.
LPG and petrochemical gases are sold based on their weight and the quantity loaded and discharged is, most of the time, measured on board and calculated under the supervision of an independent surveyor.
The master signs a bill of lading, which confirms ownership of the cargo and allows the receiver to accept the cargo at the discharging port. A copy of the bill of lading is usually retained on board.
Liquefied natural gas (LNG)
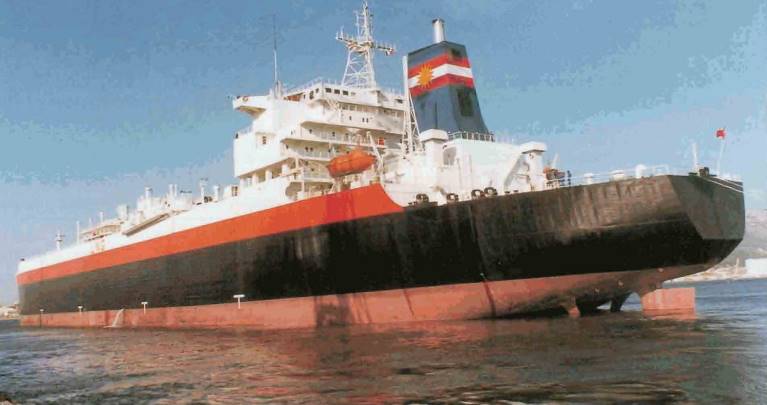
The fleet LNG
The development of LNG shipping has been more rapid than that of LPG shipping. The total capacity of LNG ships equaled that of the LPG fleet by the mid-80’s after being in existence half as long and with one-tenth the number of ships.
The first LNG ships were of relatively small capacity, between 20 000 and 30 000 m3. At the end of the 60’s, sizes over 70 000 m3 were already used. Polar Alaska and Arctic Tokyo, delivered in 1969/70, had a capacity of 71 500 m3. Very soon after that, the first 125 000 m3 capacity ships were built. This size (i. e. 125 000-130 000 m3) has been a standard for many years and has only been slightly increased on the most recent ships with capacities up to 138 000 m3. Ships have recently been discussed with capacities of 145 000 m3. All shipyards have designs of ships with capacities up to 160 000 m3 or even 200 000 m3, and even larger ships would probably be feasible. Up to now, however, there has not been much interest for larger sizes.
There are several reasons for the consistency in size:
- Most existing terminals were built to accommodate ships in the 125 000/135 000 m3 range and, were new terminals to be designed and built for larger ships, they would not be able to accommodate smaller ships and would lose flexibility.
- Large volume projects favour reliability over profitability by preferring two smaller ships rather than one very large vessel.
- Shipyards have been developing equipment to build standard size ships and more investment would be needed if the size was substantially changed.
The number of LNG ships in January 2000 is 117, with another 16 on order. Three quarters of the existing ships and 95 % of the ships on order are of a capacity larger than 125 000 m3. Table 7 shows the progression of the LNG.
| Table 7. Type, Number and Capacity of LNG Tanker Fleet. | ||||||
|---|---|---|---|---|---|---|
| LNG World Fleet | ||||||
| Type, Number and Capacity of LNG Carrier Fleet (at end 1999) | ||||||
| 0-19,999 | 20,000-59,000 | 60,000-99,999 | 100,000-140,000 | Total | ||
| Membrane | Number of Ships | 3 | 5 | 11 | 29 | 48 |
| Total Capacity (m3) | 56,781 | 201,931 | 803,400 | 3,764,181 | 4,826,293 | |
| Self-supporting | Number of Ships | 1 | 6 | 4 | 58 | 69 |
| Total Capacity (m3) | 19,474 | 206,476 | 354,960 | 10,768,606 | 11,349,516 | |
| Total | Number of Ships | 4 | 11 | 15 | 87 | 117 |
| Total Capacity (m3) | 76,255 | 408,407 | 1,158,360 | 14,532,787 | 16,175,809 | |
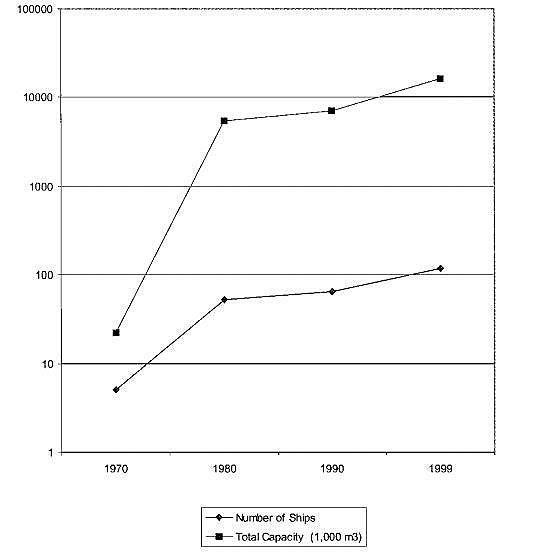
Fleet through the years in table 8 shows the situation at the end of 1998.
| Table 8. LNG Tankers – Growth of World Fleet to End of 1999 | ||
|---|---|---|
| Number of Ships | Total Capacity (1 000 m3) | |
| 1970 | 5 | 22 |
| 1980 | 52 | 5,437 |
| 1990 | 64 | 6,991 |
| 1999 | 117 | 16,176 |
Table 9 shows the number of ships on order at the end of 1999.
| Table 9 – Type, Number and Capacity of LNG Tankers on Order at End of 1999 | ||||||
|---|---|---|---|---|---|---|
| LNG World Fleet | ||||||
| Type, Number and Capacity of LNG Carriers on order (at end 1999) | ||||||
| 0-19,999 | 20,000-59,999 | 60,000-99,999 | 100,000-140,000 | Total | ||
| Membrane | Number of Ships | 1 | 0 | 1 | 7 | 8 |
| Total Capacity (m3) | 22,500 | 0 | 0 | 964,400 | 986,900 | |
| Self-supporting | Number of Ships | 0 | 0 | 0 | 8 | 8 |
| Total Capacity (m3) | 0 | 0 | 0 | 1,100,000 | 1,100,000 | |
| Total | Number of Ships | 1 | 0 | 1 | 15 | 16 |
| Total Capacity (m3) | 22,500 | 0 | 0 | 2,064,400 | 2,086,900 | |
The trade LNG
83 million tonnes of LNG were carried by ship during 1998. More than 50 % of the total quantity was delivered to Japan from countries as diverse as:
- USA;
- Australia;
- Indonesia;
- Malaysia;
- Brunei;
- Abu Dhabi and Qatar.
Most of this LNG is sold under long term contracts and the ships transporting it are chartered for periods of 20 or even 25 years.
Read also: General information and Rules for Ships carrying LNG and LPG
LNG projects are very complicated to organize. The investment required is huge, in the order of several billion US Dollars. To obtain the required finance, the volume of product contracted, the duration of the contract and the commercial security of the project have to satisfy the lenders that the return on their investment is reasonably safe for the duration of the contract.
The development of an LNG project up to delivery of the first cargo would include:
- Discovery of the gas and confirmation that reserves are sufficient for the intended project.
- Negotiation of a sale and purchase contract to be signed between the supplier and the buyer which includes, amongst other things, the quantity to be delivered, the purchase price, the starting date and duration of the contract and provisions to protect both parties in case of interruption.
- Development drilling of the non-associated gas field or separation of gas and oil production in an associated gas field.
- Construction of the necessary pipeline and compressors to deliver gas to the liquefaction plant.
- Construction of the liquefaction plant and LNG storage tanks.
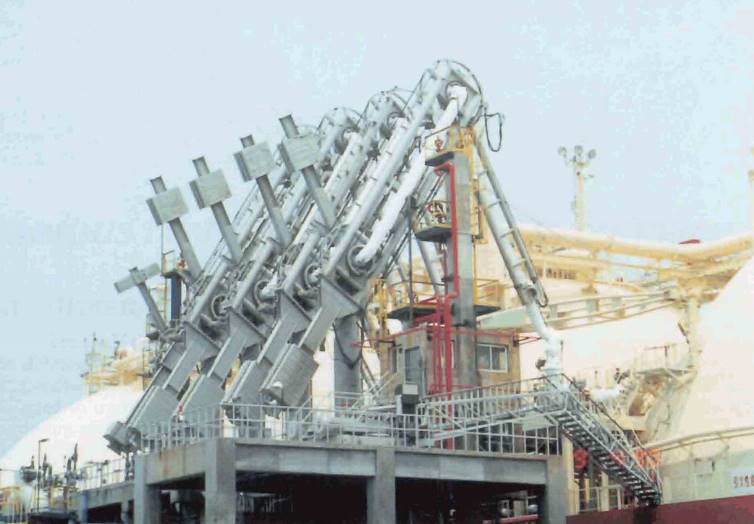
- Construction of LNG loading lines and facilities, ship berth and sometimes harbor works such as breakwaters and dredging.
- LNG ship construction or acquisition of existing vessels.
- Construction of LNG discharging berth, unloading lines and facilities and sometimes harbor works.
- Construction of LNG receiving terminal including storage, vaporization and send-out facilities.
- Tie-in to a gas distribution network or electrical power plant.
All these facilities, which constitute what is called the LNG chain, have to be negotiated, financed, designed and built in due time to be available for the start-up of the project.
All this involves different countries, different contractors, shipyards, suppliers of large units of equipment, banks, insurance companies, lawyers and more. It is not surprising that, from the initial discovery of the gas to the first delivery of cargo, a period of five years seems to be the minimum time required.
Most LNG contracts are signed for periods of 20, sometimes 25 years and the necessary guarantees to protect all partners in the project during these long periods are developed only after extensive and delicate negotiations. The commercial and legal aspects of the total LNG project have proved to be the most time consuming and frustrating. Several projects have aborted at a very advanced stage, during such negotiations. The most spectacular case was the termination of the very large El Paso project between Algeria and the USA at the beginning of the 1980’s after ten years preparation and only two years of operation.
At the end of 1998, 44 long-term LNG contracts were operating, involving 23 country-to-country trades. The LNG was loaded at 14 loading terminals and discharged at 32 receiving terminals. Table 10 shows the main international sea-borne trades of LNG in 1998.
| Table 10. LNG – Main Seaborne Trade – 1998 (GZZGNL) | ||||||||||
|---|---|---|---|---|---|---|---|---|---|---|
| LNG – Main Seaborne Trade – 1998 (million tonnes) | ||||||||||
| Imports | Exports | |||||||||
| Indonesia | Algeria | Malaysia | Brunei | Australia | Abu-Dhabi | Libya | USA | Qatar | Total | |
| USA | 0,00 | 1,40 | 0,00 | 0,00 | 0,20 | 0,05 | 0,00 | 0,00 | 0,00 | 1,65 |
| Taiwan | 1,60 | 0,00 | 1,60 | 0,00 | 0,00 | 0,00 | 0,00 | 0,00 | 0,00 | 3,20 |
| S. Korea | 6,80 | 0,00 | 4,00 | 0,70 | 0,00 | 0,00 | 0,00 | 0,00 | 0,00 | 11,50 |
| OECD | 0,00 | 16,40 | 0,00 | 0,00 | 0,00 | 0,90 | 0,80 | 0,00 | 0,10 | 18,20 |
| Japan | 18,00 | 0,00 | 9,30 | 5,30 | 6,90 | 4,50 | 0,00 | 1,30 | 2,00 | 47,30 |
| Total | 26,40 | 17,80 | 14,90 | 6,00 | 7,10 | 5,45 | 0,80 | 1,30 | 2,10 | 81,85 |
Several new contracts started operating during 1998 and 1999. These include deliveries from:
- Qatar to Japan;
- Algeria to Greece;
- Nigeria to Europe and Trinidad and Tobago to the USA and Europe.
A number of other projects are being discussed, with starting dates expected within the next two to three years. These involve new liquefaction plants or expansions being built, such as in:
- Qatar;
- Australia;
- Malaysia;
- Oman;
- Yemen and in the Saladin Islands and new reception facilities;
- as in several places in India;
- Puerto Rico;
- China;
- Korea and Taiwan.
Some of these projects are more secure than others. The recent economical slow down in the Far-Eastern countries has delayed a few projects. The attraction of LNG as a clean fuel, however, added to efforts to reduce its price, aided by the very strong competition existing between sellers, is maintaining good prospects of a regular increase in the quantity of LNG sold around the world.
In addition to long-term contracts, approximately 5 million tonnes of LNG have been traded on short-term contracts during 1998, with ships hired on short-term or even voyage charter. Many liquefaction plants are able to produce slightly more than their contractual obligations and several vessels are still available for short-term charter. Some buyers require small quantities, pending the start of a long-term contract or to supplement existing delivered quantities. These factors have led to the development of short-term contracts. Short-term LNG trades have taken place between:
- Abu Dhabi and Europe or the USA;
- between Australia and Europe;
- between Brunei, Malaysia, Indonesia;
- Australia and Japan, Taiwan, Korea;
- between Australia and the USA;
- and more recently between Malaysia and the USA;
a distance of 12 700 miles, setting a record for the longest haul for a cargo of LNG.
It would seem that more short-term contracts will be developed in the future, although ship availability might be a restricting factor.
The terminals LNG
We have seen above that there are, at present, 14 LNG loading terminals and 32 LNG receiving terminals around the world. All, bar 2 loading and 7 receiving terminals, have berths designed for ships of 125 000 m3 or above. Some of these berths can also receive smaller ships. All the loading and receiving berths, except for 2, have been specially built and are only used to receive LNG vessels. The two exceptions are berths in Japan which were converted from oil tanker berths.
Some terminals have only one berth, but others, designed to deliver or receive larger quantities, can have up to three or four different berths, enabling them to serve several ships at the same time.
In the near future, several new loading terminals will start operation in Trinidad and Tobago, Nigeria, Oman and Yemen as well as two receiving terminals in Greece and Puerto Rico, and several others are being discussed, in particular in India and also Corea, China and Taiwan.
Although some efforts have been made to achieve some sort of standardization of berth design, this has only been effective in determining the position and diameter of the loading/discharging manifolds and the position of the hooks for mooring lines. Ships calling at several different berths must have other equipment adapted to each berth. This applies mainly to the location of the shore gangway and the connections and type of systems used for communications and Emergency Shut-Down System (ESDS).
The design of an LNG terminal involves more than the design of the berth itself. Access from the sea and services provided by the ports to ensure the ships a safe transit in and out of port are also very important, as well as the availability of safety equipment, trained personnel and well specified and rehearsed contingency procedures in case of accident.
Commercial titles LNG
Liquefied Natural Gas (LNG) is usually sold under long-term contracts, signed for periods of 15 to 25 years . The most common contract duration is 20 years. There are good reasons for signing contracts for such long periods.
- LNG requires very extensive facilities for its production as well as for its use.
- The establishment of an LNG project requires huge investments which are only possible if a reasonable return is guaranteed over a period sufficient at least to recover the value of the investment.
- An interruption of the LNG supply would affect large numbers of people who would be deprived of their domestic gas or electricity supply.
With the exception of the USA and Australia, LNG tends to be produced in developing countries, and used in developed countries. However, this trend is changing with the soon-tobe started import projects in India and China.
Sellers of LNG are usually groups of various organizations. These can include the oil company who discovered the gas, the government of the country where the gas is located, banks and finance organizations funding the project, and, possibly, following a recent trend, representatives of the buyers, interested in securing their supply.
Buyers of LNG are, very often, the large utility companies able to build and manage the necessary infrastructure to receive, distribute or otherwise use the gas.
At the start of negotiations between buyers and sellers, a Letter Of Intent (LOI), containing few details and not considered binding, is usually signed. This is followed by the lengthy negotiation of the final Sale and Purchase Agreement (SPA). However, there is often an intermediate stage, which is marked by the signature of a Memorandum of Understanding (MOU), sometimes called Heads of Agreement (HOA).This document has a limited life, but includes all the key commercial terms, including the LNG price and provides a much higher level of commitment between the parties than the Letter of Intent. In some recent negotiations, a Confirmation of Intent (COI) has been used. A COI is a firmer, more defined version of the industry standard LOI. The COI defines volume and build-up, as well as establishing a price range within which the final sales price will be agreed. The COI is not a legally binding document. However, the firm character of the COI allows sellers and buyers to move directly to a SPA, avoiding the intermediate step of negotiating a MOU. The period between signature of the LOI and the final signature of the SPA can be very long, sometimes one year or more. During this time, the partners must arrange the financing necessary to carry out the project.
The Sales Contract can be Free on Board (FOB) if the buyer is providing the shipping, or Cost Insurance and Freight (CIF) or Ex-Ship if the seller provides the shipping. In the first case, title in the cargo is transferred to the buyer when the cargo crosses the rail of the ship at the loading port. In the second case, title only transfers when the cargo crosses the rail of the ship at the discharging port. The type of contract signed determines which party has the responsibility to provide the shipping for transporting the cargo between the loading and discharging port.
Either way, a transportation contract must be signed with the ship-owner, normally in the form of a Time Charter or of a Contract of Affreightment (COA), which are both essentially operating leases. The Time Charter includes the rate of hire for the use of the vessel and payment of the operating costs, which cover all costs required for the ship’s operation, except fuel, LN2, port charges and canal dues (Suez and Panama). These items, referred to as voyage costs, are the responsibility of the charterer. In case of a COA, the remuneration is based on the quantity of cargo transported and includes all operating and voyage costs.
The hire is paid monthly in advance for short-term charters of up to 3 years, based on an all-inclusive daily rate which applies for the entire period. For longer-term charters, the hire is divided into the Capital Element, which remains fixed, usually for the full term of the charter, and the Operating Element which depends on the actual cost of ship operation and takes into account cost escalation.
Hire charges are normally paid throughout the charter period, except when the ship is not available due to some failure of vessel or owner. For long-term charters, the scheduled dry do clung periods are also designated off-hire.
A time-charter specifies the main characteristics of the ship, the obligations of the ship owner and of the charterer. LNG time-charters are similar to LPG time-charters and are based on conventional oil tanker charter provisions, with additional clauses relating to cryogenic performance. These additional clauses are quite different in an LNG charter-party from those in an LPG contract. One clause specific to LNG time-charters relates to the use of the cargo boil-off as fuel. The fuel consumption and the amount of boil-off generated, paid for by the charterer, are influenced by the way the ship is operated and maintained, which is the responsibility of the ship operator. The conversion of the heating value of boil-off gas to its fuel-oil equivalent can lead to serious discussions during charter-party negotiations, when it comes to the determination of possible penalties for exceeding the agreed values.
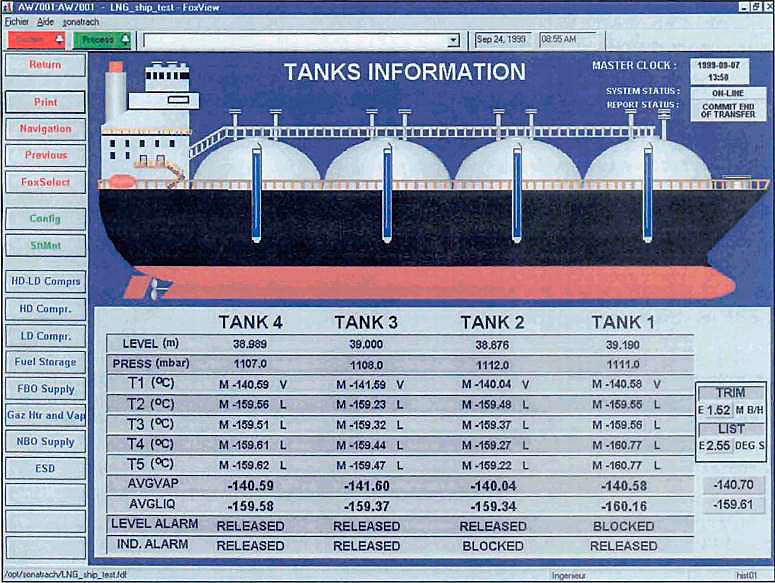
Another important clause of an LNG charter-party is the specification for measurement of cargo quantity on board. The volume of cargo sold is always measured on board ship. This is the volume of cargo loaded at the loading port in the case of an FOB contract and the volume of cargo discharged at the receiving port in the case of a CIF or Ex-Ship contract. All LNG ships have their tanks very carefully measured by an accredited independent surveyor and these measurements are, very often, certified by the customs authorities of the seller’s and buyer’s countries. The measurement equipment in the tanks, which includes level, pressure and temperature gauges, are also very carefully checked and regularly calibrated under third-party supervision. Modern ships are all equipped with computerized custody transfer systems, which automatically calculate the volume of product in the tanks with all necessary corrections for ship trim and list and cargo temperature. Such calculations are always confirmed by an accredited, independent surveyor.
LPG and other petrochemical gases are manufactured products based on well-defined specifications. Their composition is well known and they are sold by weight. LNG, on the contrary, is a natural product of variable composition, which can contain significant amounts of nitrogen which has no commercial value. This is why the LNG unit of sale is based on calorific value expressed in million BTU per unit of volume.
One way of determining the calorific value of a product is to know its exact chemical composition. The chemical composition of the LNG cargo delivered is determined by chromatographic analysis of samples taken at random during the loading or discharging operation. The volume of cargo loaded or discharged, as measured on board, and the calorific value determined by the chromatographic analysis are used to produce the invoice representing the value of the cargo delivered.
The original of the bill of lading is sent to the buyer’s representative at the receiving port and a copy is carried on board.