Explore the Loran-C navigation system in this comprehensive guide. Learn about Loran-C charts, overprinted charts, rate designators, ASF compensation, and more.
- Introduction
- Loran-C Charts: Third Vital Component of the System
- Loran-C Overprinted Charts
- Rates Printed on NOS Charts
- Intervals Between Adjacent TDs and Spacing
- Rate designators on NOS Charts
- ASF Compensation on NOS Loran-C Charts
- Standard Color Coding for Loran-C TDs
- Plotting and Interpolation
- Use of Loran-C Without Loran-C Overprinted Charts
- Local Notice to Mariners
- DMA Publications
Discover how to effectively use Loran-C for accurate navigation without specialized charts.
Introduction
This article discusses Loran-C overprinted charts and related Loran-C information available from the various agencies of the US government. Relevant information includes the Loran-C charts, DMA published manuals on ASF corrections (discussed in The Loran-C System: A More Detailed View“Understanding Loran Transmitters and Hyperbolic Systems”), and material furnished by USCG, including the Local Notice to Mariners and related information. This article is principally of interest to mariners.
Loran-C Charts: Third Vital Component of the System
As noted in Introduction and Overview of Loran-C“What is Loran-C? Exploring Its Role in Marine Radionavigation”, the Loran-C system consists of land based transmission and control systems, a receiver to measure TDs, and Loran-C overprinted charts, used for navigation and for plotting and converting the measured TD data into latitude and longitude. These charts are not used by aviators. As noted, aviation users work in latitude and longitude units exclusively. For US waters, these charts are prepared and published by the US Department of Commerce, National Oceanic and Atmospheric Administration (NOAA), National Ocean Service (NOS).
For other parts of the world, the Department of Defense (DOD), Defense Mapping Agency, Hydrographic/Topographic Center (DMAHTC), publishes nautical charts, many overprinted with Loran-C TDs. Additionally, several other countries of the world publish Loran-C overprinted nautical charts. Canada, for example, publishes excellent Loran-C charts of both Canadian and adjoining US waters.
The focus of this discussion is upon charts of US waters, therefore, the charting conventions of NOS will be emphasized. Chart conventions generally agree among the various countries, although there are some minor differences. Readers wishing information on chart conventions employed in other countries should write directly to the NOS counterpart in the country of interest. Useful material on NOS conventions can be found in Stuart (1986, 1991) or obtained directly from NOS.
Loran-C Overprinted Charts
Charts available from NOS are identified in the NOS Chart Catalog, issued in five volumes, including:
- The Atlantic and Gulf Coasts (Volume 1);
- The Pacific Coast, including Hawaiian, Mariana and Samoa Islands (Volume 2);
- Alaska, including the Aleutian Islands (Volume 3);
- The Great Lakes and Adjacent Waterways (Volume 4);
- and finally a fifth volume covering Bathymetric and Fishing Maps, including Topographic/Bathymetric Maps.
These chart catalogs are available at no charge from authorized NOS sales agents, or directly from NOS at 6501 Lafayette Avenue, Riverdale, Maryland 20737. The catalogs contain a small scale chart of the applicable areas of US CCZ waters with coded rectangles (outlining the area covered by each NOS chart) superimposed. These rectangles contain the chart number, and are also color coded to reflect the scale of the chart. Harbor charts, for example, at a scale of 1:50 000 and larger are printed in a purple outline, while coast charts, with scales of from 1:150 000 to 1:50 000 are outlined in blue. Inset panels provide more information on the various charts, including the chart number, title, and scale. Charts prefixed with a “C” inside a circle (similar in appearance to a copyright mark) areoverprinted with Loran-C TDs.
Although the catalog enables the identification of which charts are overprinted with Loran-C TDs, this catalog does not identify which rates are shown on these charts. Loran-C overprinted charts are available for the entire CCZ and many other areas as well. Loran-C overprinted bathymetric maps Maps that show enhanced bottom detail. By convention, these are called maps rather than charts.x are also available for selected areas, and loran overprinted transparentmylaroverlays can be obtained upon special request (and at additional cost) from NOS. These loran overprinted bathymetric maps are much used by fishing vessels.
With very few exceptions, Loran-C TDs are not printed on any chart with a scale larger than 1:80 000 (1:75 000 in Canada). For the present, this is a deliberate NOS (also USCG and DMAHTC) policy, made because the ASF data presently available are not accurate enough for presentation at larger scales. Other navigational systems (e. g., radar, visual fixes, depth information) are available for inshore piloting and are almost always adequate.
Absolute (geodetic) accuracy limitations of Loran-C in near shore and harbor areas are explained in The Loran-C System: A More Detailed View“Understanding Loran Transmitters and Hyperbolic Systems” and Loran-C Position Determination and Accuracy“LORAN-C System: Accuracy and Position Determination” and arise from the sometimes unpredictable effects that land has on loran signals. To some degree, this limitation could be removed by gathering extensive and costly survey data. However, the ready availability of satisfactory alternatives to the use of Loran-C for navigation in these waters and the high cost of such surveys have resulted in the policy decision not to print loran LOPs on large-scale charts.
As well, it is NOS policy not to show Loran-C TDs for:
- inshore waters,
- bays,
- rivers,
- protected harbors (nor over land areas) on smaller scale charts which include these areas.
As a point of interest, these LOPs are actually calculated throughout the area covered by the chart by the computer programs used by NOS, but “painted out” over these regions on the photographic negatives prior to printing the chart.
Rates Printed on NOS Charts
Rates (GRI and secondaries) shown on each overprinted chart are specifically identified in the Loran-C notes on each chart (see below). NOS loran overprinted charts include at least the recommended rates shown in the coverage diagram, but not necessarily all rates that can be receivedin the waters covered by the chart. If the spacing between LOPs is excessive (poor gradient), or the crossing angle is too small (see Loran-C Position Determination and Accuracy“LORAN-C System: Accuracy and Position Determination”), a rate may be not be shown on the chart. In particular, LOPs in the fringe area of ground wave coverage, or in the baseline extension area for a specific rate, are usually deleted from the chart. The decision to omit a rate depends upon several factors, including chart clutter, and is made jointly by USCG and NOS. However, if a particular rate is shown on the coastal series charts in an area, it will also be shown on smaller scale charts of the same waters.
NOS Loran-C overprinted charts
- TDs not shown over land areas;
- TBs not shown on large-scale charts;
- Only selected rates shown;
- TD intervals based upon gradient and may not be constant across chart;
- Rates have standard color coding;
- ASF corrections included on all but smallest scale charts.
Intervals Between Adjacent TDs and Spacing
As noted in earlier articles, it would be impractical to print LOPS on nautical charts corresponding to each possible TD. Therefore, only selected TDs are printed. The interval spacing (in microseconds) between the adjacent TDs printed on the nautical chart depends upon the gradient (see Loran-C Position Determination and Accuracy“LORAN-C System: Accuracy and Position Determination”) and the chart scale. The overall objective of the cartographer is to select an interval (difference in microseconds between adjacent TD lines) that will result in lines of position spaced approximately 3/4″ to 1/14″ apart-in any event not closer than 1/2″, nor farther apart than 2″. Table 1 shows the interval between adjacent charted TDs (in usec) and the chart scale and gradient (fthsec) necessary to achieve a chart spacing of 0,5 in, 1,0 in, or 2,0 inches.
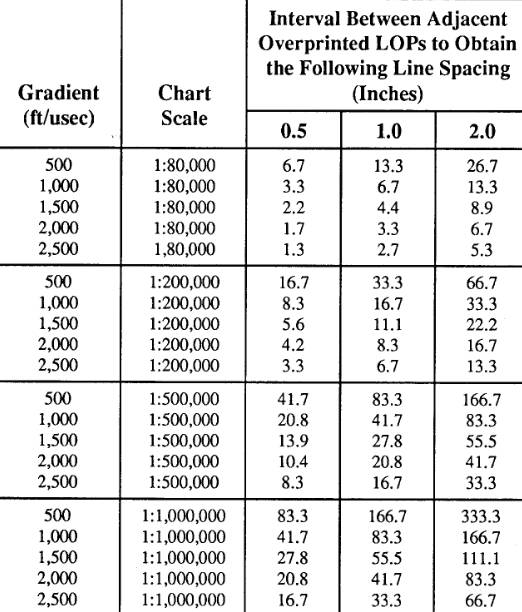
For example, charting an LOP near the baseline (gradient approximately 500 ft per usec) at a 1:80 000 scale (typical of coastal charts) would require an interval of 6,7 usec to achieve a spacing of 0,5 in or 27 usec to achieve a spacing of 2 in between adjacent TDs. An interval of 10 or 20 usec might be used. However, if the gradient were as large as 2 500 ft/usec, a smaller interval, such as 2, 4, or 5 usec would be appropriate. Too small an interval results in a cluttered and unusable chart, while too large an interval complicates the task of interpolation using a plotter (see below).
Microsecond intervals between adjacent TDs are usually selected as multiples of 5 or factors of 100 (e. g., 5, 10, 20, 25, or 50). On larger scale charts, smaller intervals of 1, 2, or 4 microseconds may be employed. On smaller scale charts, intervals of 200, 250, or 500 microseconds are necessary to ensure the desired spacing between adjacent LOPs.
Normally, the interval will be constant for a rate throughout the chart, but in some cases it is necessary to vary the spacing for the same rate in different areas of the chart This would occur, for example, if the gradient varies substantially over the area covered by the chart.x. In this event, the larger interval is selected as an integer multiple of the smaller. For example, if the TDs spaced at a 10 microsecond interval begin to “spread” such that the spacing is not within tolerances, a 5 microsecond interval would be used for aportion of the chart to maintain the desired spacing of LOPs. The microsecond intervalbetween adjacent TDs may differ among the rates shown on the chart.
These conventions on line spacing are quite reasonable, and undoubtedly result in a chart of greater utility. However, users should note carefully the interval between adjacent TDs when plotting a position and not make the assumption that the interval is constant throughout the chart for a given rate, or the same for all rates shown on the chart.
Rate designators on NOS Charts
Rate designators are the coded sequence of numbers or index that identify a rate. Thus, for example, the rate designator for a loran TD printed with the index “9960-W-14500” would be “9960-W.” These rate designators are shown every fifth TD on Loran-C overprinted charts produced by NOS unless the microsecond interval is 25, 50, or 250 microseconds.
In this latter event, rate designators can be shown on every fourth line, such that the indexed lines will be at 100, 200, or 1 000 microsecond intervals.
ASF Compensation on NOS Loran-C Charts
As noted in The Loran-C System: A More Detailed View“Understanding Loran Transmitters and Hyperbolic Systems”, the location of the Loran-C LOP on a chart depends upon the speed of propagation of the loran radio waves from the transmitter(s) to the user’s position. In particular, it is often necessary to include an allowance for landpath delays in computing the location of a Loran-C LOP on the nautical chart. These delays, termed ASFs, can be computed from theoretical propagation models (see Exploring Loran-C Millington’s Method“Loran-C Millington’s Method – Conductivity and Propagation”) or a combination of theoretical models and actual survey data. Where actual survey data of acceptable quality are available, ASFs are calculated by statistical procedures that force fit the TD lattice so as to reflect the theoretical estimates and provide good fits to the survey data as well.
The surveys are conducted by various agencies of the US Government and provided to DMAHTC for ASF calculation For a useful discussion of DMAHTC’s role, activities, and methods, see Speight, (1982).x. In turn, DMAHTC provides computer tapes containing the ASF corrections to NOS for use in chart compilation. The format and “fineness” of the ASF grid varies from chart to chart. For example, for charts with a scale smaller than 1:875 000, ASF corrections are probably unnecessary. This is because the differences between corrected and uncorrected LOPS would appear very small when plotted on such a small-scale chart. Recall from The Loran-C System: A More Detailed View“Understanding Loran Transmitters and Hyperbolic Systems” that ASF corrections are generally within +/- 4 usec.
For charts with a scale between 1:250 000 and 1:875 000, DMAHTC may provide a single ASF lattice shift (in microseconds) for each rate to be charted. This shift represents an average correction for overland signal delay and is constant over the entire area of chart coverage. Alternatively, for coastal charts with a scale larger than 1:250 000, DMAHTC furnishes NOS with a data tape containing ASF corrected Loran-C coordinate values for each rate at every 5 minutes of latitude and longitude in the area of chart coverage. On these charts, if the hyperbolic curvature of the TDs is clearly noticeable (e. g., in areas near baseline extensions) a finer grid (e. g., at 1 minute intervals) is provided.
The available survey data varies by area, and is described on each chart with a specific chart note found as part of the Title Block or in the Supplemental Notes where the other general loran information is presented. Table 2 provides the text of the three standard chart notes now being printed on NOS Loran-C overprinted charts.
| Table 2. General notes found on relevant editions of Loran-C overprinted charts Older charts may contain other text, but all are being revised to include one of the above notes. Read the note on your chart carefully, however, to determine whether or not to use the ASF tables for adjustment.x | |
|---|---|
| Note | Remarks |
| “The Loran-C correction tables published by the Defense Mapping Agency or others should not be used with this chart. The lines of position shown have been adjusted based on survey data. Every effort has been made to meet the 114 nautical miles accuracy criteria established by the U. S. Coast Guard, Mariners, however, are cautioned not to rely solely on the lattices in inshore waters.” | Most common and recent note, found particularly on coastal charts. Indicates that ASF corrections have been applied and updated with current survey data. |
| “The Loran-C correction tables published by the Defense Mapping Agency or others should not be used with this chart. The lines of position shown have been adjusted based on theoretically determined overland signal propagation delays. They have not been verified by comparison with survey data. Every effort has been made to meet the 114 nautical mile accuracy criteria established by the U. S. Coast Guard. Mariners, however, are cautioned not to rely solely on the lattices in inshore waters.” | This indicates that theoretical ASF corrections have been applied – and, therefore, that the mariner should not make. these adjustments – but that survey data have not been considered in determining the location of the overprinted TDs. |
| “The Loran-C correction tables published by the Defense Mapping Agency or others should be used with this chart. The lines of position shown are based on assumed all seawater signal paths. Uncorrected positions may not meet the 114 nautical mile accuracy criteria established by the US Coast Guard. Mariners, however, are cautioned not to rely solely on the lattices in inshore waters This note is being phased out on new charts.x. | Normally applies only on very small scale charts where ASF corrections are unlikely to be important. |
| Or alternatively, “The Loran-C lines of position on this chart are based on assumed all sea water signal paths. They are not adjusted for overland signal transmission delay.” | |
Older charts may contain different text, depending upon how the chart was compiled Some of the original coastal charts did not include even theoretical ASF corrections, but these have since been updated.x. Users should read this note carefully to determine whether or not it is appropriate to use the DMA ASF tables to adjust the printed TDs on a chart, or whether these corrections have already been incorporated into the chart.
Provided the user’s Loran-C receiver is programmed to include ASFs, the latitude and longitude read from the receiver should be nearly the same as that determined from the TDs when these are plotted directly on nautical charts corrected for ASF. Some differences may result, however, because the ASFs incorporated into the receiver may differ from those provided by DMAHTC to NOS. Additionally these tables can be used by users to correct TDs prior to automatic conversion on receivers not programmed to include ASFs.
Standard Color Coding for Loran-C TDs
Loran-C rates plotted on NOS (and DMA) charts employ a standard color coding, noted in earlier articles and in the Glossary. As of this writing, no color code has yet been assigned to the Victor secondary, although gold or brown are options under consideration.
The standard color coding for loran TDs serves as an additional check to ensure that the correct line is used to plot a position. Normally, this is not an issue, because the CDs are selected to ensure that there is a wide variation in the numerical values of the various TDs throughout aregion. Additionally,the rate designators (noted above) are shown on selected (every fourth or fifth) TDs. Finally, the color coding serves as yet another check.
Users should pay special attention to identifying the correct family of loran LOPs if these are plotted for two GRIs on the same chart, otherwise substantial position errors could result.
Plotting and Interpolation
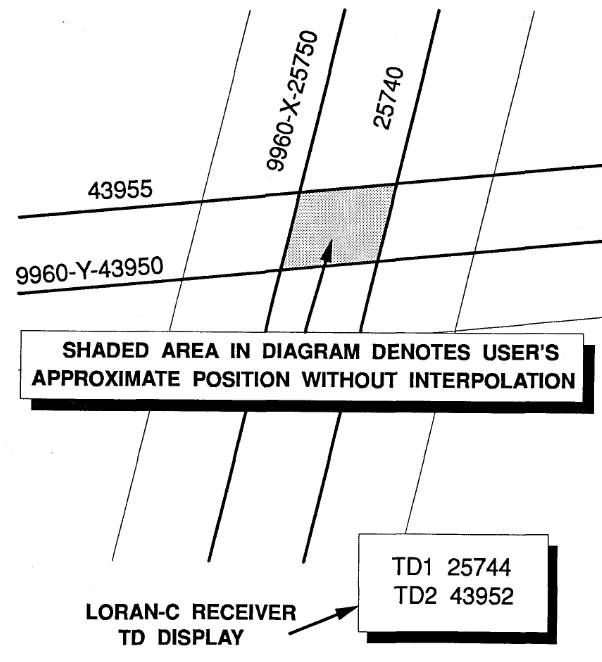
As noted, only selected TDs are overprinted on the charts, so it is generally necessary to interpolate between printed TDs to plot an exact position. For example, suppose the vessel were cruising in the northern areas of Rhode Island Sound. In this location the TDs for best accuracy (refer to coverage diagrams) would be the Xray and Yankee secondaries of the 9960 NEUS chain. Suppose the TD readings on the receiver were 25 744 and 43 952 microseconds. Normally, a receiver would display these numbers with one or two figures to the right of the decimal point for the Xray and Yankee secondaries respectively, but these are omitted here for simplicity.
Reference to the appropriate chart indicates that the TDs for the Xray secondary are spaced 10 microseconds apart, so that 25 744 would be located between the 25 740 and 25 750 TDs. On this same chart, the interval between adjacent TDs on the Yankee secondary is 5 microseconds, so the 43 952 TD line would be located between the 43 950 and 43 955 overprinted TDs.
As shown in Figure 1, without interpolation all that can be said is that the user’s position is in the shaded polygon bounded by the overprinted TDs. For many purposes, this approximate position would be entirely satisfactory, but for more accurate navigation it would be necessary to determine exactly where the vessel is located within this polygon.
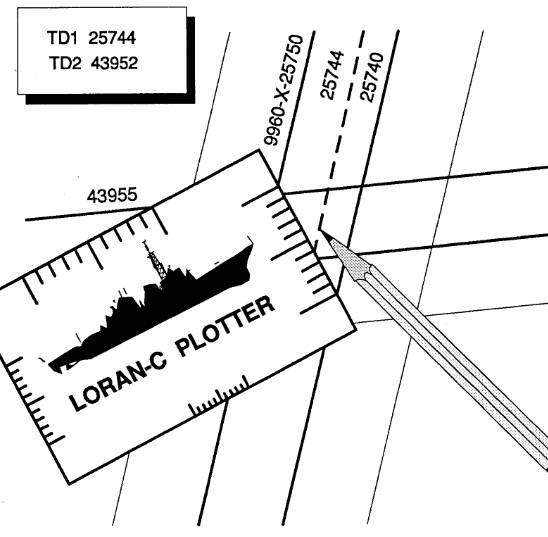
Although loran LOPs are really hyperbolas, it is convenient to treat these as parallel straight lines within a small area and to use linear interpolation. Thus, the 25 744 TD would be parallel to and approximately 4/10ths of the distance between the 25 740 and 25 750 lines. There are several techniques for locating this 25 744 173. Perhaps the simplest is to use one of the many loran linear interpolators on the market, or those provided by NOS or the US CoastGuard. These interpolators are made of plastic or stiff cardboard and have several uniform scales with either 5 or 10 equally spaced divisions.
All that is necessary is to fix one of the scales with one end at the lower TD, and the other end at the upper TD, much asis shown in Figure 2. The desired TD for the Xray TD is located 4 units along the 10 unit scale of the interpolator. Using a pencil, simply make a mark next to the 4th mark out of ten and draw in a 24 744 TD parallel to the adjacent TDs printed on the chart. A similar procedure would be followed for the other TD and the vessel’s location fixed at the intersection of the dotted TDs. In the case of the Yankee secondary, adjacent overprinted TDs are only 5 units apart, so either a 5 unit scale must be used or the difference must be prorated on a 10 unit scale of the plotter.
Depending upon the plotting convention used, the mariner would normally plot the resulting fix as a dot within a circle or dot within a triangle (to denote an electronic fix) and write “LORAN” next to the symbol. The fix time (four-digit 24-hour time) is recorded and written next to the fix symbol and parallel to one of the chart axes.
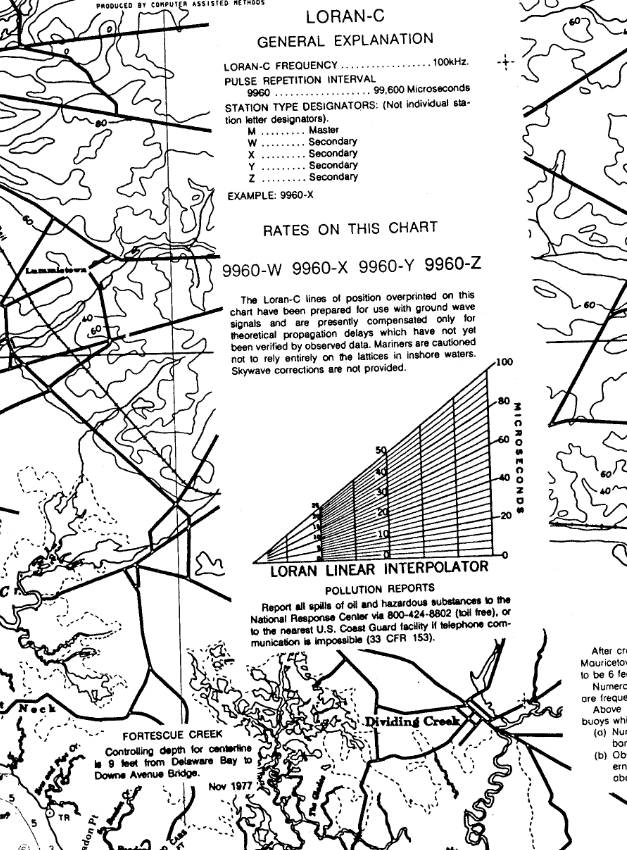
Each Loran-C overprinted chart contains an interpolator printed on the chart, as shown in Figure 2. All that is required to use this interpolator is a set of dividers. The procedure is quite simple. First, the dividers are placed on the chart in the vessel’s approximate position and set to the spacing between adjacent overprinted TDs. Next, one end of the dividers is placed on the bottom of the chart interpolator – while holding the dividers perpendicular to the bottom – and the dividers moved along the bottom axis until the other end of the dividers intersects the line for the appropriate spacing, e. g., 10 microseconds.
The user simply puts a faint pencil mark at the bottom axis at this point. Next, the spacing of the dividers is reduced, while holding one end on the bottom axis, until the other end intersects the desired spacing. This length is then transferred to the chart. In practice, this procedure is easier to do than to describe, and works quite well. Whether to use a separate interpolator or that provided on the chart is a matter of personal preference. Moreover, as noted, it may not be necessary to interpolate at all if the area of the shaded polygon illustrated in Figure 1 is sufficiently small for the navigator’s purpose.
Finally, the user may elect to use the automatic coordinate converter in the loran receiver (if so equipped) and simply plot latitude and longitude directly. Recall, however, that the receiver’s ASF corrections are not subject to any industry standard, and may not ensure that the system accuracy limits are satisfied.
Use of Loran-C Without Loran-C Overprinted Charts
As noted above, USCG, NOS, and DMAHTC have developed a clear policy about which rates to show on a loran overprinted chart, which charts to overprint, and which areas of the charts to overprint with LOPS. Omission of loran overprinting generally means that the absolute accuracy standards of the Loran-C system cannot be guaranteed in the area covered by the chart.
Loran-C can, however, be used in areas where overprinted charts are not available. If the user has previously transited the area and entered waypoints in the receiver memory (or noted these in hard copy form), the user can generally exploit the receiver’s high repeatable accuracy for navigation. Even if previously recorded TDs are not available, the mariner can still use the coordinate conversion capability of the receiver (if so equipped) to determine an approximate position. However, the accuracy of this approximate position cannot be guaranteed, and loran should only be used to provide a general indication of position. Most mariners will encounter this situation (within the CCZ) only in harbors and harbor entrances where other aids to navigation are abundant, and should serve as the primary method for navigation.
Local Notice to Mariners
Another important source of Loran-C information relevant to coastal waters available from the US Government is the Local Notice to Mariners, published by the US Coast Guard, and available from each District office of the US Coast Guard. Experienced mariners rely on the information contained in this publication for chart corrections and other information. It is mentioned here to indicate that loran related information is also presented in this publication.
Table 3 provides a sample of such information pertinent to loran extracted from the Local Notice to Mariners for the Fifth Coast Guard District. In general, this publication is used to disseminate information on such topics as:
- the availability of new chains;
- additional secondaries;
- scheduled maintenance downtime;
- reported interference;
- test efforts;
- and a host of other time – critical information.
The illustrations furnished in Table 3 provide examples of the types of information and data given in this , publication.
| Table 3. Sample Loran-related information found in local notice to mariners |
|---|
| Loran-C operations: Great Lakes chain (GLKS 8970) |
| At 1201 on 14 May 1991 the 8970 MZ baseline; i. e., from the master, located in Dana, IN; to the Zulu secondary, located in Boise City, OK, will be considered fully operational and available to users. This new baseline will expand GLKS Loran-C coverage. The expanded 8970 MWXYZ chain coverage area was approximated based on conservative estimates of station range limits, atmospheric noise, and grid geometry limitations. Our calculations indicate 8970 MWXYZ will provide good Loran-C coverage as follows: states fully covered: all of Kansas, Oklahoma, Missouri, Arkansas, Tennessee, South and North Carolina, Kentucky, Virginia, Maryland, Delaware, West Virginia, Ohio, Indiana, Illinois, Iowa, Wisconsin, Michigan, including coastal offshore coverage from Brunswick, GA, north to Cape May, NJ. Great Lakes coverage: all of Lakes Superior, Michigan, Huron, including the Georgian Bay and all of Lake Erie less the northern quarter. States partially covered: all of Minnesota less the northwestern tip, southeastern corner of North Dakota, eastern half of South Dakota, all of Nebraska less the extreme western end, eastern quarter of Colorado, eastern third of Texas, northwestern half of Louisiana, all of Mississippi, Alabama, and Georgia less the extreme southern regions, and the western half of Pennsylvania. Canadian coverage: coverage extends into the southeastern parts of Canada approximately along a curve from north of International Falls, WI, into Ontario short of the James Bay, over into Quebec and down to Toronto, Canada. Users should address inquiries concerning the Great Lakes Chain, to the coordinator of chain operations, LCDR Piccioni, at (507) 869-1334. Information is also available on the recorded status number, (607) 869-5395. For timing users: USNO will continue to monitor GLKS timing and provide recommended frequency adjustments to the Coast Guard. We trust you will find this new, expanded version of the GLKS chain useful in meeting your navigation or timing needs. |
| SOUTH CENTRAL U. S. (SOCUS 9610) LORAN-C CHAIN OPERATIONAL |
| At 15002 on 17 January 1991 the fourth SOCUS baseline – Boise City – Gillette (9610 MV) – will be considered fully operational and available to users. The remaining SOCUS baseline -Boise City – Las Cruces (9610 MX) – is not yet ready for use. Baseline 9610 MX will not be operational until April 1991. This baseline will be added to those SOCUS baselines declared operational in December. Status of each SOCUS baseline is provided below: BOISE CITY, OK (Master) – GILLETTE, WY (Victor) – 9610 MV (AVAILABLE 17 JANUARY 1991) BOISE CITY, OK (Master) – SEARCHLIGHT, NV (Whiskey) – 9610 MV (AVAILABLE 25 DECEMBER 1991) BOISE CITY, OK (Master) – LAS CRUCES, NM (Xray) – 9610 MX (AVAILABLE APRIL 1991) BOISE CITY, OK (Master) – RAYMONDVILLE, TX (Yankee) – 9610 MY (AVAILABLE 25 DECEMBER 1991) BOISE CITY, OK (Master) – GRANGEVILLE, LA (Zulu) – 9610 MZ (AVAILABLE 25 DECEMBER 1991) Coverage area: All of Iowa, Utah, Colorado, Kansas, New Mexico, Texas, Oklahoma, Louisiana, Arkansas, and off shore of the TexaslLouisiana coast to a line between Brownsville, TX, and New Orleans, LA. Southwestern quarter of Montana, all of Idaho less the northern panhandle, all of Nevada less the western third of state, western half of Mississippi, southwestern corner of Tennessee, all of Missouri less southeastern corner, western third of Illinois, southwestern quarter of Wisconsin, eastern and western thirds of Nebraska, southwestern corner of South Dakota and all of Wyoming less northeastern corner. Mexican coverage: less the area south of Arizona and the Baja Peninsula, most of northern Mexico from a line between Brownsville, TX, and the southern tip of the Baja Peninsula. |
| LORAN |
| Lorsta Boise City (Great Lakes Only) Off-Air. Lorsta Boise City’s test transmissions as a new secondary on the Great Lakes Loran Chain (8970 GLKS) are causing 8970 acquisition problems on some receivers. To minimize the impact on users and give the receiver manufacturers time to correct receiver software, we ceased all 8970 Zulu transmissions from Lorsta Boise City, OK, at 17427,28 September 90. Unfortunately, we must, on at least a daily basis, obtain Loran-C test data concerning the new 8970 Master-Zulu baseline. Further, precise timing measurements to establish emissions delays remain to be done. To meet our daily data needs and minimize interference to users, we will permit Boise City to transmit 8970 Zulu signals during the hours of 1500 to 17002 each day. Daily transmissions from 1500 to 17002 will commence on 03 October 1990 and end on 29 October 1990; on 30 October 1990 Lorsta Boise City, OK, will resume continuous 8970 Zulu transmissions. During the measurement of emission delays, Boise City will be authorized sufficient additional on-air time to accomplish the measurement. When the dates for the emission delay measurement are known, we will advise all concerned. If you object to this procedure or are experiencing unusual problems with the Great Lakes Chain, please contact the coordinator of chain operations, LCDR Piccioni, at (607) 869-1334. Information concerning this problem will also be available on the recorded status, number, (607) 869-5395. Control of chain timing; southeast US (SEUS 7980) and Great Lakes (GLKS 8970) Loran-C chains. The following information will not repeat nor affect most navigation users; timing, as used in this message, relates to the time relationship of the loran chain master’s signal to the naval observatory’s master clock. Those navigation receivers dependent on measuring a master-secondary time difference will be unaffected by the control changes described. As part of our compliance with legislated reductions in timing tolerances, we have been experimenting with procedural attempts to meet the demands of the law. With SEUS, we have been allowing the USCG coordinator of chain operations (COCO) to calculate and enter timinglfrequency adjustments; in this procedure, all previous limitations, e. g., advance notification to users, minimum times between adjustments, etc., were removed; adjustment size, however, was limited to (per day) 300 nanosecond time steps and 12 parts in 10 to the thirteenth in frequency. With GLKS, we used daily small time steps (always less than 300 nanoseconds and usually 100 nanoseconds or less). On 29 Oct 90 we will change the above-mentioned SEUS/GLKS control methods to that now being used with the Northeast US (NEUS 9960) Chain, i. e., steering each master’s cesium frequency by daily insertion of naval observatory recommended frequency adjustments. Loran-C Operations: South Central US Chain (9610 V) and North Central US Chain (8290 X). During the week of 15 Oct 90 Lorsta Gillette, WY, will commence transmissions as a SOCUS 9610 Victor secondary and NOCUS 8290 – secondary. Transmissions will be intermittent and are test signals only. Do not, repeat, do not use these signals for any navigation or timing purposes. |
The Local Notice to Mariners also provides contact information (names and telephone numbers) for US Coast Guard personnel from whom additional information can be obtained on the status of Loran-C chains.
DMA Publications
As noted earlier, DMAHTC publishes Loran-C overprinted charts, tables of ASF information, and other relevant material. Readers are also advised of the availability of DMA Chart 5 133, which provides information on loran coverage worldwide.

- Abramowitz, M., et al. “Approximate Method for RapidLoran Computation,” Navigation; Journal of the Institute of Navigation, Vol. 4, No. 1, March 1954, pp. 24-27.
- Alexander, G. “The Premier Racing Tool,” Ocean Navigator, Issue No. 20, Jul/Aug 1988, pp. 37, er seq.
- Anonymous. “Loran: Installation Pitfalls, and How Friendly Should Your Loran Be?” Practical Sailor, Vol. 11, No. 24, December 15, 1985, pp. 1, et seq.
- Anonymous. Manual on Radio Aids to Navigation, International Associationof Lighthouse Authorities, Nouvelle Adresse, 13 Rue Yvon-Villarceau 75 116, Paris, 1979.
- Appleyard, S. F. Marine Electronic Navigation. Routledge and Kegan Paul Ltd., Boston, MA, 02108, 1980.
- Ashwell, G. E., B. G. Pressey, and C. S. Fowler. The Measurement of the Phase Velocity of Ground Wave Propagation at low Frequencies Over a Land Path. Proceedings of the Institute of Electrical Engineering (London) 100 Part III, 1953.
- Bedford Institute of Oceanography. Loran-C Receiver Performance Tests, Bedford Institute of Oceanography, P. O. Box 1006, Dartmouth, NovaScotia, Canada, B2Y 4A2.
- Blizard, M. M. et al. Harbor Monitor System Final Report, CG-D-17-87, ADA 183 477, Dec. 1986, Available through the National Technical Information Service, Springfield, VA, 22161.
- Blizard, M. M., Lt. and CWO 3 D. C. Slagle. Differential Loran-C System Final litter, Draft, United States Coast Guard, January 1987.
- Blizard, M. M. and D. C. Slagle, “Loran-C West Coast Stability Study,” Proceedings of the Fourteenth Wild Goose Technical Symposium, Wild Goose Association, Bedford, MA, 1985.
- Brogdon, B., “Loran Expansion,” Ocean Navigator, Issue No. 42, SeptfOct 1991, pp. 87, et seq.
- Brogdon, W. “Loran Hook, a Little Known, Foible Explained,” Boating, August 1991, p.42.
- Brogdon, W. “Electronic Errors,” Ocean Navigator, Issue No. 40, June 1991,pp. 70, etseq.
- Brogdon, W. “Pathfinders,” American Hunter, Vol. 19, No. 7, July 1991.
- Burt, W. A., et al. Mathematical Considerations Pertaining to the Accuracy of Position, Location, and Navigation Systems, Part I, Stanford Research Institute, 1966. Available from National Technical Information Service, AD-629609, US Department of Commerce, 5825 Port Royal Road, Springfield, VA 2215 1.
- Canadian Coast Guard, Aids and Waterways Branch. A Primer on Loran-C, Ottowa, Ontario, Canada, 1981.
- Connes, K. The Loran, GPS & NAVICOMM Guide, Butterfield Press, 1990.
- Culver, C. “A New High Performance Loran Receiver,” Proceedings of the Sixteenth Annual Technical Symposium, The Wild Goose Association, 20-27 October 1987, pp. 282, et seq.
- Dahl, B. “Adopting Loran-C to Everyday Navigation,” Cruising World,May 1983,pp. 40-45.