The LNG industry has an excellent safety record. This is due in large part to the combination of industry practice and regulations that are in place to prevent incidents from occurring and to reduce or mitigate the impacts of incidents if they occur. For decades, the LNG industry has also maintained secure operations around the world, including areas where terrorism is a concern. Even so, the safe and environmentally sound operation of the LNG facilities, both ships and terminals, is a concern and responsibility shared by operators. Hazards in handling LNG and natural gas do exist and it is important not to understate or exaggerate them.
- Introduction
- Hazards associated with LNG plants
- Properties of spilled LNG
- Ignition and fires
- Vapor cloud explosions (VCE)
- Cryogenic effects
- Rollover
- Rapid phase transition
- Confined spaces
- Chemical hazards
- Safety features of LNG facilities
- Safety of LNG storage tanks
- Export and import plants: prevention and emergency systems
- Safety of LNG unloading facilities
- Protection features for LNG facilities
- Safety features of LNG trucks
- LNG risk analysis and controls
- Risks to natural gas supply train
- Government oversight
- Codes and standards for LNG onshore (United States, Europe, Japan)
- Technical feedback on codes
- Codes and standards for LNG marine operations
- LNG marine process safety management
- Onshore and offshore plant differences
- Onshore plants, process safety management systems
- Risk analysis tools
- Accident investigation techniques
- Innovative systems under development
- LNG risk analysis examples
- Areas of LNG risk research
- LNG security
- Codes for security
- Security vulnerability analysis (SVA)
- Security vulnerability criticality index
- Deciding on sufficiency of protective measures
- Security of ships and land-based LNG facilities
- Security initiatives, RAMCAP
- Security of offshore and remote LNG facilities
- Policy issues in LNG security
Introduction
This chapter explores hazards associated with and safety features designed for the unusual char-acteristics of LNG. Also summarized here are regulations governing LNG and a wide framework of various risk assessment methods applicable to LNG shipping and export/import terminals, both onshore and offshore. A compilation is included of accident frequencies for LNG carriers per ship year. Examples are provided of risk analysis for specific ports. Innovative applications of risk analysis are treated, along with current research findings. This chapter also discusses the growing concerns over LNG infrastructure security, some factors associated with security, and recent initiatives undertaken to analyze and improve security.
Hazards associated with LNG plants
LNG is a clean fuel and as such is considered environmentally favorable to other fuels. The main hazards handling LNG are fire and explosion, cryogenic freeze burns, embrittlement of metals and plastics, and confined spaces hazards. These are all well understood and can be well mitigated with a careful appreciation of the hazards.
Properties of spilled LNG
LNG is usually stored and transported at near ambient pressures, typically less than 5 psig, in well- insulated containers. Inevitable heat conduction causes liquid evaporation, and removal of the boil- off gas helps maintain the LNG in its liquid state by auto-refrigeration. For large-scale storage, the boil-off gas is compressed and recondensed to limit losses. The density of LNG is about half that of water. If it is spilled on the ground, it will boil rapidly at first and then more slowly as the ground cools. It vaporizes completely, without leaving a residue. If it is spilled on water it will float and vaporize . rapidly since even at water temperatures near freezing, the water is significantly warmer than the spilled LNG. Boiling LNG sets up convection currents in the water, so it will form ice only if the water is very shallow . Temperature sensors are commonly used to detect LNG ground spills, and provide a stronger signal than hydrocarbon gas detectors.
As is typical of flammable liquids, the liquid phase of LNG itself will not burn or explode. It must be vaporized and mixed with air in the flammable range prior to ignition. The flammable region of an LNG vapor cloud (typically between 4 % and 15 % concentration of gas in air) is usually visible as a white cloud of water vapor and ice crystals condensed out of the air by the cold LNG vapor. Vapor comes off the pool initially around -161.7 °C (-259 °F) and consequently is heavier than air. Since the vapor cloud hugs the ground it is more likely to encounter an ignition source such as a vehicle muffler. If not ignited, the vapor cloud spreads due to its negative buoyancy. As the cloud spreads it entrains air and warms toward the ambient air temperature and may cease to be visible. As it warms above about -110 °C (-166 °F), it becomes positively buoyant and “lifts off.”
LNG vapors consist of low-boiling, light hydrocarbons (mainly methane, ethane, propane, with some nitrogen) that are flammable and odorless. Although the vapors are nontoxic, they can be an asphyxiant when they displace oxygen in a confined space.
Ignition and fires
Fire and explosion hazards at LNG facilities may result from leaks and spills, especially during transfers including loading and unloading activities. They also require the presence of ignition sources. Plant designers try to minimize ignition sources such as vehicles, sparks associated with the buildup of static electricity, heat sources such as process furnaces, and lightning but risk assessments can never rule out ignition. If there is no ignition, the LNG will vaporize rapidly, spread, and carry downwind with no injurious effects after diluting below flammable limits.
LNG vapors are difficult to ignite partly because clouds contain condensed humidity from water vapor. Tests have shown that several cloud fires extinguished on their own. Natural gas has an auto-ignition temperature of 540 °C, which is higher than most other fuels (e.g., diesel at 280 °C, premium grade gasoline at 400 °C, propane at 468 °C).
If ignited, LNG presents four potential fire risk scenarios: vapor cloud flash fire, jet fire, pool fire, and vapor cloud explosion.
- Vapor cloud flash fire. By late ignition the entire cloud does not ignite at once. Only the portion of the vapor cloud that has concentrations in the flammable range burns. A transient fire can burn both forward to the cloud front and back to the release point where it produces either a pool fire or a jet fire. Experiments show that LNG flash fires propagate at a relatively slow speed of 10 to 20 m/s. They can also stall if burning into a head wind. It is accepted) that flash fires could result in serious consequences for anyone within the flames, but they pose a low risk for public exposure outside of the cloud’s flammable area;
- Jet fire. An ignited liquid, vapor, or two-phase mixture discharging under pressure through a hole in a container will form a jet fire. A jet fire can cause severe damage but would be confined to a local area. This type of fire is unlikely for an LNG storage tank since the product is not stored under pressure (except for the hydraulic head pressure). At base load import terminals, there is little storage of any pressurized liquids. However, jet fires can occur from pressurized LNG vaporizers or during unloading or transfer operations under pump pressure even after isolation valves close a pressurized line. Livingston et al. (2009) tabulates the typical isolatable segments for an onshore LNG regasification terminal, listing pressures, temperatures, phase state, and volumes. They also tabulate hole size, release duration, and jet flame length consistent with design variables for isolated sections;
- Pool fire. Calculations and experiments agree that a spill of LNG breaks into an aerosol, and air entrained in a vertical spill has only enough heat capacity to partly evaporate the liquid. Thus, an LNG release from the height of a storage tank or transfer pipeline will partly evaporate while falling and the balance “rains out” to form a liquid pool. A pool fire tilts in a wind and a pool fire on land partially wraps around obstacles such as the front of a dike. If the spill occurs inside a properly designed and maintained diked area, the pool fire will remain contained inside and will continue to burn until the fuel is consumed. If the spill occurs outside a confined area, the burning pool fire is free to flow based on topography and the geometry of the spill.
For LNG spills on the sea without ignition, the pool will spread to a steady state pool size where the evaporation rate matches the liquid rainout into the pool. Upon ignition, the feedback of heat from the fire increases the evaporation rate, so the pool shrinks to a smaller steady-state pool size. A steady-state pool fire on water has been found appropriate for calculating long-term exposure contours. For evaluating short-duration exposure to contours of low heat flux (5 to 12.5 kW/m2) the initial maximum unignited pool size is recommended.
The preferred extinguishing agent for small LNG fires is a dry chemical such as potassium bi-carbonate. However, in general, it is often poor strategy to extinguish an LNG fire since the resulting dispersing vapor cloud is more dangerous than a burning pool in an impoundment area.
Spraying water on an LNG pool only increases the vaporization rate and intensifies any fire; spraying a given volume of water onto LNG will vaporize about twice that volume of LNG. High expansion foams are not considered to be effective LNG fire extinguishing agents, but they are effective in controlling LNG pool fires in dikes because the foam blanket reduces the heat generated by the fire radiating back to the LNG pool and thereby reduces the evaporation rate. Foams can prove valuable in vapor control of unignited LNG, and are sometimes automatically activated by temperature sensors in the ground. An experiment by Yun et al. (2010) applied high expansion foam into a concrete pit (6.5 m x 10 m x 1.2 m). They obtained an initial increase in vaporization, then a gradual decrease of the 5 kW/m2 fire radiation contour from 19.7 m to 5.5 m, and a 58 % reduction in flame height.
Experience has shown that a fire impinging upon structural steel takes only a few minutes of exposure to threaten the steel’s integrity. The heat flux associated with large LNG pool fires is about 280 kW/m2 for fires larger than a nearby exposed object, and approximately 85 kW/m2 for pool fires comparable in size to the exposed object. The heat flux from jet fires would be approximately 250 to 300 kW/m2. According to experienced operators, for a typical onshore LNG facility, the time to detect, isolate, and shut down the facility in the event of an unplanned release or leak is typically greater than 15 minutes.
Vapor cloud explosions (VCE)
Pure methane (natural gas) has not been known to generate damaging overpressures if ignited in an unconfined area. Only if the flammable plume is in a confined or congested zone can flame speeds accelerate to form a deflagration type of explosion. A deflagration explosion has flame speeds less than sonic and lasts only within congested zones before flames decay to flash fire flame speed. Even so, a deflagration often has a large impact. A deflagration is a far less damaging explosion than a detonation. A detonation occurs with more reactive gases such as ethylene and burns all the fuel within the flammable range, including fuel outside of congested zones. This is because it perpetuates the com-bustion reaction in the advancing supersonic flame front and does not need the turbulence enhance-ment of obstacles.
Pressurized flammable liquids exposed to an external fire can become superheated. The unwetted metal over the vapor space in a container can become weakened and fail, releasing the liquid that partially flashes to vapor. This flashing vapor expands and ignites as a boiling liquid expanding vapor explosion (BLEVE). LNG is not pressurized (that is the purpose for liquefying the gas) so there is a very low possibility of a BLEVE. It is possible with a faulty design for an LNG truck to have pressure relief valves with setpoint pressures that are too high, allowing a pressurized, heated metal situation to develop in an engulfing fire. This occurred with a tank truck accident in Spain in 2002.
Cryogenic effects
Storage and handling of LNG may expose personnel to contact with very low temperature liquid, vapors, or solid surfaces. The viscosity of cryogenic liquids is low, meaning that they penetrate through porous materials of clothing more quickly than water. Contact with a cryogenic can cause severe damage to the skin and eyes. It can also make ordinary metals, plastics, rubber, and some clothing materials subject to embrittlement and fracture; therefore, cryogenic operations require specialized containers, materials, and protective clothing. Training should always be provided to educate workers regarding the hazards of contact with cryogenic liquid and cold surfaces and the need for personal protective equipment (e.g., gloves, insulated clothing).
LNG containers are manufactured from high quality metals intended for cryogenic storage. LNG carriers and some storage tanks are designed with an inner and outer cryogenic shell that prevents the LNG from coming into contact with the outer hull at ambient temperature. International ship design rules require that areas where cargo tank leakage or spill during unloading might be expected (e.g., ship deck and tank covers) must be designed for contact with cryogenic LNG to prevent brittle facture. Since near the beginning of the LNG trade in 1969 there have been eight marine LNG incidents resulting in spillage with some hull damage due to cold fracture. In an early experience at an export terminal, a valve failed, spraying a worker with LNG.
The brittle transition temperature range for most carbon steels is 200 to 250 °K (-73 to -23 °C or -132 to -42 °F). Experiments have shown that immersion in LNG of 25.4 mm (1 inch) thick pieces of painted steel completely cools the steel to LNG temperatures in less than two minutes. With these high heat transfer fluxes structural steel sections reach nominal failure criteria in as little as one to five seconds. Since cooling rates are so rapid, early leak detection and system isolation have little effect on managing stress hazards in the immediate release area. Thus, cryogenic protection requires appropriate materials of construction and/or adding insulation and shielding.
The cold vapors from the venting of pressure relief valves on an LNG line or tank are a possible source of exposure. Careful location of relief valve vents is needed. Other normal system design practices include using remotely operated isolation valves and a reliable system for gas detection that helps to isolate the source of a release.
Rollover
Storage of large quantities of LNG in tanks has lead to a phenomenon known as rollover. Rollover may occur if LNG stratifies within the storage tank into two layers of different densities over an extended period with inadequate mixing. The upper layer preferentially evaporates lighter components or “weathers” and becomes denser. Heat transfer affects both layers, but the pressure of the hydrostatic head of the upper layer allows the vapor pressure of the lower level to increase. As the density of the upper layer becomes slightly heavier than the lower level, suddenly the upper layer sinks or rolls over, bringing the lower layer to the surface. The lower layer, which has been superheated relative to atmo-spheric pressure, gives offa large amount of vapor. This can result in a rather sudden increase in the tank head pressure and could cause structural damage since pressure relief valves are not sized for rollover.
Two types of conditions typically bring on rollover conditions. The first is fill-induced stratification. This occurs when the added liquid (cargo) is less dense than the liquid in the tank (the heel), and is added through a top fill line, or, conversely, when cargo denser than the heel is added through a bottom fill line. The second is nitrogen-induced. Liquid nitrogen is the most volatile component of LNG and when it is present at greater than 1 % it boils off preferentially and leads to an increase in the bubble point temperature of the mixture and a reduction in the density of the top layer, hence to stratification. In contrast, when methane is the most volatile component (of a non-LNG mixture), its loss leads to a slight increase in saturation temperature without a significant change in the liquid density.
Rollover could occur on LNG carriers docked for extended periods, but ullage costs make extended stays unlikely. Rollover is not a problem for carriers at sea because of mixing by sea motion.
Recommended measures to prevent rollover include the following:
- Monitor LNG storage tanks for pressure, density, and temperature all along the liquid column;
- Maintain sufficient mixing. If necessary, recirculate the LNG in within the tank;
- Install multiple loading points at different tank levels to allow for the distribution of LNG with different densities within the tank to prevent stratification.
These measures have become common in the industry, and rollover is no longer considered credible in a well-managed facility.
Rapid phase transition
Some LNG spills on water have involved a nearly simultaneous transition from the liquid to vapor phase with an associated rapid pressure increase. The rapid phase transition (RPT) energy comes from a physical phase change and is much less than the energy available from a chemical combustion reaction. One set of investigators claim it is more likely to occur when the LNG contains high concentrations of the heavy hydrocarbons (C2 to C4 components), or after a time delay allowing the lighter methane to boil off leaving a heavier liquid with higher concentrations of those components. It may result in two effects: a localized overpressure resulting from rapid phase change, and enhanced dispersion as LNG is rapidly vaporized and expelled to the atmosphere. No known incidents of RPT have occurred in commercial transportation or handling of LNG, but experimentation has shown that potential for them to occur does exist. Attempts to model the energy of an RPT have been made for LNG and for events involving molten metal and water, for which there is a history of large damaging events. The history of LNG RPT events is also treated.
The ignition of an LNG vapor cloud during the Falcon test series in the late 1990s that destroyed the test apparatus has generated a concern that an RPT could be responsible for ignitions.
Confined spaces
As in any other industry sector, confined space hazards are potentially fatal to workers. Confined spaces may include storage tanks, secondary containment areas, and stormwater/wastewater man-agement infrastructure. Facilities should develop and implement confined space entry procedures as described in general EHS (Environmental, Health, and Safety) guidelines. Gas detection devices should also be used to authorize entry and to monitor operations into enclosed spaces.
Vapor leaks have also occurred along unexpected confined spaces. The Cove Point, MD LNG terminal experienced an explosion from vapors that flowed through 200 ft of electrical conduit. This event resulted in three major changes to the National Fire code.
Chemical hazards
Common to any processing plant, the design of the onshore LNG facilities should reduce exposure of personnel to fuels and products containing hazardous chemical substances. Use of substances and products classified as very toxic, carcinogenic, allergenic, mutagenic, teratogenic, or strongly corrosive should be identified and substituted by less hazardous alternatives, wherever possible. For each chemical used, a Material Safety Data Sheet (MSDS) should be available and readily accessible at the facility. A general hierarchical approach to the prevention of impacts from chemical hazards is pro-vided in the General EHS Guidelines.
Safety features of LNG facilities
Safety features of LNG facilities are an inherent part of each design. Only a brief overview can be provided here.
The broad categories of safety features at LNG facilities are (1) primary containment, (2) secondary containment, (3) plant safety systems, and (4) separation distance.
Safety of LNG storage tanks
Nearly all modern LNG tanks have double walls. Primary containment requires materials designed, tested, and selected for cryogenic service. Designs for removal of boil-off vapors, to prevent the ingress of air, to prevent frost heave, and to withstand a number of filling, emptying cycles and cooldown and warming operations are planned for the design life of tanks.
Secondary containment is effectively a second tank surrounding the onshore LNG storage tank. The secondary tank is designed for a capacity exceeding the volume of the primary container. An insulation system surrounds the inner wall, which contains the cryogenic liquid. The tanks are constructed of metals or alloys with low coefficients of thermal expansion that do not embrittle when in contact with cryogenic fluids (i.e., aluminium or 9 % nickel steel). Internal pumps are used to pump out LNG. There are no bottom connections to leak or fail. Embankments, berms, bunds, or dikes surround the tanks and are scaled, in modern facilities, as a precaution to contain leakage up to 110 % of the tank capacity.
Additional devices include:
- Cooldown temperature sensors on the storage tanks and base;
- Leak detection in the annular space on tanks, e.g., low temperature alarms;
- LNG tank gauging that provides remote readings, with high/low level alarms and shutdown systems;
- Combined temperature and density sensors to detect rollover potential.
Explosion risk is minimized by storing LNG slightly above atmospheric pressure so that air cannot inadvertently leak into a tank, except by the opening of vacuum breaker valves. If LNG does however escape from a tank or is spilled during transfer it will mix with air and either ignite, forming a pool fire, or will rapidly vaporize, leaving no residue.
Some tanks are underground. In-ground LNG storage tanks are accredited with the European standard ENb1473 as the safest way to store LNG. They also have the highest degree of security and some environmental benefits. Even in the event of the concrete roof being destroyed by a projectile in a terrorist attack, since LNG is stored below the ground surface the LNG would not leak onto the ground. In an earthquake, the seismic motion is not amplified for in-ground storage tanks in contrast to above-ground structures, thus making them safer in earthquake-prone regions. A potential remains for a leak from an earthquake, but this is likely self-sealing by freezing surrounding ground water. Ground water can pose problems such as generating buoyant forces.
Export and import plants: prevention and emergency systems
Plant safety systems are designed with two types of layers of protection:
- A Prevention System that prevents Loss of Containment (LOC), such as pressure relief valves;
- An Emergency System that mitigates loss after LOC, such as an Emergency Depressuring System (EDS), an Emergency Shutdown System (ESD) and a fire protection system that automatically activates fire suppressants.
ESD systems are required by the US codes NFPA-59A. By European codes prEN1473 4.5.6 EDS systems are optional.
Computerized Emergency Systems, among other automatic systems, are designated as Safety Instrumented Systems (SIS). An SIS is commonly designed to a Safety Integrity Level (SIL) by specific criteria for their design. The principles for conducting an SIL study are given by ISA-TR84.00.02 (2002), and supplemented by several International Electrotechnical Commission (IEC) documents including IEC-61508/61511.
The order of work is:
- Establish acceptable risk for the plant (see Section 9.4.10);
- Work back to find the reliability of the Safety Instrumented System (SIS) needed to meet the plant risk criteria;
- Use the IEC methodology with process hazard and risk assessment studies to design the Safety Instrumented Functions (SIF) needed to achieve the required safety standards.
Table 1 defines the SIL levels by the required reliability of a SIS that is calculated by the Probability of Failure on Demand (PFD) of SIS components.
The order of magnitude increases in SIL going from one level to the next implying considerable effort to achieve. Measures are required such as increased inspection and test frequency, higher quality system components, and instrument redundancy.
Safety of LNG unloading facilities
Standard practices have been adopted worldwide to prevent leaks and their escalation, including:
- Compliance with national and internationally accepted codes and standards, as well as company guidelines, for siting, designing terminals, inspection, and maintenance;
- Siting new terminals a safe distance from adjacent populations based on risk assessments;
- Use of materials and systems designed to safely insulate and store LNG;
- Impoundment areas; spills are contained in these areas to control spread and vaporization rate, as well as to minimize pool fire consequences;
- Vapor reduction systems; foam generators reduce the rate of vapor formation and movement;
- The LNG unloading process systems incorporate monitoring and control devices to detect deviation from acceptable parameters, facilitating corrective actions;
- Specifically, Powered Emergency Release Couplings (PERC) on unloading lines have shutdown triggered by several signals (e.g., gas detection, low temperature, fire);
- Overpressure protection (pressure controllers and relief valves);
- Leak detection and spill control using temperature and gas detection probes;
- Ignition source control;
- UV/IR fire detectors and combustible vapors detection systems;
- Closed-circuit TV monitoring;
- Fire zoning;
- Automatic emergency shutdown and depressurization systems and isolation valves;
- Passive fire protection (fireproofing, barriers, and coatings);
- Active fire protection (firefighters, preinstalled monitors, etc.);
- Emergency release couplings on unloading lines;
- Trained operators are always present; their response includes making emergency notifications to responders and broadcasts to the community;
- Emergency shutdown buttons are at the pier, the control room, on board the LNG ship, and at field locations; this shutdown generally shuts off all pumps and closes off all piping so that the LNG stays either on the ship or in the storage tank;
- Using manufacturer’s service engineers for all vital machineries and systems;
- Preemployment crew security screening, medical tests, training, and licensing;
- Safety and operational inspection/audits of crews and ship managers are done with every arrival, annually by ship managers, and every 2.5 years by external inspectors during scheduled dry dock and maintenance;
- The Home Doctor concept (a designated shipyard) includes standard specifications and pricing as part of a Master Maintenance plan for all vital machinery and systems.
Protection features for LNG facilities
Some normal plant protection practices are modified for LNG applications, as discussed next.
Diking and sloping
Even if pooled LNG does not ignite, the bases of columns and equipment supports could fail by cryogenic exposure. Two principles applied to LNG plants are sloping and using insulating concrete. These minimize the area of an LNG pool and reduce heat conduction from the substrate. Sloped and paved troughs are under all LNG lines, draining to impoundment basins.
When designing LNG spill containment systems, it is necessary to consider the film boiling or Leidenfrost effect that leads to a vapor layer under boiling LNG. Flowing on a vapor layer reduces friction and produces higher liquid velocities when compared to flowing water. In turn, higher velocities could cause splashing around obstructions, through turns, and at changes in elevation. Structural supports within the curbing and drainage paths should be on a concrete base that prevents the exposure of steel to pooling, splashing, or draining liquid.
Coatings and insulation
A primary difficulty in designing for LNG release scenarios is that there could be a release that results in a cryogenic exposure, a fire exposure (jet or pool), or a combination of events. No industry standard tests have yet been developed for cryogenic exposure followed by fire exposure.
Read also: Environmental aspects in Liquefied Natural Gas production
Standard fire-approved cementitious insulation provides economical protection of structural steel against fires and also against short-term cryogenic exposure. Unfortunately, not all potential insulation products have been tested for both types of exposure.
Intumescent and subliming coatings expand upon exposure to fire. These coatings have also been tested and found, in conjunction with a cryogenic insulating coating, to provide good protection from either cryogenic or jet fire exposure. They are more expensive to apply than cementitious insulation.
Instrument and electrical cabling
Protection of instrument and electrical cabling is not normally done because these systems are designed to be fail-safe. However, direct exposure from cryogenic spray to shutdown/blowdown valves or actuators could fail the isolation or deinventory process.
Cloud effect
An LNG spill could generate a large fog cloud that can impair employees’ visual response. They may not be able to see where the LNG is pooled. Based on this, employees need more than one route to temporary refuge no matter what the wind direction or where an incident may occur.
Safety features of LNG trucks
LNG tank trucks have safety devices to prevent overfilling and overpressurization, as well as safety systems to prevent the LNG road tanker from driving away while still connected to the loading facilities. Pressure-relief setpoints should be set to the lowest practical value to reduce BLEVE potential. LNG road tankers must comply with country-specific codes for design and operation.
LNG risk analysis and controls
The safe processing, storage, and transportation of LNG is an essential condition for the continued existence, growth, and sustenance of the entire industry. Both marine transport and onshore LNG plants and transportation follow two basic paths for safe operations:
- All applicable codes and standards should be met with rigor (even voluntary ones);
- Each operation must establish their own Process Safety Management (PSM) system. The objectives are usually to establish and follow best industry practices, to use innovative measures, and to obtain the best risk/reward ratio for their safety budgets.
Risk is usually defined by consequence and probability or frequency. Mitigation measures can address either the reduction of consequences, the reduction of frequency, or both.
Risks to natural gas supply train
Table 2 lists a broad range of risk issues that can affect parts of the natural gas supply train. The risk assessment methods discussed subsequently have been applied to only some of the listed risks.
Risk assessments have various objectives such as (1) set insurance coverage, (2) justify risk mitigation measures, (3) develop contingency plans, and (4) make arrangements to provide coverage for business interruption or missed LNG cargos.
Government oversight
The construction of an LNG receiving terminal is subjected to a considerable number of design standards, local regulations, and national regulations, a complete discussion of which is beyond the scope of this book. Mainly the European and American standards are widely used throughout the world.
The LNG industry adheres to an international network of codes and standards that specify safe materials, designs, and generally approved technologies for import terminals. This network promotes sharing state-of-the-art technologies and research. An international work group, TC67 Work Group 10: “Standardization for Installations and Equipment for LNG, Excluding Product for Testing” was formed in 2006 under the International Organization for Standardization (ISO) organization. The group’s objective is Questions and answers to Crew Evaluation System Test about Cargo Compatibility, Cargo Groups and Compatibility Chartcompatibility and harmonization of LNG codes among countries. Another international trade association, Society of International Gas Tanker and Terminal Operators (SIGTTO), compiled a single publication that summarizes best practices in the LNG industry.
The US government oversight of LNG facilities is provided by three federal agencies under an Interagency Agreement.
- The Federal Energy Regulatory Commission (FERC) grants approval for new onshore facilities and is the lead agency for review of environmental and safety concerns, including public comment meetings. Every two years, FERC staffs inspect LNG facilities to monitor the condition of the physical plant and inspect changes from the originally approved facility design or operations;
- The US Department of Homeland Security (DHS) exercises regulatory authority over LNG facilities that affect the safety of ports and navigable waterways. A key law governing the marine portion of an LNG terminal in the United States is 33 CFR Part 127, Waterfront Facilities Handling Fundamentals of Liquefied Natural GasLiquefied Natural Gas and Liquefied Hazardous Gas. The USCG also establishes criteria for evaluating a proposed deepwater port. Terminals operate under site-specific USCG Operating Plans (OPLANS) that require prearrival boarding and inspection of ship certificates, crew licenses, safety equipment, ship condition, ship’s log, and procedures;
- The US Department of Transportation (DOT) and specifically the Pipeline and Hazardous Materials Safety Administration (PHMSA) promulgates and enforces safety regulations and standards for transportation and storage of LNG for interstate and foreign commerce under the pipeline safety laws. PHMSA regulations are contained in US Federal Law 49 CFR Part 193 and cite NFPA standards. The Maritime Administration (MARAD), also within DOT, has licensing authority for the construction and operation of deepwater ports, including offshore (floating) import terminals;
- Under several Memorandums of Understanding (MOU), it is agreed that OSHA 1910 and EPA Risk Management Planning (RMP) obligations do not apply to LNG import, export, or peak shaving plants.
Codes and standards for LNG onshore (United States, Europe, Japan)
The European code EN1473 “Installation and Equipment for LNG Design on Onshore Installations” is risk-based, meaning focused on outcomes rather than specific ways to achieve a desired level of safety. The European Council Directive 96/82/EC (SEVESO II) aims at the prevention of major accidents involving dangerous substances, including LNG. The provisions in the Directive were developed following a review analyzing major accidents since the implementation of the SEVESO I directive. Failures of management systems were found to have contributed to the cause of over 85% of the accidents. Additional codes for all modifications of “Installation and Equipment for LNG” include EN 1160, EN1474, EN 1532, and EN 13645.
Canada requires compliance with US and European standards. In addition Canadian standard CSA Z276-01 requires underground unloading lines at import terminals, encased in a concrete caisson with a nitrogen inert atmosphere. Exclusion zones are set for:
- A 500 m radius around unloading arms at the head of a jetty;
- A 100 m radius around the impoundment basin of onshore facilities;
- A 400 m radius around LNG tanks and process facilities.
In Japan, LNG terminal siting and operation is regulated by the Ministry of Economy, Trade, and Industry (METI), which enforces the Gas Utility Industry Law, the Electric Utility Industry Law, and the High Pressure Gas Regulation Law. Gas utility companies must:
- Maintain a facility in accordance with a technical standard;
- Define, submit, and observe their companies’ own security standards in order to ensure safe construction, maintenance, and operation of gas facilities;
- Assign a licensed engineer to ensure the safety of construction, maintenance, and operation of a gas facility;
For regulations in China, Korea, India, and Taiwan and a description of industry associations in the LNG industry, see GIIGNL.
Table 3 lists the US and European codes directed specifically to LNG facilities.
Technical feedback on codes
For LNG receiving terminals the governing US Federal Law 49 CFR Part 193 refers to sections of the National Fire Protection Association design standard NFPA 59A “Standard for the Production, Storage, and Handling of Liquefied Natural Gas.” Uniquely, the US standards requires each LNG terminal, tank, and process area to have a thermal exclusion zone and a vapor exclusion zone within the owner’s control. The thermal exclusion zone is the area with a fire flux of or below 5 kW/m2 for exposure to the public. In addition, a 37.5 kW/m2 threshold is set for the integrity of exposed structures. The vapor dispersion exclusion zone is the area within the contour to half LFL (lower flammable limit). The criteria for these exclusions zones have been the subject of technical criticism such as:
- The criteria do not take sufficiently into account more vulnerable individuals;
- Some of the concepts of Process Safety Management (PSM) described by the American Institute of Chemical Engineers (AIChE) and the Occupational Safety and Health Administration (OSHA) PSM regulation in 29 CFR 1910.119 should be included in codes;
- The effects of air dilution and wind “scooping” of LNG vapors from impoundment basins should be accounted for in modeling the distance to half LFL for vapor dispersion exclusion zones;
- Apply vapor dispersion zones for a docked LNG carrier;
- Use the LFL instead of half LFL as the flammable vapor end point. This is disputed by Ivings and Webber (2007);
- Develop a procedure that permits more advanced consequence models to be used in addition to the DEGADIS, FEM3A, and LNGFIRE3 models, originally the only ones accepted by the DOT and FERC. The last point has been addressed, and PHMSA has approved additional models under the Model Evaluation Protocol (MEP) that was incorporated into the 2009 edition of NFPA59. Kohout (2012) provides a recent review of the application of the PHMSA protocol and of dispersion models for LNG siting applications.
The subject of wind “scooping” of LNG vapors from an impoundment basin was tested experimentally and modeled by Chan (1992). Figure 1 illustrates how Chan’s modeling predicts that the vapors overflow a structure similar to an impoundment zone. This test (Falcon 1) was conducted under stable atmospheric conditions at low wind speeds, and was notable for superheating the vapors by prolonged contact with the water in the walled-in area. Vapors at various dilution overflow the dike walls and do not gradually fill the confined volume before flowing over like a liquid would do.
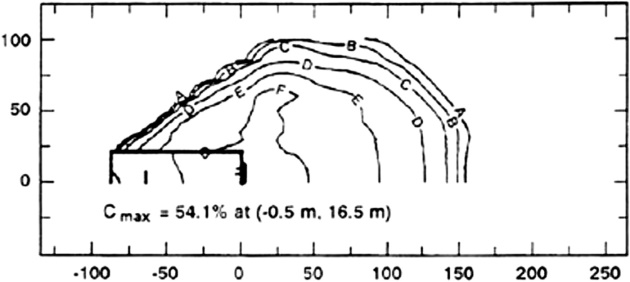
A = 0.5, B = 1, C = 2, D = 5, E = 10, F = 15, G = 25, H = 35, I = 50
Gavelli (2010) also modeled the scooping effect of LNG vapors over an impoundment sump using the CFD model FLACS. Upon varying the wind speed he found that the plume length to the LFL does not increase with wind speed. That is, while the “vapor scooping” increases with wind speed, turbulent mixing also increases at a faster rate, so the net effect is a reduction in vapor dispersion hazard distances.
Codes and standards for LNG marine operations
LNG ships must comply with all relevant local and international regulations including those of the International Maritime Organization, International Gas Carriers Code, and the US Coast Guard (USCG). Insurance companies “classify” the vessel designs and verify vessel integrity.
The regional Captain of the Port USCG marine safety unit reviews LNG ship management pro-cedures and emergency plans. These procedures include requirements for prearrival notification, harbor transit, docking operations, cargo transfer, inspection, monitoring, and emergency procedures. Companies involved in LNG shipping work with the local Pilotage Authority and the USCG to develop optimum plans for safe transit in and out of port. This coordination helps manage port shipping traffic, similar to air traffic controllers, with the aim of protecting against collisions while facilitating movement of other traffic. If warranted, the USCG can assign sea marshals to escort LNG ships as they transit in and out of US ports to provide for harbor safety and security.
International regulation for the training of seafarers is covered by an International Maritime Organization (IMO) convention known as the Standards of Training, Certification and Watchkeeping (STCW) 1995, which has specific requirements for operations on gas carriers.
The IMO has established international Collision Regulations for ship navigation, which apply to all vessels in coastal and international trade. Like all modern oil tankers, sophisticated radar and positioning systems alert the crew to other traffic and hazards around the ship. Distress systems and beacons automatically send out signals if the ship is in difficulty. Ships also employ antipiracy and boarding measures, and must comply with the requirements of the International Ship and Port Security code. This has requirements for tugs and pilots. While at sea, the cargo control room is manned continuously when cargo is being transferred to and from the ship. Additionally, the ships are equipped with automatic identification systems that will allow ship tracking and monitoring while travelling on navigable waters.
Prior to any LNG transfer commencing, the ship and terminal staff meet to ensure all aspects of safety. Regulations require facility and vessel security officers to be present. At the discretion of the USCG, USCG personnel are available to monitor the waterway, the ship, and the facility.
LNG marine process safety management
LNG facilities and ships are viewed in the industry as the “top of the line”. LNG ships have operated worldwide for more than 45 years without major accidents or safety problems either in port or at sea. However, the current active fleet of LNG vessels is aging, with many built in the 1970s, operating with steam drives. An example of new issues involves a 138,000 m3 LNG carrier delivered in June 2004. It had a problem with leakage of nitrogen injected into the interbarrier space of the membrane system for monitoring and inerting purposes. The delivery of an LNG carrier was delayed 18 months because of such permeation problems.
LNG ship design features
Currently there are two main ship types: single-wall self-supporting spheres (Moss spheres) and a dual membrane design by Gaz Transport or TechniGaz (GTT). The spherical tanks in the Moss design are usually constructed of aluminium with 49 to 57 mm thickness. The sphere maintains its own structural integrity and the cargo load is transferred to the vessel through a continuous metal skirt attached to the equator of the sphere. The hull is a double hull and some vessels have an additional wall surrounding the spheres. The spheres are, on average, much further separated from the external environment than the tanks of a membrane-type LNG carrier.
The dual membrane design consists of thin stainless steel or high nickel steel membranes 0.7 to 1.2 mm thick, capable of containing the hydrostatic load of LNG but rely on the vessel structure to provide structural support. There is at least 2 m and often 3 to 4 m between the outer hull and the cargo. If a grounding or collision produced damage to the hull and secondary liquid barrier the design of the primary barrier would prevent leakage. Similarly if the primary barrier fails LNG is contained by the secondary liquid barrier and the outer hull, which is also insulated. The design prevents leakage of cryogenic liquid onto unprotected steel or other materials not designed for cryogenics. The insulation spaces are continuously monitored by sensors for any sign of leakage.
Carriers of both types have LNG capacity of more than 135,000 m3. Vanem et al. (2008) reported that the LNG fleet consisted of 50 % membrane, 40 % Moss spheres, and 5 % other types. The average size carrier in 2008 was 120,000 m3 and the average size on order books was 156,000 m3. The size of LNG carriers is increasing, recently by the design of the Q-Max type (capacities to 250,000 m3). Even so, a recent risk analysis for the Rabaska Project found that with the larger ships the risk levels would not change much because the visit rate decreases, decreasing the frequency of potential accidents. Furthermore, the size increase in membrane-type LNG tankers is due to their larger width and number of tanks, and the liquid full level above water is only 0.2 m higher with the new Q-Max carrier. The liquid height turns out to be a main parameter in calculating consequences for various breach sizes.
Many of the features described in Section 9.3.3 for onshore tanks apply to LNG ships, and include extensive cargo safety systems. LNG in transit is maintained at near atmospheric pressure (< 5 psig) in insulated tanks (each ship usually has 4 to 6 separate tanks). Pressures, levels, and temperatures are monitored automatically. Deviations from predetermined limits sound alarms and require actions to assure safety. The cargo transfer system cannot be operated if all cargo-related safety systems are not fully functioning. Submerged internal pumps are used to pump out LNG. There are no bottom con-nections to leak or fail. A large coffer dam separates each LNG membrane tank, reducing the potential for an event in one tank to affect its neighbor.
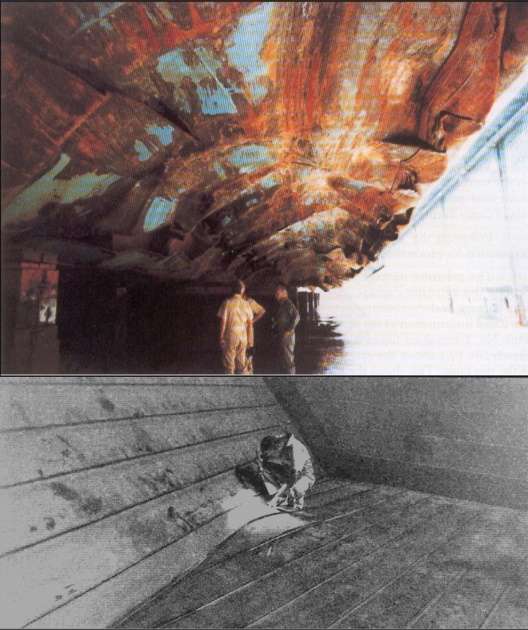
These vessels are designed to withstand the impact of both collision and grounding without damage to the containment system. The double-hull design proved successful in the grounding at 19 knots on June 29, 1979 of the 125,000 m3 El Paso Paul Kaiser on rocks near Gibraltar. Figure 2 shows considerable denting of the outside hull, and minor denting inside the LNG compartment. There was no penetration of the compartment or loss of cargo.
Risks to LNG carriers
Wang (2012) writing from experience from service in a marine and offshore surveying company compiled a list of risks that can occur to LNG carriers. A sample of this list is provided in Table 4.
Vanem et al. (2008) compiled the number of accidents for the first eight categories that are also on Wang’s list (e.g., 19 collisions). They also tabulated ship years of experience, and calculated accident frequency per ship year (e.g., 6.7 x 10⁻³). The accident rate for LNG carriers was found to be slightly lower than that for LPG tankers, oil tankers, chemical tankers, and bulk carriers. Being aware of the possible risks is the first step in protecting against them.
Analyzing potential hole sizes in LNG carriers
Risk analysis studies of LNG carriers have postulated arbitrary hole sizes from ship collisions, typically in the range of 0.75 to 5.0 m diameter. The European Union (EU) sponsored a research project known as HARDER to establish design criteria for ship stability for vessels involved in collisions. This study accumulated data from almost 3 000 collision cases to establish probabilistic actual hole sizes for a wide range of scenarios: different vessel sizes, speeds, angle of approach, and striking bow shapes. Paik et al. (2001) identified critical speeds for the collision of two LNG carriers of 6.6 to 7.4 knots leading to tank spills and for VLCCs (Very Large Cargo Carriers) onto LNG carriers of 1.7 to 7.7 knots for light and heavy collision loadings, respectively. A complicating factor is that many collisions will leave the vessels connected, so the effective hole size is not the entire damaged area measured later in the repair dock.
Pitblado et al. (2008) extended this analysis to consider a wider range of striking vessels (90, 140, and 230 m long) at 45o to 90o angles to both membrane and Moss sphere carriers. The ABAQUS finite element (FEM) code was used to obtain predictions of bow intrusion such as is illustrated in Figure 3. In this work, two colliding bow profiles (bulbous and raked) were forced into LNG vessels to determine the energy required for different resultant hole dimensions. Figure 3 illustrates the finding that while the LNG vessels are very strong, when sufficient energy exists to penetrate a hull and all the structural elements, there is little residual resistance offered by the tank to differentiate a small hole from a large one. This paper recommended a planning approach based on risk principles, rather than nominating a specific hole size, which may be too pessimistic or too optimistic. However, the paper suggested 750 mm as a maximum credible hole size for an operational accident.

The breach sizes selected for the Rabaska project, based on past events and upon discussion with experts were 250 mm for a tank puncture, 750 mm for a collision or grounding accident, and 1.5 m for an intentional act. In previous studies, Sandia National Laboratories used 1.1 and 1.6 m for accidental breaches and 2.5 m for an intentional breach. A study done by the ABS Consulting Inc. (2004) for the Federal Energy Regulatory Commission (FERC) used 1 m breach for long-lasting leaks and 5 m to obtain shorter-lasting peaks, specifically not attributing causes for these sizes or accounting for their probability. The subject of breach sizes is still unsettled.
Location of LNG tanker penetration
Analysts have defined three categories of postulated LNG spills from carriers as shown in Figure 4.
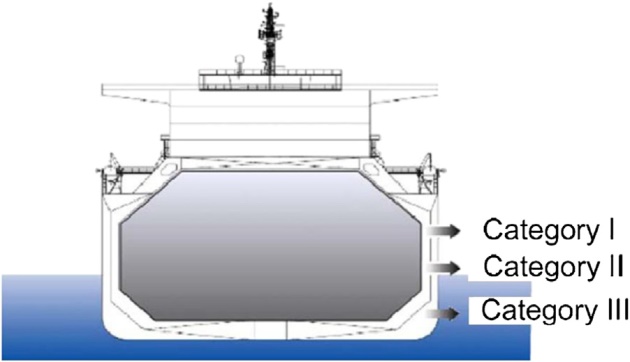
The types are basically Category I (above the water level), Category II (at the water level), and Category III (below the water level).
Category I, above water penetrations of membrane carriers
For penetrations of LNG carriers above the water level (Category I), the potential leak of LNG is obviously limited. High penetrations, just under the LNG level, do not have enough hydraulic head pressure to develop a jet that shoots beyond the double hull gap. With lower penetrations, still well above water level, the jet can shoot the double hull gap and spill into the sea. These plumes will partially evaporate before reaching the sea, and then penetrate into the sea water. Such penetrations into the water will consequently mix with water and rapidly evaporate, become buoyant, and “geyser” back upward.
This type of geyser behavior was observed from a release of LNG underwater as reported by Qi et al. (2011). The resulting visible plumes of condensed water vapor and partially evaporated LNG are shown in Figure 5 for (A) the initial plume, and (B) a later plume. The motivation for the tests was to find the effects of a leak of LNG from a pipe laid under a body of water. The LNG was released upward at a depth of 0.71 m of water. The LNG developed liquid droplets that were buoyant and rapidly evaporating as they rose upward. Part of the liquid remained unevaporated as the plume carried them upward from the surface of the water. No liquid pooled on the water surface. Figure 5 (B) shows that the visible plume was warmed sufficiently by the mixing with water to be clearly buoyant. This was confirmed by temperature and concentration measurements.
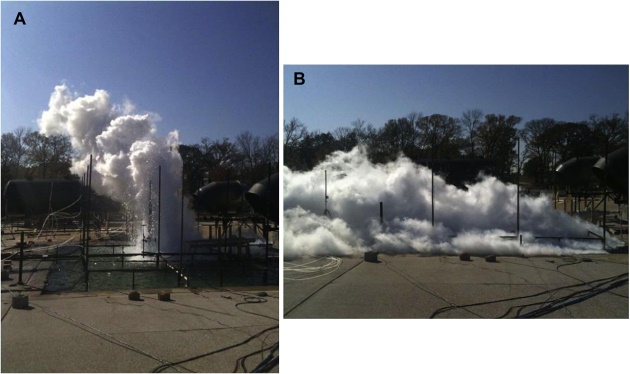
(A) Initial plume; (B) Later plume
The mechanisms of a penetrating above-water release are expected to be similar to that of an underwater release of LNG as illustrated in Figure 6.
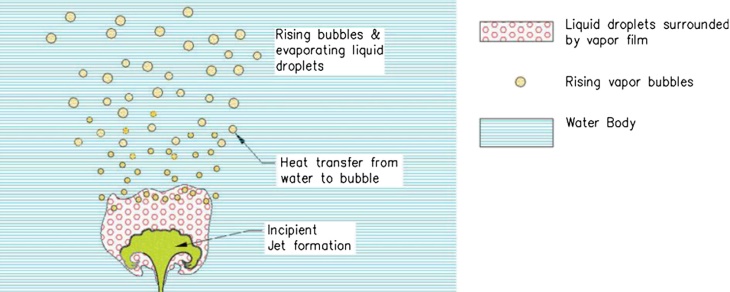
These are modeled by Raj and Bowdoin (2010). The LNG first forms an umbrella shape, evaporates and breaks into drops of liquid, and then both liquid and vapor rise through the water where they experience rapid heat transfer from the water.
Category III, underwater penetration of membrane carriers
Less obvious, is that underwater penetrations of double-hull LNG ships are likely to result in very limited LNG loss.
Underwater penetration of the outer hull only would produce a build-up of pressure in the double hull space as water inflow compresses the air space. This is shown by Woodward (2008) to produce an intermediate condition of pressure equilibrium between the water pressure at the breach and the air pressure within the hull. Figure 7 illustrates a 0.5 m diameter hole at four water depths (white circles). The dark bars on the left indicate that this intermediate pseudo-equilibrium point occurs with increasing water depth as the hole occurs deeper beneath the sea level. After this intermediate pressure equilibrium point, water inflow continues at constant pressure by a mechanism of equal volume exchange of water and air, giving essentially constant water flow rate until a final water level is reached at or above the top of the breach. This final level is indicated by the right-hand bar drawn behind the white circles.

The predicted ideal behavior of water inflow to a double hull membrane carrier from an underwater penetration is illustrated in Figure 8. This is for a 0.15 m diameter hole topped at 1 m water depth. The initial inflow rate drops off rapidly as compression builds the hull pressure and reduces flow. A period of constant flow rate by equal volume exchange follows, allowing the water level in the hull space to rise to just above the hole.
The increase of pressure in the hull space is further enhanced if the inner hull is also penetrated, and the evaporating LNG further increases the hull pressure, inhibiting the leak rate of LNG. This is predicted to have a strong mitigating effect making double hull release rates much lower than those of single hulled vessels.
Category II, penetration of membrane carriers at water level
Category II LNG spills, at the water level, must realistically be considered as falling partially below the water level. Thus, both seawater and LNG flow into the double hull area at first, until the double hull below the breach is filled. Depending on the relative size of the breach in the outer hull to the inner hull, any serious breach of the inner hull will leak enough LNG to freeze the water in the hull space. With high mixing of water and LNG there may also be complicating RPTs that could even be damaging. The complications of this situation are, as a first-pass approximation, ignored and analyses of Category II spills consider only the LNG leaking over the filled double hull and into the sea.
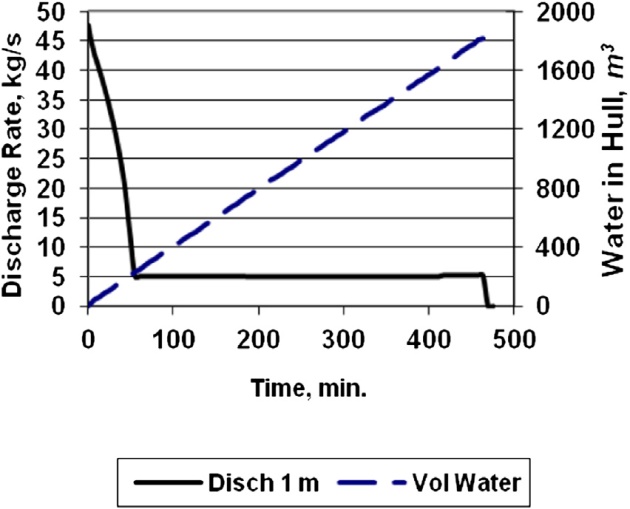
For a Category II release, the problem is inherently dynamic, since the discharge rate increases and the duration decreases as hole size increases. In addition, the discharge rate decreases over time as the liquid level in the LNG tank drops. Woodward (2007) coupled the dynamics of a decreasing discharge rate (blow down) with a pool spread and evaporation model. As shown in Figure 9, this method predicts that a pool from a 1 m hole rapidly reaches an equilibrium where pool evaporation equals discharge rate, labeled a “steady-state” curve.
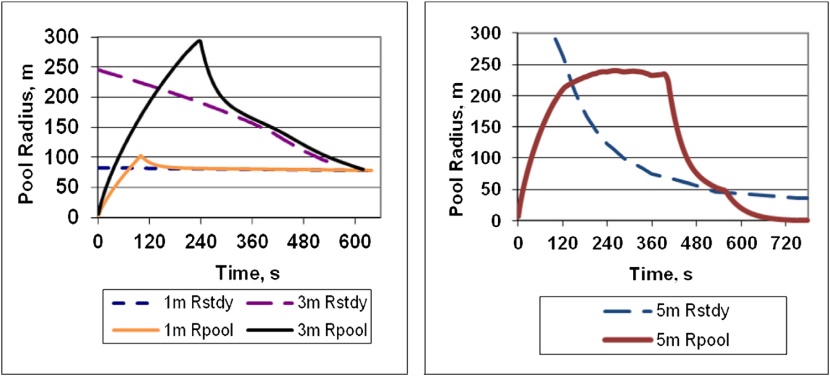
A 3 m hole would produce the largest pool extent, reaching a peak value just under 300 m only briefly and then dropping down to the equilibrium or steady-state curve. The predicted pool radius from a 5 m hole rises quickly and then flattens to a broader peak just under 250 m because the discharge rate drops more quickly. After the discharge from the tank stops, the pool radius drops so rapidly that the pool radius curve does not follow the equilibrium “steady-state” curve.
Steady-state predictions for hazard distances from LNG spills
With the understanding from Figure 9 that maximum pool sizes may remain only very briefly, next consider predictions using the equilibrium or steady-state pool assumption (pool area such that evaporation or burn rate equals initial discharge rate).
To obtain a feel for the expected scale of the hazards from a large LNG spill on water, two scenarios are evaluated, a pool with immediate ignition and a pool with no ignition. For the first of these scenarios, the analysis finds radiation contours from a pool fire to thermal flux levels of 37.5 kW/m2 and 5 kW/m2, commonly recognized for defining hazard distances for fires. The 37.5 kW/m2 is a level suggesting severe structural damage and major injuries if continued for over 10 min. The 5 kW/m2 level found to produce second-degree burns on bare skin exposed for over 20 sec, and is proposed as the protection standard for people in open spaces.
Several studies have developed hazard distances for Category 2 LNG breaches, both ignited and unignited, as summarized in Woodward and Pitblado (2010). The Sandia guidance report evaluates ignited and unignited scenarios for currently standard membrane LNG vessels holding 125,000 to 140,000 m3 of LNG. The loss for a single tank out of the four to six tanks in a membrane carrier would be about 12,500 m3. Qiao et al. (2006) investigated the influence of geometric difference between membrane and Moss spherical tanks on the LNG release rate and blow down, but did not carry out any further consequence analysis.
Table 5 summarizes predicted distances for pool fires as a function of the size of penetration of the inner hull. The assumptions for Table 5 are:
- LNG composition = 100% methane (density at boiling point = 422.5 kg/m3);
- Discharge coefficient = 0.6;
- Burn rate = 0.30 mm/s ( 0.127 kg/m2 s);
- Surface emissive power = 220 kW/m2;
- Pool at steady-state (burn rate = initial discharge rate);
- Burn time = discharge time at initial discharge rate;
- Pool shape = semicircle.
By comparison, a study by the Major Industrial Accidents Council of Canada found for a 750 mm breach (0.44 m2) with very similar assumptions, radiation contours to 5 kW/m2 range from 450 m to 480 m, consistent with Table 5 values.
For the second scenario, an unignited (or delayed ignition) pool, the dispersion hazard distance is the longest length of a (transient) flash fire. This is taken as the distance to the lower flammability limit (LFL), the lowest concentration at which LNG will burn.
Table 6 summarizes these distances from the Sandia report for stable atmospheric conditions at low wind speed. Example spills from larger vessels are given in later Sandia reports.
A study by Oka (2009, 2010) uses the same models as the Sandia report, and provides more detail of predictions as a function of hole size. Oka (2010) extends an earlier treatment to the larger Q-Max carriers, using the assumptions summarized in Table 7.
Oka’s modeling assumptions are:
- Category II breach centered at the water line;
- LNG composition = 100 % methane (density at boiling point = 422.5 kg/m3);
- Discharge coefficient, CD = 0.65;
- Burn rate = 0.668 mm/s ( 0.282 kg/m2 s);
- Evaporation flux (not burning) = 0.17 kg/m2 s;
- Surface emissive power = 265 kW/m2;
- Friction effects included in pool spread mode = yes;
- Flame model = two-zone solid cylinder including tilt by wind;
- Pool at steady-state (burn rate = initial discharge rate);
- Burn time = discharge time at initial discharge rate;
- Pool shape = semicircle;
- Averaging time for dispersion = few seconds (point values not averaged);
- Obstacles or terrain effects for dispersion = none.
The tank dimensions and spill volume used by Oka are based on Fay’s study. The membrane tanker geometry is simplified to a rectangular box with a draft, \( \style{font-size:22px}{d_r} \), and the height of the tank initially above the water level, \( \style{font-size:22px}{d_t} \), including vapor ullage. The initial LNG level above the water line, \( \style{font-size:22px}{h_0} \), is \( \style{font-size:22px}{1.1\;d_r} \) for a conventional carrier. This gives the cargo surface area, \( \style{font-size:22px}{A_t} \), in terms of the volume of cargo, \( \style{font-size:22px}{C_{ct}} \), as:
The discharge rate for abox with a circular hole of area\( \style{font-size:22px}{A_{hole}} \) driven by the pressure of the hydraulic head \( \style{font-size:22px}{(\rho gh)} \) is:
which is integrated to give the drain time, \( \style{font-size:22px}{t_s} \), as:
Thus, on a log-log plot, the drain time plots linearly against hole diameter \( \style{font-size:22px}d \) with a slope of-2 as shown in Oka’s results in Figures 10 and 11 for ignited and unignited pools, respectively.
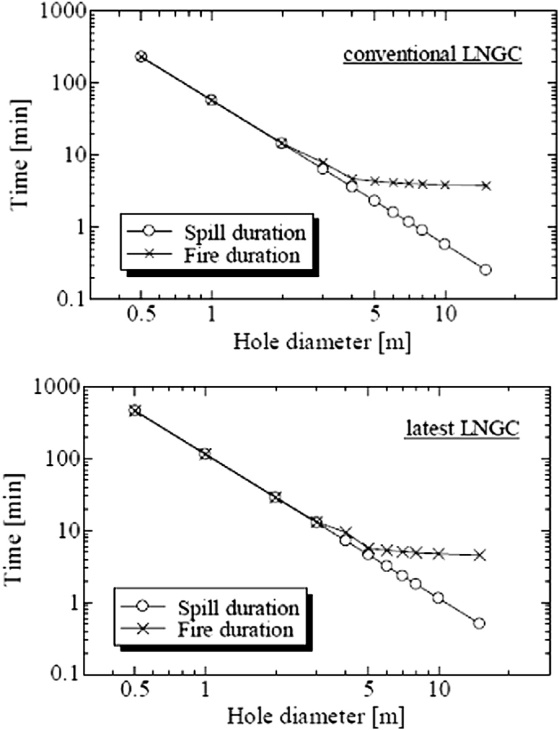
With the increase in the breach diameter, though, the curve representing the fire duration in Figure 10 or evaporation duration in Figure 11 begins to deviate from the straight line for the spill duration. The total spill duration is much shorter than the fire duration or the evaporation duration when breach diameters are larger than about 5 to 6 m for both sizes of LNG carrier (LNGC).
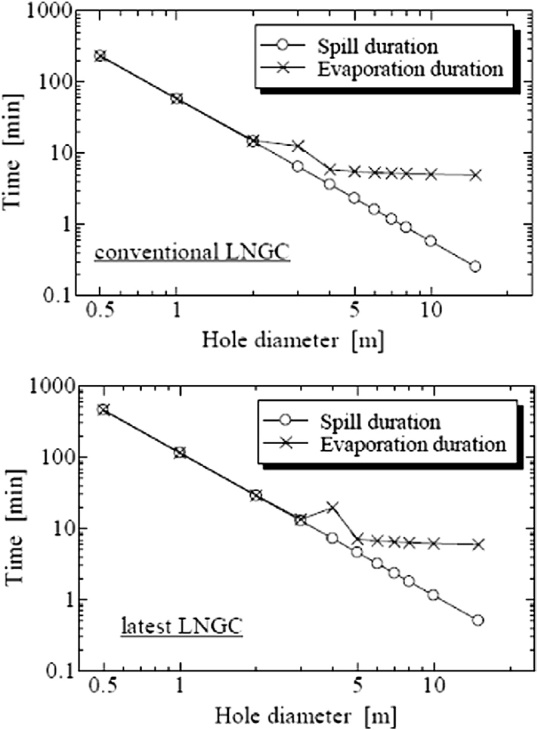
From these findings, an LNG spill can be characterized as either a long-duration release (or continuous release) if the breach size is less than 3 to 5 m, or a large-scale release of short duration (approximating an instantaneous release) if the breach size is greater than 5 to 6 m.
The implications are that the maximum pool size is independent of hole size for large holes in the instantaneous spill range. The pool size for the larger Q-Max carriers found by Oka is approximately 430 m for the ignited case. This is about 30 % longer than for conventional carriers. For the unignited spill it is about 480 m for the larger carriers, larger because the vaporization rate in the unignited scenario is lower than the mass burning rate. Also for the unignited scenario the pool size for the newer carriers is 30 % longer than for conventional carriers even though the spill size doubles. This is important if further evaluation supports these conclusions that there is a capping pool size for breaches larger than 5 m.
The main uncertainties that need to be addressed are whether environmental conditions such as waves and currents break up a single pool into multiple irregular-shaped pools.
Onshore and offshore plant differences
Offshore plants, including Floating LNG plants (FLNG), have close spacing because of the high cost of building on platforms. Accordingly, fire and cryogenic protection becomes an asset protection issue. Egress and safe refuge for operators is a high priority. High congestion requires attention to blast walls around the control area. Jet fire is often a design basis for fire protection. These considerations favor the use of modular designs. For most onshore plants more generous spacing can be applied between equipment to limit escalation. Savings in fire and cryogenic protection can be achieved without compromising safety. Even so, pumping and piping costs result in still relatively congested process equipment. Relocating personnel to safe areas is usually not an issue. A major risk concern for onshore plants is the effects beyond the plant boundaries. Pool fire is the main design basis for risk and jet fire is considered a residual risk. Congestion can be moderated.
With an increasing number of onshore plant developments in remote locations where labor mobilization or extreme weather conditions are difficult and/or site area is minimized to protect sensitive environments, some of the considerations for offshore construction are pertinent. In these cases, modular construction is being applied onshore. An alternative approach for onshore modularized design mediates between offsite and onsite approaches.
Onshore plants, process safety management systems
Safety is vital to the public acceptance of LNG and to the economic viability of the industry. Even though it is highly regulated, regulations do not require Process Safety Management (PSM) systems. Most commonly throughout the world, LNG liquefaction plants and LNG import terminals have implemented a Safety Management System (SMS) and an Environment Management System (EMS) based on the ISO 14000 standard. A survey by Working Committee 3 of the industry cooperative group Safety and Environmental Management in LNG Plants in 2002-3, reported that 81 % of participating companies had an SMS. This percentage is likely higher now. In Europe SMSs are required by a European regulation. In Taiwan and Korea SMSs are required by local regulation. In the United States and the Caribbean, no such federal requirement exists, but companies have developed SMS in accordance with their internal company policy. In Japan Goy (2003) reported at that time there was neither regulation nor implementation by company policy.
The benefits of an SMS are reported to be a decrease in material damages and in the number of employee injuries as well as improvements in plant productivity, availability of sendout equipment, and decreased product losses.
Improvements are always possible in human endeavors. It is wise to consider lessons from the best available example of an SMS, in spite of the fact that it is in a different “industry” than LNG: the safety program of the US Navy for nuclear submarines. For over 50 years of nuclear plant operations with as many as 100 operational reactors, the Nuclear Navy has not had a single loss of life or major environmental accident because of process safety. As described by Paradies (2011), at the dawn of the nuclear age, Admiral Hyman G. Rickover (2011) realized that using nuclear reactions to make steam requires a different approach to operation, maintenance, and management than was the tradition of naval engineering. He created a set of standards and a safety culture that was, and still is, effective and truly unique. His three major elements and 18 detailed elements are outlined in Congressional testimony as Technical competence, Total responsibility, and Facing the facts.
These principles require first detailed technical knowledge of the process, not only for engineers designing processes but also for the senior managers, middle managers, supervisors, and operators of the technology. Rickover (2011) said
At Naval Reactors, I take good engineers and make them managers. “The Devil is in the Details” is especially true in technical work. If you ignore these details and try to rely on management techniques or gimmicks you will surely end up with a system that is unmanageable and problems will be immensely more difficult to solve.
By Total Responsibility Admiral Rickover developed a policy that “unless you can point your finger at one person who is responsible when something goes wrong, then you have never really had anyone responsible.” Anyone in his organization was given total responsibility to stop the job if something goes wrong. This policy does not tolerate finger-pointing. “The lack of a single person taking total responsibility is what happens with shared responsibility, i.e., no one is really responsible”.
Facing the facts is terminology for making difficult decisions that favor process safety and quality despite the cost, effort, delay, or potential bad press. Rickover (2011) said that it is human inclination to “.hope that things will work out, despite evidence or suspicions to the contrary.”
Risk analysis tools
At the heart of a good risk management system is a systematic method to identify hazards, assess their likelihood and consequences, control the process effectively, shut down safely in an emergency, and recover from any loss of containment with minimum consequences. Budget decisions are made each year considering alternative strategies to justify the most cost-effective measures to bring the risks “As Low As Reasonably Practicable, ALARP”. Qualitative risk analysis tools can identify and prioritize hazards; quantitative methods can quantify the benefit side for risk/benefit analyses.
The following formal methods of Process Hazard Analysis (PHA), Hazard Identification (HAZID), Semiquantitative Risk Analysis, and Quantitative Risk Analysis (QRA) are introduced here (expanding upon Keong, 2012; see also HSE, 2002; ISO Standard 17776:2000).
- Qualitative Methodologies;
- Preliminary Risk Analysis;
- What-if Analysis;
- Hazard and Operability Analysis (HAZOP);
- Failure Mode and Effects Analysis (FMEA/FMECA);
- Multiple Attribute Utility Function Analysis;
- Approximate Quantitative Methods;
- Layers of Protection Analysis (LOPA);
- Tree-Based Techniques;
- Fault Tree Analysis (FTA);
- Event Tree Analysis (ETA);
- Cause-Consequence Analysis (CCA);
- Bow-tie method;
- Barrier-Systematic Cause Analysis Technique (BSCAT);
- Management Oversight Risk Tree;
- Safety Management Organization Review Technique;
- Techniques for Dynamic System Analysis;
- Go Method;
- Digraph/Fault Graph;
- Markov Modeling;
- Dynamic Event Logic Analytical Methodology;
- Dynamic Event Tree Analysis Method;
- Individual and Societal Risk Methods;
- Quantitative Risk Analysis (QRA).
Qualitative risk analysis methodologies
Preliminary risk analysis
Preliminary Risk Analysis or hazard analysis is a qualitative technique that involves a disciplined analysis of the event sequences that could transform a potential hazard into an accident. In this technique, the possible undesirable events are identified first and then analyzed separately. For each undesirable event or hazard, possible improvements or preventive measures are then formulated.
This methodology provides a basis for determining which categories of hazard should be looked into more closely and which analysis methods are most suitable. Needed safety measures can also be readily identified. With the aid of a frequency/consequence diagram, the identified hazards can then be ranked and prioritized according to risk.
What-if analysis. What-if studies are qualitative, postulating a deviation and asking what would be the consequences of this deviation.
Hazard and operability studies (HAZOP)
The HAZOP technique was developed in the early 1970s by Imperial Chemical Industries Ltd. HAZOP can be defined as the application of a formal systematic examination of the hazard potential from deviations in designed operations and the consequential effects on the facilities. HAZOP evaluations assemble a team of specialists in a given process, including designers and operators. The team reviews the design piping and instrumentation drawings concentrating on each piece of equipment in succession.
This technique is usually performed using a set of guidewords: NO/NOT, MORE/LESS OF, AS WELL AS, PART OF, REVERSE,andOTHERTHAN. From these guidewords, scenarios are identified that may result in a hazard or an operational problem. For example, assessing possible process line flow problems, the guide word MORE OF will correspond to high flow rate, LESS THAN, for low flow rate. The consequences of the hazard and measures to reduce the frequency of occurrence is then discussed and documented by Key Causation, Controls, and Needs for Improvement. This technique had gained wide acceptance in process industries.
Failure modes and effects analysis (FMEA/FMECA)
This method was developed in the 1950s by reliability engineers to determine problems that could arise from malfunctions of military system. Failure mode and effects analysis is a procedure by which each potential failure mode in a system is analyzed to determine its effect and to classify it according to its severity.
When the FMEA is extended by a criticality analysis, the technique is then called failure modes and effects criticality analysis (FMECA). FMEA has gained wide acceptance by the aerospace and the military industries. In fact, the technique has been adapted to other forms such as misuse mode and effects analysis.
Multiple attribute utility risk analysis. The multiple attributes as described by (2010) refer to consequences to (1) crew (C), (2) third-party personnel (P), (3) environment (E), (4) ship (S), (5) downtime (D), (6) reputation (R), and (7) third-party material assets (M). The method basically obtains a weighted average ranking over the seven variables by assigning a ranking for likelihood and consequence. The likelihood scale is (scaled per vessel year) (1) improbable (< 0.0005), (2) remote (0.0005-0.005), (3) occasional (0.005-0.05), (4) probable (0.05-0.5), and (5) frequent (> 0.5).
The consequence scale is:
- Minor or negligible effect for all six attributes;
- Major (e.g., serious injury to crew or minor injury to third-party personnel, moderate damage to ship, one day downtime, local effect on reputation, and minor damage to third-party assets);
- Critical (e.g., single fatality to crew, serious injury to third-party personnel, major release reportable to regulatory authorities, major damage to ship, one week downtime, national effect on reputation, and major damage to third-party assets);
- Catastrophic (e.g., several fatalities to crew, fatalities to third-party personnel, uncontrolled pollution, loss of ship, more than one week downtime, loss of company reputation, and extensive damage to third-party assets).
The strength and the weakness of this method is that it requires estimation of values for up to seven values for every scenario for both frequency and consequence. The method forces management to refine their relative valuations, but it remains entirely in the qualitative domain. It adds little value when all frequencies and consequences are blunt estimates.
Applications of qualitative methods
The techniques outlined earlier require involvement of hardware familiar personnel. FMEA tends to be more labor intensive, as the failure of each individual component and subsystem and overall system limits have to be considered. These qualitative techniques can be used in the design as well as the operational stage of a system.
These techniques have seen wide use in nuclear and chemical processing plants including offshore platforms. FMEA has been used in several industries to improve the reliability of their products.
Approximate quantitative methods
Layers of Protection Analysis (LOPA) analysis is based on the concept that if independent barriers can be put in place at various steps along the chain of events leading to an undesirable consequence, the probability of the event can be decreased. A LOPA analysis draws diagrams with each independent protection layer (IPL) shown in series. Figure 12 illustrates the general layer of protection concept. Specific protection devices or practices are applied for specific cases. The method is approximate because the risk reduction is taken as an order of magnitude for each added barrier.

Not all safeguards are IPLs because IPLs must meet seven requirements:
- Independence. Protection layer is not affected by the initiation event or by other protection layers;
- Functionality. The protection layer can prevent the consequence from occurring;
- Integrity. The protection layer performs at a specified low failure rate;
- Reliability. The protection layer will operate as intended under defined conditions for a specified time period;
- Auditability. Ability to inspect and demonstrate achievement of attributed feature;
- Access security. Administrative and physical means to reduce the potential for unintentional and unauthorized changes;
- Management of change. Formal process to review other than “replacement in kind.”
If they are independent, then each layer must fail for the loss event to occur. The probability of failure does not need to be known precisely, but rather, an order of magnitude estimate is used. Enough layers are added until the tolerable risk criteria adopted by the facility is reached. LOPA can also be used to rank the estimated risk values and give priority to the mitigation measures that contribute most to risk reduction. Essentially, though, LOPA studies one barrier at a time and is not strong in finding the systemwide risk for an interacting system.
Tree-based techniques
Tree-based methods include Fault Tree Analysis (FTA), Event Tree Analysis (ETA), Cause-Consequence Analysis (CCA), the Bow-Tie method, Barrier-Systematic Cause Analysis Technique (B-SCAT), Management Oversight Risk Tree (MORT) and the Safety Management Organization Review technique (SMORT). The first four provide graphic description of accident sequences and include analysis of barriers to prevent accidents. B-SCAT and MORT use Bow-Tie methods, but are used more for accident investigation than risk assessment.
These methods were first developed to determine the reliability of electronic systems. They often involve substantial effort and cost.
Fault tree analysis (FTA)
The concept of Fault Tree Analysis (FTA) was originated by Bell Telephone Laboratories in 1962 to perform a safety evaluation of the Minuteman intercontinental ballistic missile launch control system. A fault tree is a logical diagram that shows the relation between system failure; that is, a specific undesirable event in the system, and failures of the components of the system. An undesirable event is first defined and causal relationships of the failures leading to that event are then identified as related through “AND” and “OR” gates as illustrated in Figure 13. In Figure 13 the top event, “Fire breaks out” is above an AND gate, and “Ignition source is near flammable fluid” is above an OR gate. Human error probabilities can also be included in these diagrams.
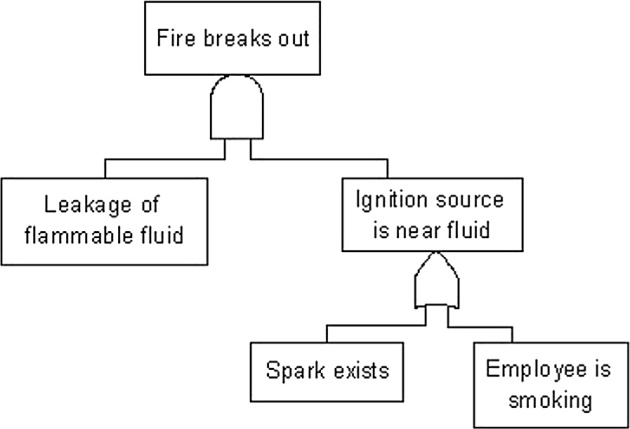
This method is used in a wide range of industries and the method is readily documented using software packages such as FT+. The NASA Handbook provides an excellent description of the method. FTA has a number of limitations, including the assumption that the causes are random and statistically independent, but certain common causes can lead to correlations in event probabilities. Such correlations violate the basic assumptions and could exaggerate the calculated likelihood of the top event. Missed or unrecorded causes may equally bias the calculated likelihood. The assumption that the sequence of events is not relevant can be a serious flaw. Markov-chain techniques are needed in this event.
Event tree analysis (ETA)
ETA diagrams the branches of consecutive events. Each branch point has a probability, pi for yes, and (1-pi) for no. For events that occur in series each probability along the path is multiplied to give the final probability for that path. ETA ideally identifies all possible failures. (What faults might we expect? What do they affect?) It is a good technique for working out the overall probability of a catastrophic event occurring.
A simplified event tree for an LNG spill onto the sea is shown in Figure 14. Pool ignition obviously applies to both pool fire and VCE. The diagram includes a potential RPT (Rapid Phase Transition) even though it is not yet considered to be a damaging event. The probability of each branch in the event tree can be estimated using failure rate tables. These probabilities can be decreased by Levels of Protection (LOP) and the analysis is used to justify these LOP.
Bow-tie analysis and BSCAT. Bow-tie analysis and cause-consequence analysis (CCA) combine cause analysis (described by fault trees) and consequence analysis (described by event trees), and hence employ both deductive and inductive analysis.
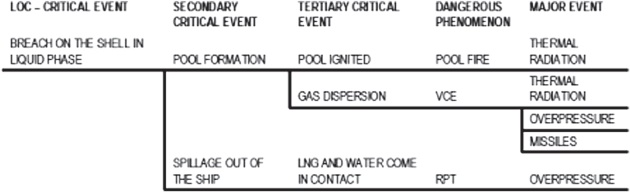
The bow-tie method expands logic trees on both sides of a “top event” hence the appearance of a bow tie. To the left is a fault tree representing failure modes that lead to the top event, and to the right are event trees representing possible consequences of the top event. The method adds barriers to the left and right of the top event, representing, respectively, Prevention Controls and Mitigation Controls. Thus, the bowtie method highlights the direct link between hazard controls (barriers) and elements of the management system. It satisfies the UK Control of Major Hazards (COMAH) regulations to “Provide a clear link between the various accident scenarios identified and the measures which are in place to defend against them.” By visually illustrating the hazard, its causes and consequences, and the controls to minimize the risk, the bow-tie can be readily understood at all levels from senior management to the public. It also provides greater ownership by stressing that people are responsible to keep barriers in working order. When people feel involved they tend to “buy-in” and take ownership. It can reduce the volume of safety analysis and lead to a reduction in unnecessary or low-importance barrier.
After being developed in Australia and The Netherlands in the 1980s it has grown in popularity. Shell Oil describes the method in a paper to the European Commission. A further description is given by Delvosalle et al. (2006), Pitblado and Tahilramani (2009), and Smith (2010).
An extension of the method by Pitblado et al. (2011) as shown in Figure 15 is called Barrier- Systematic Cause Analysis Technique (BSCAT). The figure also compares BSCAT with a previous SCAT method developed primarily for accident investigation. The objective of accident investigation methods is to work backward from an accident event to find root causes, whereas the objective of prevention measures is to work forward from possible causes (faults) to accidents. Thus, the same logic readily applies to both objectives. Accident investigation methods are further developed in Section 9.4.12.
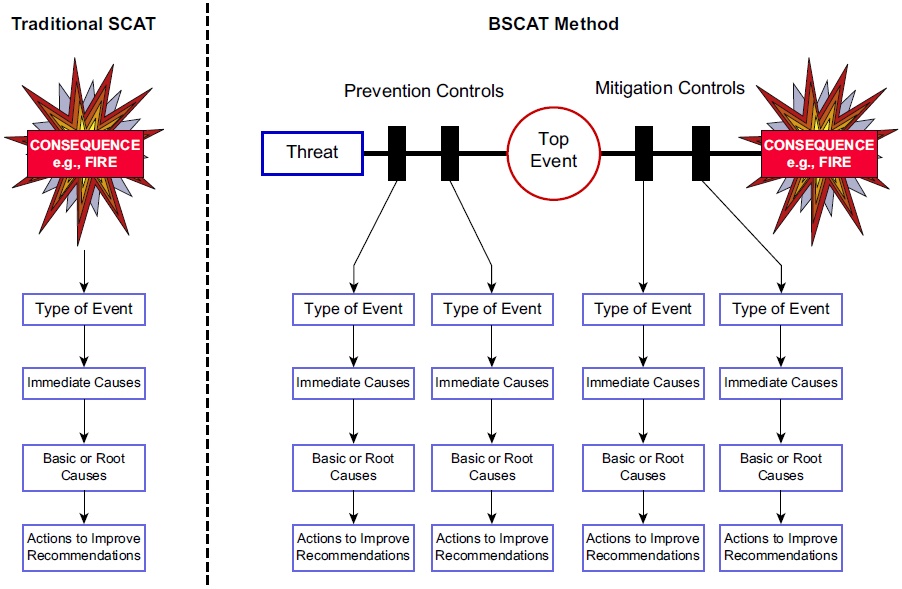
The premise of the BSCAT method is that for an incident to occur, at least some of the barriers must fail or become partly degraded. Since the nature of each barrier can be quite different from other barriers, a separate fault tree is drawn for the degradation of each barrier. The strength of the resulting method is in bringing clarity to a complex situation where, in an actual accident, up to eight barriers have been found to fail for the accident to occur (e.g., a damaging water hammer event, Berrera and Kamel [2010], the BP findings for the Macondo platform incident in the Gulf of Mexico, 2009.
The SCAT method and hence the BSCAT method makes use of a list of over 150 Basic Causes and 80 Immediate Causes as prompts for the accident investigators. These are listed in four categories of Process Safety events, arranged in declining severity: A-B-C-D.
Dynamic procedure for atypical scenarios identification (DyPASI). A consortium of Italian university professors addressed a concern that not all potential incidents are being addressed by other methods. As part of the ARAMIS project for identification of accident scenarios they developed the Dynamic Procedure for Atypical Scenarios Identification, DyPASI). The authors define atypical scenarios that are usually excluded in risk analysis for lack of data and modeling procedures. In particular, rapid phase transition (RPT) explosions fit into this category. The method proposed is not dynamic in the sense of treating a time-varying sequence of accident events, but rather in the sense of accepting continual model improvements.
After drawing up a list of hazardous materials in a plant and listing existing safety barriers the DyPASI method combines HAZOP, a bow-tie diagram, with event trees (ETA) and fault trees (FTA). The method then defines critical events, and postulates new safety barriers. As an extension of the HAZOP method to include intentional threats, the authors suggest a guide word applied to threats listed in Table 8.
Cause-consequence analysis
CCA was invented by RISO Laboratories in Denmark to be used in risk analysis of nuclear power stations. However, it can also be adapted by the other industries in the estimation of the safety of a protective or other system.
The purpose of CCA is to identify chains of events that can result in undesirable consequences. The probability of various events in the CCA diagram are found, leading to the probabilities of various consequences and the risk level of the system. Figure 16 shows a typical CCA.
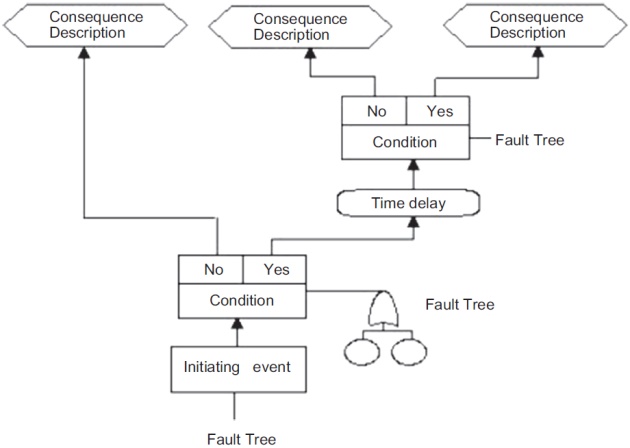
Management oversight risk tree (MORT)
Management Oversight Risk Tree (MORT) was developed in the early 1970s, for the US Energy Research and Development Administration as a safety analysis method that would be compatible with complex, goal-oriented management systems. MORT is a diagram that arranges safety program ele-ments in an orderly and logical manner. Its analysis is carried out by means of a predeveloped fault tree; that is, the investigator does not create his or her own fault tree, which would be a very large task for routine investigations. The top event is “Damage, destruction, other costs, lost production or reduced credibility of the enterprise in the eyes of society.” The tree gives an overview of the causes of the top event from management oversights and omissions and/or from assumed risks.
The generic MORT tree has defined more than 1 500 possible basic events compressed to 100 events applicable in the fields of accident prevention, administration, and management. MORT is used in the analysis or investigation of accidents and events, and evaluation of safety programs.
Safety management organization review technique (SMORT)
Safety management organization review technique (SMORT) is a simplified modification of MORT developed in Scandinavia. This technique is a structured analysis process that employs analysis levels with associated checklists, as distinguished from MORT, which is based on a comprehensive tree structure.
SMORT analysis begins with data collection based on the checklists and their associated questions, followed by evaluation of results. The information can be collected from interviews and studies of documents and investigations. This technique can be used to perform detailed investigation of acci-dents and near misses, safety audits, and planning of safety measures.
Application of tree methods
Tree-based methods are mainly used to find cut-sets or critical paths through the logic trees that lead to the undesired events. Event trees and fault trees have been widely used in probabilistic risk assessment. A strength of the methods is that hardware failures and human errors can be placed on the same tree. This requires some estimation because human behavior cannot be quantified explicitly. New techniques such as human cognitive reliability attempt to reconcile this deficiency.
Methodologies for analysis of dynamic systems
These methods do not incorporate time-varying dynamic analysis. Methods that incorporate dynamics include GO method, digraph/fault graph, event sequence diagrams, Markov behavior, dynamic event analytical methodology, and dynamic event tree analysis.
GO method
The GO method is a success-oriented system analysis that uses seventeen operators to aid in model construction. It was developed by Kaman Sciences Corporation during the 1960s for reliability analysis of electronics for the US Department of Defense.
The GO model can be constructed from engineering drawings by replacing system elements with one or more GO operators. Such operators are of three basic types: independent, dependent, and logic. Independent operators are used to model components requiring no inputs but at least one output. Dependent operators require inputs. Logic operators combine the other operators following the logic of the system being designed. After assigning a probability for success of each operator the probability of successful operation of the system can then be calculated.
The GO method is used where the boundary conditions for the system are well defined by a system schematic or other design documents. Since the failure modes are implicitly part of the GO structure, it is unsuitable for detailed analysis of failure modes. Furthermore, it does not treat common cause failures nor provide structural information (critical paths or cut sets) regarding the system.
Digraph/fault graph
The fault graph method/digraph matrix analysis uses the mathematics and language of graph theory such as path set (a set of models connected on a path) and reachability (the complete set of all possible paths between any two nodes).
This method is similar to a GO chart but uses AND/OR gates instead of GO operators. The connectivity matrix, derived from the adjacency matrix for the system, shows whether a fault node will lead to the top event. These matrices are then computer analyzed to give singletons (single components that can cause system failure) or doubletons (pairs of components that can cause system failure). The digraph method allows cycles and feedback loops that make it attractive for analyzing a dynamic system. Figure 17 shows a success-oriented system digraph of a simplified emergency nuclear reactor core cooling system.
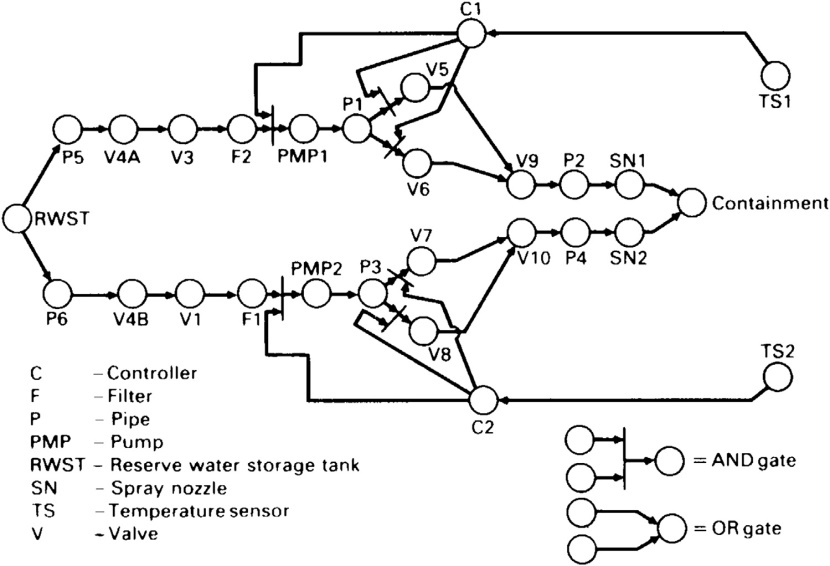
Markov modeling
Markov behavior is a classic technique used for assessing the time-dependent behavior of dynamic systems. Essentially, the dynamic response is calculated again and again with different parameter values set randomly. The state probabilities of the system \( \style{font-size:22px}{P\left(t\right)} \) in a continuous system are obtained by the solution of a coupled set of first order, constant coefficient differential equations:
where M is the matrix of coefficients whose off-diagonal elements are the transition rates and whose diagonal elements are such that the matrix columns sum to zero. An application of Markov behavior to fire propagation on an offshore platform is discussed by Pate-Cornell (1983).
Dynamic event logic analytical methodology (DYLAM)
Dynamic event logic analytical methodology (DYLAM) provides an integrated framework to explicitly treat time, process variables, and system behavior. A DYLAM will usually be comprised of the following procedures: (1) component behavior, (2) system equation resolution algorithms, (3) setting of TOP conditions, and (4) event sequence generation and analysis.
DYLAM is useful for the description of dynamic incident scenarios and for reliability assessment of systems whose response is to be kept within certain limits (Mendola, 1988). This technique can also be used for identification of system behavior and thus as a design tool for testing proposed protective barriers and operator procedures.
A system-specific DYLAM simulator must be created to analyze each particular problem. Furthermore, DYLAM requires considerable setup. It requires input data such as probabilities of a component being in certain initial states, independency of such probabilities, transition rates between different states, conditional probability matrices for dependencies among states, and values for the process variables.
Dynamic event tree analysis method (DETAM)
Dynamic event tree analysis method (DETAM) is an approach that treats time-dependent evolution of plant hardware states, process variable values, and operator states over the course of a scenario. In general, a dynamic event tree is an event tree in which varying behaviors are allowed at different points in time. This approach is defined by five characteristic sets: (1) branching set, (2) set of variables defining the system state, (3) branching rules, (4) sequence expansion rule, and (5) quantification tools. The branching sets refer to the set of variables that determine the space of possible branches at any node in the tree. Branching rules are used to determine when a branching should take place (a constant time step). Sequence expansion rules are used to limit the number of sequences.
This approach can be used to represent a wide variety of operator behavior, to model the conse-quences of operator actions, and as a framework to employ a causal model for errors of commission. Thus it allows the testing of emergency procedures and identifying where and how changes can be made to improve their effectiveness.
Applications of dynamic methods
The dynamic methods address an important deficiency found in fault/event tree methodologies. Even so, there are also limitations to their usage. The digraph and GO techniques model the system behavior and deal, to a limited extent, with changes in model structure over time. Markov behavior requires the explicit identification of possible system states and the transitions between these states. This is a problem as it is difficult to envision the entire set of possible states prior to scenario development. DYLAM and DETAM can solve the problem through the use of implicit state-transition definitions. Developing these definitions is no small task. With the large tree structure generated through the DYLAM and DETAM approaches, large computer resources are required along with a considerable amount of analyst effort in data gathering and model construction.
Summary of risk analysis methods
A total of 18 risk analysis techniques are reviewed here. Qualitative methodologies, though lacking the ability to account for dependencies between events, can identify potential hazards and failures within the system. Tree-based techniques address the dependencies between events. They quantify system failure frequency within the availability of operational data. Progress has been made with DYLAM and DETAM to study accident scenarios by treating time, process variables, system behavior, and operators action through an integrated framework. These techniques address the problem of having less than adequate models of conditions affecting control systems and operator behavior. However, the drawbacks for these techniques are the requirement for large computer resources and extensive data collection.
Multiple step systems
Many of the general tools described earlier have been successfully applied across many fields, including the area of maritime and port safety. The Formal Safety Assessment (FSA) is considered to be the most standardized framework of risk analysis in the regulated maritime environment. The FSA was first developed by the UK Maritime and Coast Guard Agency (MCA) and later incorporated into the International Maritime Organization (IMO) interim guidelines for safety assessment. The FSA method consists of a five-step process: (1) hazard identification, (2) risk assessment, (3) risk management with alternative mitigation options, (4) cost-benefit analysis, and (5) decision-making.
An example FSA is provided by Vanem et al. (2008) directed toward the risk of fatalities to crew members and Crew Evaluation Test online for seamans about Crowd Managementpassengers on an LNG carrier. They used a 138,000 m3 membrane carrier, 30 person crew, societal risk levels of \( \style{font-size:22px}{10^{-3}} \) as intolerable and \( \style{font-size:22px}{10^{-6}} \) as negligible, and economic benefit earned by each LNG carrier of \( \style{font-size:22px}{1.6\;x\;10^6} \) US$/ship year. For cost/benefit analysis they calculated a Gross Cost of Averting a Fatality (GCAF) and a Net Cost of Averting a Fatality (NCAF) defined in terms of the cost of a mitigation
\[ \style{font-size:22px}{GCAF=\frac{\Delta C}{\Delta R}\;\;\;\;\;\;\;\;\;\;Equation\;5} \]
measure, \( \style{font-size:22px}{\Delta C} \), the risk reduction from that measure, \( \style{font-size:22px}{\Delta R} \), and the economic benefit from the measure, \( \style{font-size:22px}{\Delta B} \):
- Using the frequencies shown earlier in Table 4, the individual risk for crew members on board for 182 days/year was found to be \( \style{font-size:22px}{1.6\;x\;10^{-4}} \)/person year, in line with risks found by Hansen et al. (2002) for crew on gas tankers of 4.9 x 10⁻⁴/person year. The statistics justify safety improvement measures costing less than $3 million (GCAF value);
- Table 9 lists the likely frequency for the number of crew lives lost from LNG fleet operations per ship year distributed by type of accident calculated in the FSA by Vanem et al. (2008).
The FSA risk analysis by Vanem et al. (2008) concludes that their results justify focusing further risk reduction efforts on:
- Navigational safety;
- Maneuverability reliability;
- Collision avoidance;
- Cargo protections;
- Damage stability;
- Evacuation arrangements.
Risk modeling approach for LNG plants
An approach that makes use of predefined and general FTA and ETA events and structure is proposed by Rathnayaka et al. (2011). These authors observe that accident prevention barriers can be defined in five categories shown in Figure 18 as
- Release prevention barriers;
- Dispersion prevention barriers;
- Ignition prevention barriers;
- Escalation prevention barriers;
- Damage control, emergency management barriers.
Failure of all of these barriers is required before a catastrophic accident can occur.
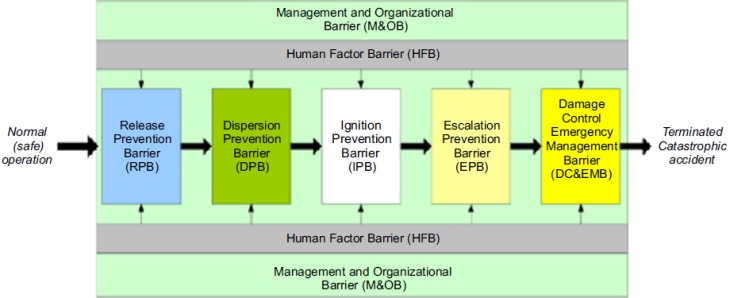
All physical barriers are under the influence of a Management and Organizational (MO) Barrier and a Human Factors Barrier. A general fault tree diagram can be drawn for the MO barriers as shown in Figure 19. A similar, more complex fault tree is drawn for the Human Factor Barrier. The failure probabilities assigned to each of the numbered inputs in Figure 19 are listed in Table 10.
The generality of Figur 19 is apparent since it could be applied to almost any risk-reduction application such as flying airplanes, construction, or operating LNG terminals, with slight adjustments to the failure probabilities in Table 10.
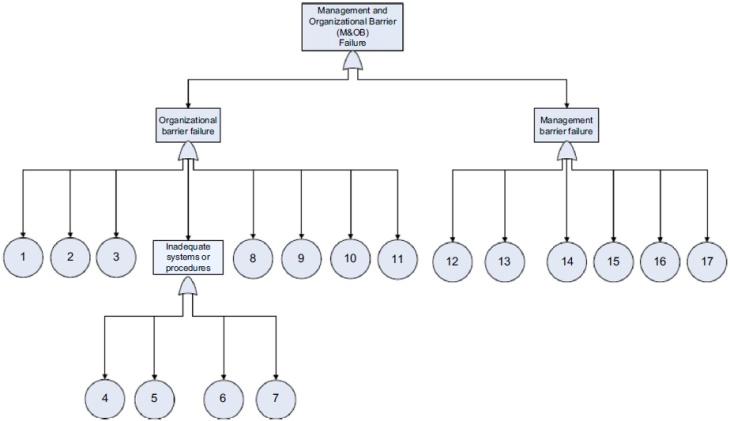
After putting all the failure probabilities into the fault trees representing each set of barriers, the failure probability is calculated at each branch of the corresponding event tree giving the results shown in Figure 20.
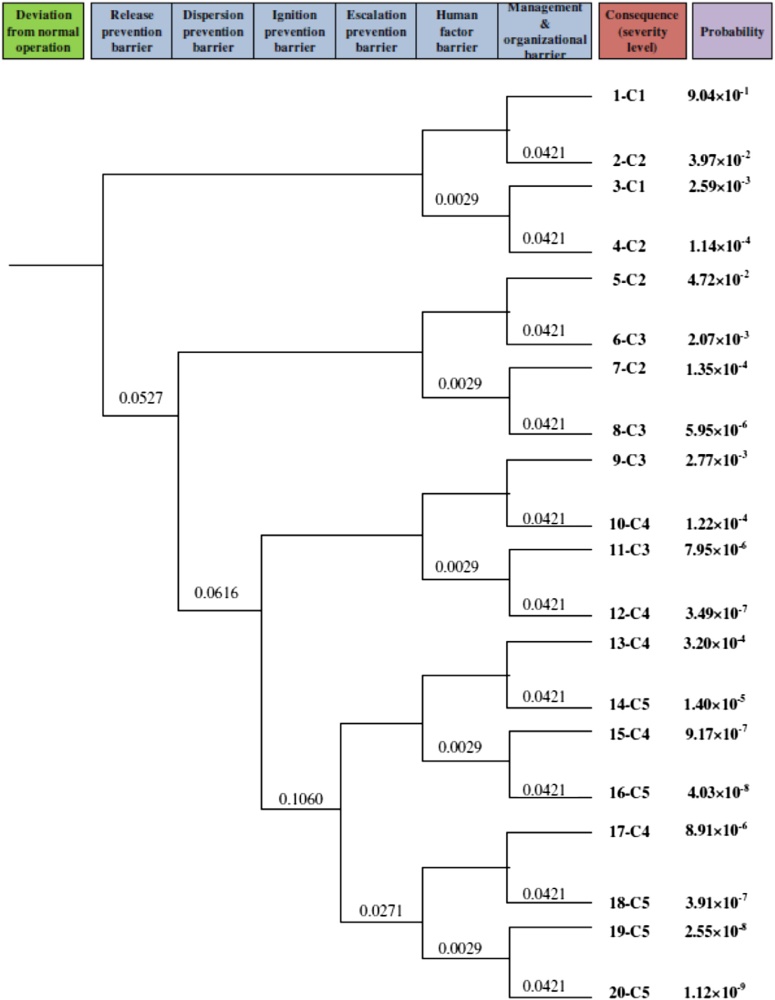
The right-hand column gives the estimated probability of each outcome. All but the last outcome at the bottom of the column represent successful avoidance of the damaging event. The contribution of each barrier and of each failure frequency is readily seen, and is readily subject to sensitivity analysis. This exercise brings out the need to keep essentially all the safety program aspects and barriers working well.
Individual and societal risk analysis
Quantitative risk analysis (QRA) methods are applied widely to petrochemical plants, including LNG plants. QRA provides highly transparent and readily understandable results. Frequencies and modeled consequences are explicit inputs. The effect of mitigation measures is also modeled.
Quantitative risk analysis (QRA)
At the beginning of a risk analysis, managers usually want to bracket the problem and ask for the predicted consequences of a worst-case scenario. Upon seeing extreme destruction that can result with such an unbounded assumption, the next request is usually for the consequences of more credible events. This leads to broad interpretations where some, citing their own personal experience, set the limits at small-bore pipe breaks. Others cite actual events with much larger line breaks.
Quantitative risk analysis solves the problem of defining credible breaks by considering all possible break sizes and linking these to their estimated frequencies. Since the line break probability decreases with increasing break size as shown in Table 11 large events (holes) are weighted with a low probability. The QRA method displays the consequence and probability of all conceivable events. This has the advantage that the effects of various mitigation measures can be quantified by their reduction of either consequence or probability.
In addition, an adequate risk analysis method must account for the fact that some facilities in the general class of petrochemical plants are huge with large numbers of possible leak sources. Applying the qualitative methods (What-If, HAZOP, LOPA, etc.) leaves the issue of selecting between a large body of conceivable mitigation measures. QRA provides cost/benefit ranking and justification of such measures.
QRA is calculation intensive, involving hundreds and even thousands of scenario evaluations. Consider, for example, 8 wind speeds and directions, 6 classes of atmospheric stability, 6 break sizes, each for 8 different lines and already this requires 8 x 6 x 6 x 8 = 2 304 modeling runs. Fortunately, improved computer technology and streamlined modeling make such calculations feasible and cost effective.
The GRI (1990) prepared a report on types of failures for LNG equipment. The report indicates that most major fires involved vaporizers and that most major breaks were the result of either vaporizer tube ruptures or pump failures. Failure rate data for LNG plants are compiled in the HSE Hydrocarbon Release Database (HRD). These data are commercially available as the LEAK database from DNV (Det Norske Veritas).
Acceptable risk criteria
Commonly, companies define a risk matrix that quantifies company policy on two axes; likelihood (probability or frequency) versus severity (consequence or cost). If there are five levels for each of these variables, the resulting matrix is like Figure 21.
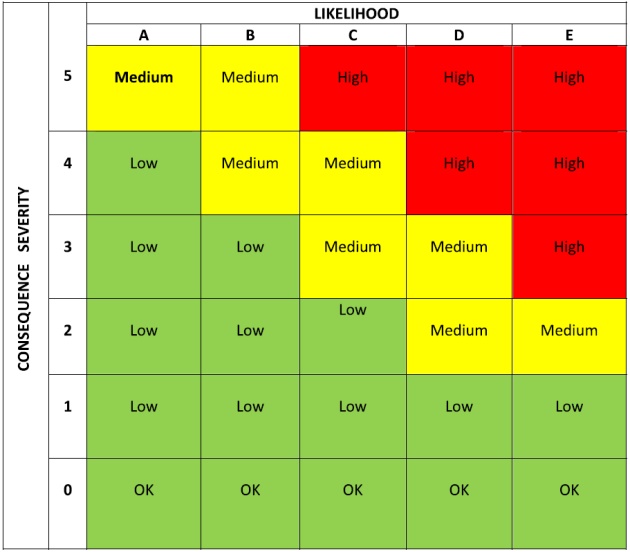
The likelihood values for Figure 21 are:
- A. < 0.0001, less than once in 10,000 years;
- B. 0.0001 to 0.001, once in 1,000 to 10,000 years;
- C. 0.001 to 0.01, once in 100 to 1,000 years;
- D. 0.01 to 0.1, once in 10 to 100 years;
- E. 0.1 to 1, averages once a year.
The divisions are not always decades. Guidance in designing an effective risk matrix is provided by Talbot (2011) and Ozog (2012).
The action levels are:
- Red = Corrections required to reduce risk to yellow area;
- Yellow = Cost-effective measures should be used to reduce risk;
- Green = No further mitigation required.
The consequence values and authority levels of responsibility are given in Table 12.
The matrix in Figure 21 can be compared to an FN (Fatality versus Number) chart shown in Figure 22. The action lines are often parallel and diagonal on a log-log plot, defining the same three actionable zones.
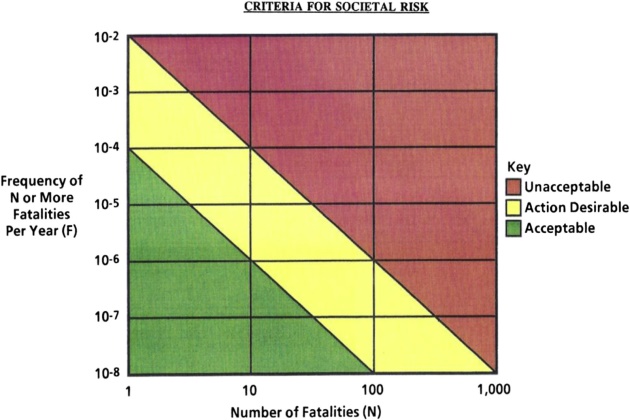
A QRA typically provides societal risk around a plant in the form of FN curves and contour plots of individual risk on a plan-view of the plant and neighboring areas. Individual risk quantifies the risk of death for a person living in a fixed place near the plant for years. (This is an idealization colloquially described as the risk for someone tied to a stake at a fixed point the entire time.) A QRA also usually quantifies the benefits of prospective mitigation measures to obtain a cost/benefit ratio. This enables a ranking to obtain the best results for the safety budget.
Societal risk is defined as the relation between the occurrence frequency of each accident and the number of people that could be affected by the impact of each accident (normally considering only death). The calculation of societal risk considers the population density around a plant and accounts for movement patterns of the exposed population from night to day, weekdays to weekends.
An FN (frequency-number) curve sorts the scenario events in increasing order by N and plots the cumulative frequency for N or more number of deaths. Risk is normally categorized on an FN curve into one of three categories of tolerance or acceptability defined by two lines:
- A lower line below which the risk is acceptable;
- An upper line above which mitigation measures are required to reduce the risk below this line;
- Between the two lines mitigation measures are subject to cost/benefit analysis and may be required to bring the risk As Low as Reasonably Practical (ALARP).
These lines on an FN curve represent one highly visible form of risk tolerance or risk acceptance criteria. As would be expected, risk acceptance requires some degree of debate in the political arena, and considerable differences can be expected worldwide. Important summaries of risk acceptance criteria are provided by CCPS (2009) and by Pitblado et al. (2012), which cite an important summary for Europe by Trbojevic (2010).
For example, Figure 23 provides the societal risk criteria for Abu Dhabi as prescribed by the national oil company ADNOC. They have a Societal Risk criterion in their Health, Safety, and Environment (HSE) Management code of practice, ADNOT-CoP-V6-06, and also have an individual risk criterion.
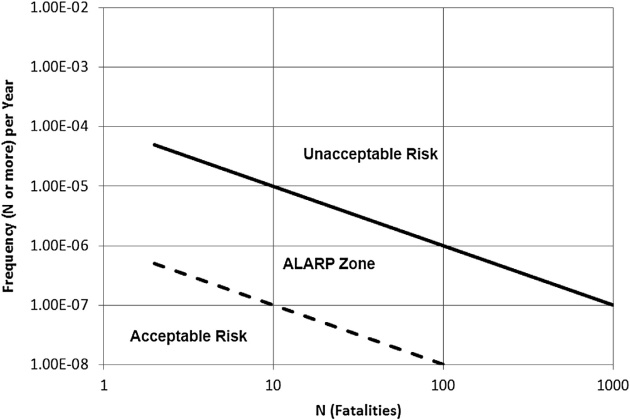
Brazil regulates societal risk on both a federal and a state level. As of 2012, four states have formally established risk guidelines (Rio de Janeiro, Sao Paulo, Rio Grande do Sul, and Bahia State) and the risk criteria are different in each state. A comparison of the four state criteria is shown in Figure 24.
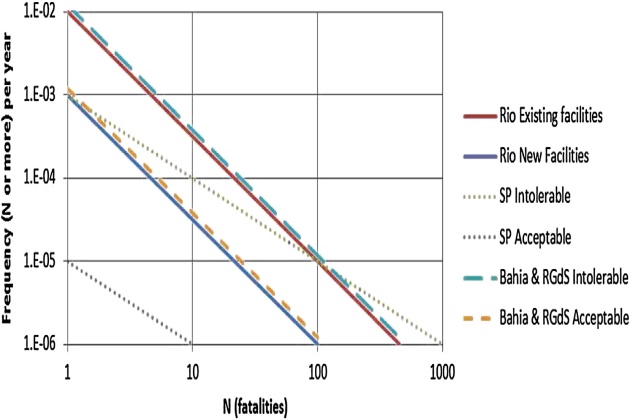
The RTC Guidelines include recent thinking by a large number of regulatory bodies and experts in risk analysis, as discussed by Frank and Jones (2010) and Frank (2011). To be precise, a risk assessment and a corresponding acceptance criterion should define the particular groups to which the criteria are intended to apply; for example, workers exposed to the risk, workers in the general area, public, vulnerable populations, and so on; and the level of harm addressed by the criteria (fatality or injury). The criteria should specify whether frequency represents an annual frequency or a fixed probability of injury or death. The CCPS CPQRA Guidelines (2000) presents 14 different risk measures, all derived from the same set of incident, likelihood, and consequence data.
The FN curve method is graphic and provides a superficially understandable visual comparison with risk tolerance criteria curves. In addition, an FN curve shows top contributing events as steps along the curve, but it is not the best way to indicate what drives risk or how to mitigate it. Other useful methods present societal risk as total onsite societal risk per process unit, per building, or per contribution per source, or PLL (Potential Loss of Life) favored for offshore platform assessments.
As an example the Major Industrial Accidents Council of Canada (MIACC) specifies the following criteria for land use and occupancy as cited in MIACC (2007):
- For a risk of 10-4 per annum (or 100 deaths every million years):
- no land use other than industrial shall be allowed;
- For risks between 10-4 and 10-5 per annum (10 to 100 deaths in a million years):
- Uses that require permanent access, a limited number of people, and an easy and timely evacuation are allowed (manufacturing, warehouses, etc);
- For areas between the contours of 10-5 and 10-6 per annum (1 to 10 deaths in a million years):
- Uses that require permanent access, a limited number of people, premises easily evacuated, with a low population density;
- For areas of risk at or below 10-6 per annum:
- no limits are made for land occupancy.
The MIACC cited other sources for consistency, including the CSChE (2004), the UK Health and Safety Executive, and Pate’-Cornell (1994) who stated that the Norwegian Petroleum Directorate, among others, uses a maximum risk criterion for the collapse of offshore rigs to be 10-4 per annum.
Accident investigation techniques
As pointed out in Section 9.4.9.3 discussing the bow-tie and BSCAT methods, accident investigation techniques are essential the inverse of some risk analysis methods, since both employ an event tree path, only evaluated in forward or reverse directions. Broadribb (2003) identifies three main incident investigation approaches: Domino Theory of Causation, System Theory or Multiple-Causation Theory, and Hazard-Barrier-Target Theory.
The Domino Theory of Causation is one of the earliest systems, incorporated in the International Safety Rating System (ISRS), as documented by Bird et al. (2003). This theory postulates that a series of failures in barrier systems leads to an accident. The system approach postulates that multiple failures could independently occur “in parallel,” as could be analyzed by FTA (fault tree analysis). The BSCAT method is based on ideas of the so-called Swiss cheese model (see Section 9.4.9.3) and can link incidents back to underpinning failures in management systems. It is claimed to be designed for less expert investigators such as process supervisors, who do the first level of accident investigation.
Some other accident investigation methods include:
- What-If method;
- Fishbone diagrams;
- Fault tree analysis;
- MORT (Management Oversight and Risk Tree);
- Common List of Causes;
- Tap Root (System Improvements Inc.);
- Tripod (Univ. Manchester and Univ. Leiden);
- System Dynamics (Mass. Institute of Technology).
Some of these techniques require training in quite different skill sets, and FTA, MORT, Tripod, and System Dynamics require specialist investigators. Tripod is designed to address safety culture de-ficiencies. It is unlikely that a single technique would meet the needs of every incident.
Innovative systems under development
Innovative approaches under development include the Fault Semantic Network for fault detection and Bayesian-LOPA Methodology for improving the database used in QRA for LNG plants.
Fault semantic networks (FSN)
A proposed fault detection approach uses software tied to a plant’s instrumentation. The computer algorithms of Gabbar and Bedard (2010) and Gabbar and Khan (2010) use real-time process data. The approach compares certain patterns of deviations in values of operating variables with patterns from previous accidents. This approach introduces diagnostic capability to normal instrument logging to provide early warnings. It is limited, of course, to its database of previous accidents. The proposed software uses Process Object Oriented Modeling (POOM) to construct a “fault semantic network” to construct logic rules to automate the identification of failures by pattern recognition. The authors cite successful use of predictive maintenance to estimate remaining life using real-time monitoring and equipment failure records.
Bayesian-LOPA methodology
In the developmental stages at universities, the Bayesian-LOPA methodology may improve Quantitative Risk Assessment (QRA) for LNG projects. It could also fill some voids in applying Levels of Protection Analysis (LOPA). Both QRA and LOPA rely on failure rate data of facilities and equipment that are in relatively short supply in the LNG industry, precisely because there are few incident reports and few failure rate compilations. Generic failure data from other industries such as the petrochemical and nuclear power industries have sufficient and longer-term historical records. However, these data may not provide appropriate risk results for the LNG industry because the operational conditions and environments differ so much. Bayesian methods were developed specifically to statistically produce updated failure data using the prior generic data from other industries with likelihood information from a new source such as the LNG industry. For plant-specific likelihood information, the LNG plant failure database that was established from 27 LNG facilities is recommended.
The Bayesian methods are general enough that they have been developed into computer programs capable of treating very complex systems such as an air traffic controller program. The program allows any number of logical connections to be drawn between nodes, represented by ovals in the logic diagram. These are called Bayesian Belief Networks (BBN). This development, specifically at the University of Pittsburgh, and at Delft University in the Netherlands, provides free software with good capability. Pasman and Rogers (2011) are taking advantage of the BBN software by applying it to a LOPA calculation. The methods may prove useful in analyzing accidents, as well as making QRA analysis simpler and more transparent.
LNG risk analysis examples
LNG port risk analysis
Examples of risk analysis for an LNG port are provided by VanDoorn (2011, 2012) and MARIN (2012) for the ports of Ferrol, Spain, and Rotterdam. The probabilities of a grounding or collision incident were calculated using MARIN’s Safety Model for Shipping and Offshore in the North Sea (SAMSON). The probability of developing a hole in a cargo tank were calculated using an analytical Maritime Collision Model MARCOL. It determines the penetration probability of ship and cargo tanks in a few seconds. A fast-time simulation model SHIPMA was used for training and to check the assumptions of proposed tug assistance.
Figure 25 shows for the Port of Rotterdam the five parts of the path of an arriving LNG carrier that were evaluated for risk: (1) anchorage area; (2) approach to port entrance; (3) approach to terminal; (4) just in front of the terminal; (5) moored at the jetty. Some findings were that the penetration probability for cargo tanks is much higher in the anchorage area than within the harbor because passing ships at sea sail at higher speeds than ships within the port. In port, because of the layout of the terminal, an LNG carrier cannot be hit in the side by another large ship.
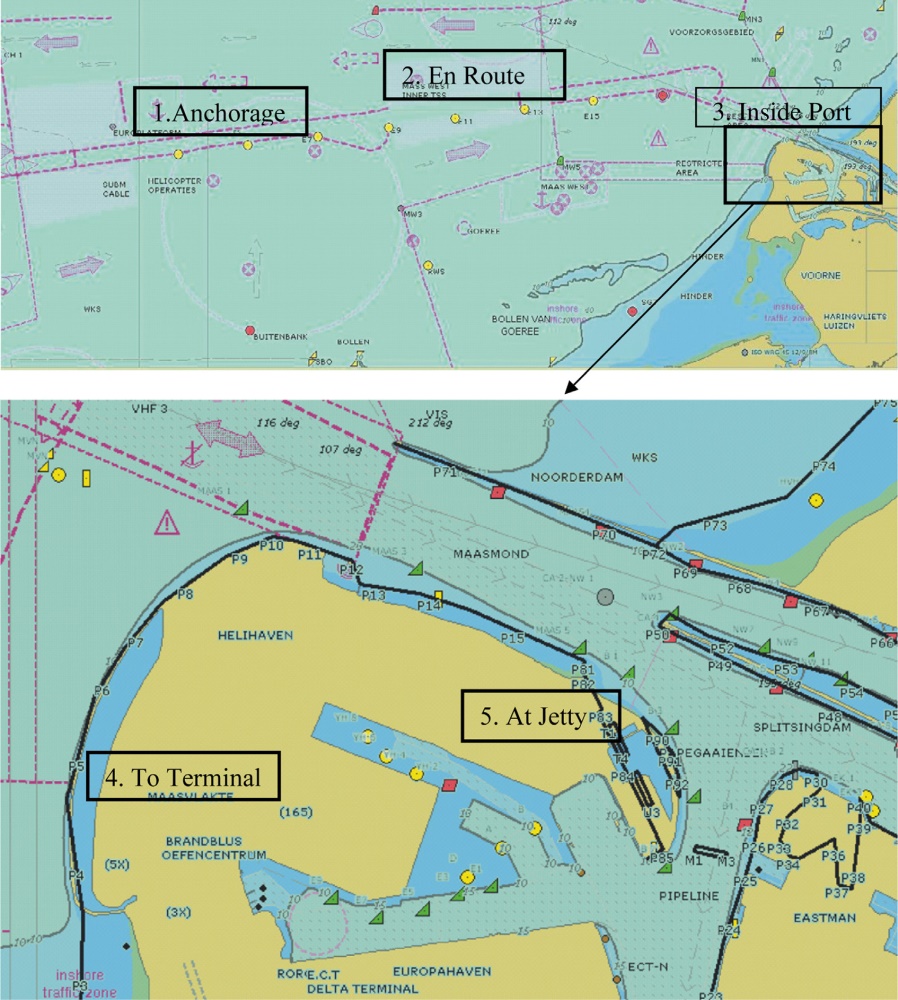
The Rotterdam area study demonstrated that traffic regulation can strongly reduce the collision risk, such as stopping all other traffic during the arrival of LNG carriers, and scheduling carrier arrivals for a specified time slot at night, when other traffic density is low.
For the Port of Ferrol, Spain, risks from grounding are found by first plotting grounding boundaries along the LNG carrier route into the port. A navigational error rate is applied to the SAMSON model to calculate “ramming” probabilities at each point along the route as a function of the carrier speed. A mechanical failure rate is similarly applied all along the route to find “drifting” probabilities. Unexpected weather changes and emergencies during transit are also considered. These become inputs to the MARCOL model to calculate vessel penetration and possible leaks of LNG. These scenarios are inputs for a quantitative risk analysis (QRA) that models LNG leaks, fires, and such resulting in a conventional FN curve such as Figure 26. The three curves in Figure 26 are for the cases of high, nominal, and lower speeds of the carrier. The graph shows that reducing the ship speed by one knot increases the safety level by a factor of 10. The study also results in recommendations for nautical procedures, entrance rules, and limiting environmental conditions used to develop port procedures.
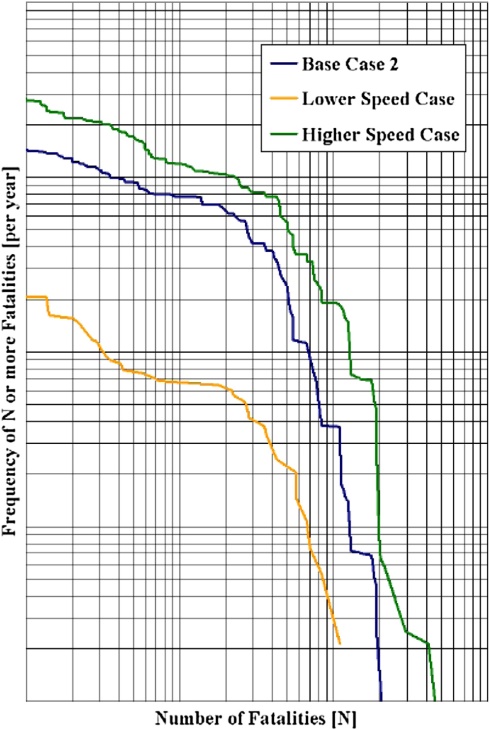
An additional example of a risk analysis for the Italian LNG terminal of Panigaglia near La Spezia, Italy is provided by Bubbico et al. (2009). In this case, accidental collision and grounding cases were not considered likely because of ship speed restrictions in the harbor. The authors evaluated the effects of a deliberate attack on an LNG carrier at two locations indicated in Figure 27 by the center of fire radiation contours of 5 kW/m2 and 37.5 kW/m2 drawn as circles accounting for all wind directions. The southern-most point is at the end of a breakwater on a required path for LNG ships where an attack could possibly block or reduce passage into the harbor. The northern-most point is at an anchorage point, India 2, which can be used only under special conditions and for a limited time (6 hours). A 5 m2 breach at the water line is assumed caused by an explosive-laden small boat attack. The models ALOHA 5.4.1 and CHEMS-PLUS 2.0 were used to predict pool size, fire radiation contours, and dispersion from an unignited spill. The predictions are consistent with those of the Sandia study.
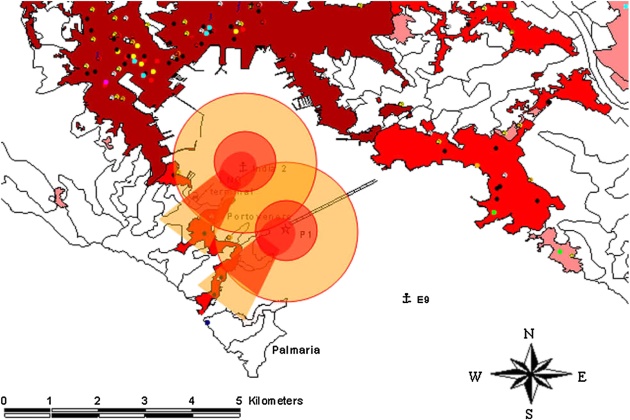
Superimposed on the predicted fire radiation circles in Figure 27 is a plume representing a possible delayed-ignition flash fire. This is considered highly unlikely since it is not compatible with the assumption of an explosive attack (that would likely result in immediate ignition). A flash fire burning back would be an important threat mainly to people caught in the flash fire plume. Altogether, since the hazard plumes are largely at sea, little collateral damage is predicted.
Establishing onshore terminal vapor dispersion zones
Increasingly realistic simulations are being developed to set the required vapor dispersion zones for an onshore LNG import terminal. An example by Melton and Cornwell (2010) uses Computational Fluid Dynamics (CFD) to model LNG spills flowing into trenches that direct the spill to an impoundment basin. A free model available from the US government has been found appropriate for modeling buoyancy- dominated vapor dispersion and is relatively easy to use for routine modeling tasks. This is the Fire Dynamics Simulator (FDS) developed by the National Institute of Standards and Technology’s Building Fire Research Laboratory. The model has been checked and validated in several studies conducted at the National Bureau of Standards (see Melton and Cornwell, 2010), and has been successfully used to model large-scale LNG tests Burro 8 and 9 by Clement (2000) and Chang and Meroney (2003).
CFD models have the ability to simulate a full range of trench layouts and drainage paths. In addition, the analyst can incorporate important features such as sloping terrain, vapor fences, escarpments, process equipment, and LNG storage tanks that can have a significant effect on the dispersion of vapors evaporating from drainage channels. An example is shown in Figures 28 and 29 of the transient vapor generation and dispersion of natural gas from LNG in a trench and an impoundment basin near three storage tanks.
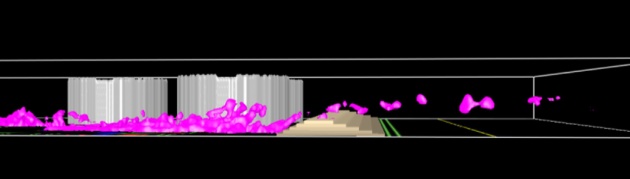
The event is a full-bore rupture of an unloading line spilling into a channel and impoundment basin made of medium-density concrete. A side view in Figure 28 shows vapors elevated by flowing over the impoundment berm. A plan view in Figure 29 shows a trench leading to the impoundment basin and evaporated vapors from these sources partially caught in the wake of a storage tank, and somewhat contained by the impoundment berm.
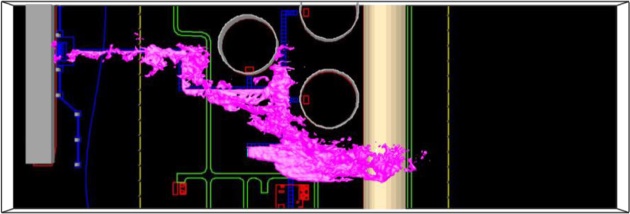
Such simulations can be used to establish the vapor dispersion zone requirements of the US codes citing NFPA-59A.
Optimizing onshore terminal layout by risk analysis
Optimal design of an LNG terminal is usually done considering risk factors. Plant layout is a key passive measure for plant safety and avoidance of escalation of fires and explosions. Plant layout safety principles include:
- Separation should allow for effective firefighting and prevent fire from one area to propagate to others;
- Each area should have access from at least two different ways;
- Minimize liquid inventory;
- Equipment with high inventory of flammable material should be located downwind of the prevalent wind direction, away from community areas, control rooms, etc;
- Fire water systems should be looped around entire plants, so if one line is cut, there is another;
- Plant electric power should be provided through two separate circuits;
- Select safer tank designs.
Additional passive measures such as fire walls assist when additional space is impractical.
ESD (emergency shutdown) and EDS (emergency depressurization systems) divide the plant into possible fire zones. Each zone can be isolated at its boundaries by ESD valves before proceeding to depressurization. Depressurization philosophy is crucial to metallurgy selection in an LNG plant. Depressurization rapidly reduces pressure of process equipment by relieving its inventory to flare or vent to prevent vessel bursting, and removes process fluid from equipment to a safe destination.
Current best design practice involves studying different layouts using 3D software that allows easy rearrangement of the main equipment, followed by computer rerunning of the pipe rack design. A new cost estimate is found for each new layout. The thermal and vapor dispersion exclusion zones are calculated for each case.
Designers use dynamic process simulators to perform real-time studies of the unit under different modes of operation such as startup, shutdown, upsets, and so on to verify the stability of the process control system, and to verify the EDS system.
An example design approach is provided by Taylor (2007) for an LNG export terminal with nominal capacity of 3.0 million tonnes per annum (mtpa). The proposed plant includes two 140,000 m3 LNG storage tanks, and the rate at which LNG will be transferred to the ships was set tentatively for more than 10,000 m3/hr. The design must meet the NFPA 59A requirements, as established using consequence modeling. To do so, three impoundment areas are needed, with the design requirements shown in Table 13. The values in Table 13 are inputs to dispersion modeling to establish the thermal radiation exclusion zone, the vapor dispersion exclusion zone, and tolerable vapor cloud explosion (VCE) blast loads. The response times in Table 13 are justified by incorporating sophisticated leak detection and shutdown systems.
The model used was the CANARY model by Quest Consultants, Inc., which incorporates the Baker-Strehlow explosion model.
The results of modeling to find the separation distances required by NFPA 59A are shown in Table 14, with two sets of weather parameters, those specified in NFPA 59A and site-specific values, taken to be more credible.
With the required separation distances in Table 14, the designers can optimally arrange process units and equipment. Once the equipment arrangement and the site location plan have been finalized, further studies verify the location and design criteria for process buildings according to API RP 752.
Explosion considerations in terminal design
Modern theory for vapor cloud explosions requires modeling how the flammable vapor cloud overlaps congested zones such as zones of high piping density in a plant. Models have been developed for calculating this overlap, and some models account, as well, for how the burning gas vapors push unburned flammable gases into other nearby congested zones. Predictions of the Safe Site 3G model of Baker Engineering and Risk Consultants are illustrated in Figures 30 and 31 for loss of propane refrigerant from a 2 in (50.8 mm) hole in a 4 in line discharged horizontally at 0.5 m elevation.
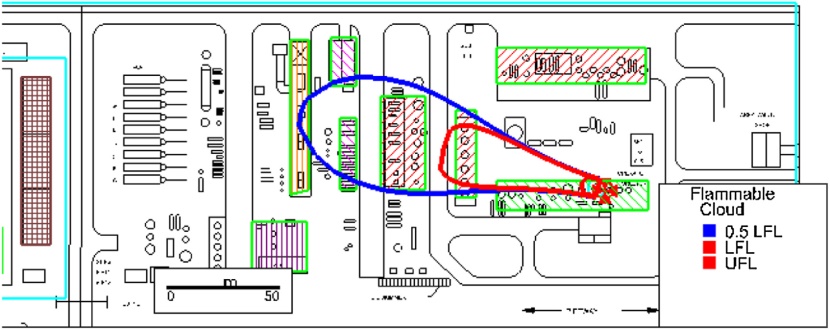
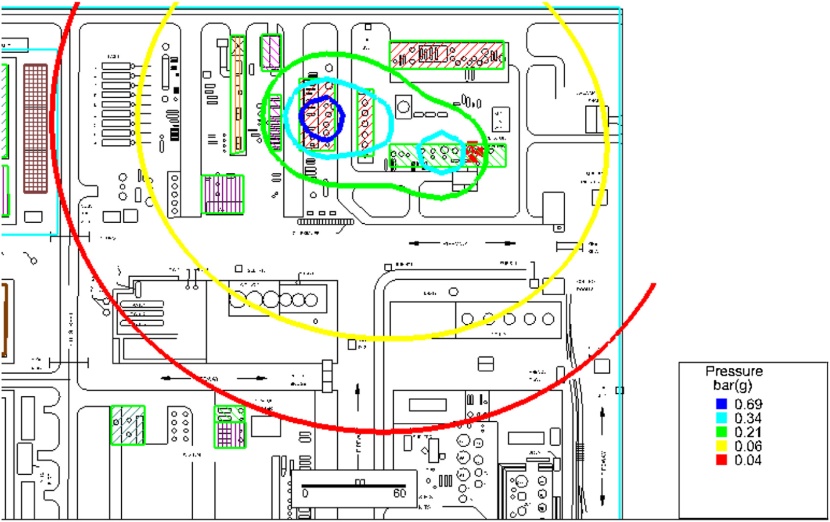
Similar contours are predicted for blast impulse, defined as overpressure integrated over the time of the blast wave. The combination of overpressure and impulse are used to calculate deformation of the structural surfaces of a building, such as a control room. The building damage is deduced from the calculated deformations.
CFD models are used in a similar fashion to calculate dispersion within a portion of an LNG plant as shown in Figure 32 by Takahashi et al (2007).

The predicted structural deformations of a strong, reinforced concrete control room from the overpressures illustrated in Figure 33 are shown in Figure 34.
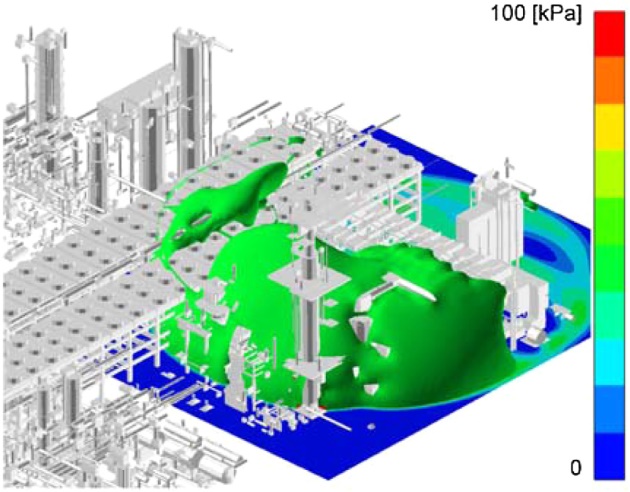
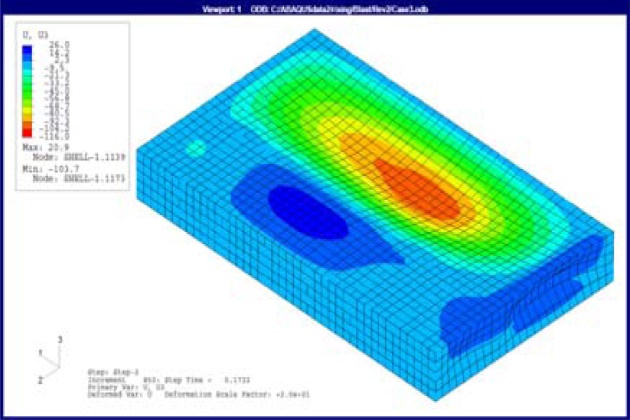
These deformations do not result in structural damage. Such analyses are useful to select control room locations and their required structural strength.
Risk-based optimization of shutdown schedule for LNG plants
The concepts of risk analysis can be applied to optimize plant management in certain areas. One area is to optimize the shutdown schedule for plant maintenance. This concept is an extension of Risk-Based Inspection (RBI) and maintenance methodology. To develop an optimum shutdown strategy, a set of scenarios are postulated that employ different combinations of the parameters: redundancy, standby, and shutdown periods. For each scenario, the failure probability and consequence are calculated. The optimization proceeds by iterating on the parameters until the lowest cost is found.
The failure rates of key equipment can be found from plant records, but is costly and time-consuming. Keshavarz et al. (2012) suggest, instead, to use life-testing data from the Offshore Reliability Data Handbook. The major assumption is that these data can be well- represented (at least in part of the general “bathtub curve”) by a Weibull distribution, \( \style{font-size:22px}{R(T)} \), where \( \style{font-size:22px}T \) is the operation time of equipment:
The parameters \( \style{font-size:22px}\beta \) and \( \style{font-size:22px}\theta \) of this distribution can be found from the mean and variance of mean time to failure (MTTF) for each type of equipment. Examples are given in Table 15 that illustrate that the shape factor, \( \style{font-size:22px}\beta \), differs substantially from that of a normal distribution for which \( \style{font-size:22px}\beta \) is 2.
When the operation time is much smaller than the equipment’s characteristic life, Equation 7 is close to one, the equipment is operating at high reliability, and no further action is required. The reliability “bath-tub” curve shows higher failure rates at the beginning of operation and later as the system deteriorates. Short intervals of preventive maintenance may be needed at both extremes. As the average shutdown time (the time at which the system needs to be down for preventive maintenance) or goal time (the operational time of the plant) increases, the risk of an unintentional shutdown also increases. For example, in Figure 35 the authors plot risk (the cost of maintenance and of business interruption) against the number of shutdowns with the shutdown time as a parameter. For long shutdown time (e.g., 9 days), the optimum number of shutdowns is low but the optimum cost is high. For shorter shutdown times (5 days and 1 day), the optimum risk is decreased, and the optimum occurs at a higher number of shutdowns. By repeating the analysis by doubling the goal time, the authors show that the required preventive maintenance and the associated optimum risk more than doubles. The effect of having more standby redundant equipment can be shown to also lower the risk and the number of shutdowns.
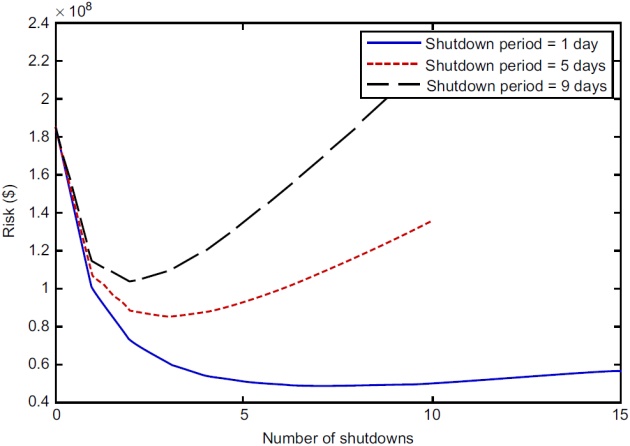
The optimized maintenance shutdown schedule may not represent the overall optimum as Keshavarz et al. (2012) point out since it does not focus on asset management. Asset management requires a comprehensive study to achieve minimum risk associated with the best plant performance.
Comparing alternate LNG technologies for risk
An example of the application of risk analysis comparing three types of LNG regasification terminals for their inherent safety is provided by Tugnoli et al. (2010) for onshore terminals, offshore gravity based structures (GBS), and offshore floating storage and regasification units (FSRU). Table 16 compares some current characteristics of these technologies.
A set of Loss of Containment (LOC) scenarios were selected for the risk comparison:
- Breach on the shell in the liquid or vapor phase;
- Large (e.g., 100 mm equivalent diameter);
- Medium (e.g., 35 to 50 mm diameter);
- Small (10% of the pipe diameter);
- Leak from liquid or gas pipe;
- Large (full-bore break);
- Medium (22 to 44 % of the pipe diameter);
- Small (10 % of the pipe diameter);
- Catastrophic rupture;
- Vessel collapse.
For this example, a Performance Indicator (PI) is defined as the distance to 1 % fatality found by applying a consequence model. Upon adding the PI values for each branch of the event tree, the authors conclude that all three technologies have a similar safety performance. This is because the extent of damage from fires and explosions is dominated by the LNG properties, and is nearly the same in each case.
Areas of LNG risk research
Interim research results were reported by Sandia Laboratories on two important issues related to risks to an LNG carrier from accident or attack.
Brightness of large pool fires on water and land
Previously, the largest LNG pool fire test was on a 35 m diameter concrete pit at Montoir, France. As the diameter increases for a pool fire, larger amounts of smoke occurred as would be expected from limited air diffusion into larger fires. The Montoir test fire was modeled with a surface emissive power (SEP) ranging from 300 kW/m2 near the base of the fire to 100 kW/m2 at the top of the visible flame. Raj fit a quadratic profile for SEP as a function of the fraction of the visible flame length.
Sandia Laboratories constructed a 120 m diameter pool, 2 m deep, for conducting LNG pool fire tests on water of 30 m, 70 m, and 100 m diameter. Sandia reported finding that water entrainment and low amounts of smoke created average flame SEP values higher than expected at 280 kW/m2. This report also disclosed that the flame height/diameter ratio was less than expected from previous correlations extrapolated to large pool fires. The overall LNG pool fire hazard predicted distances were decreased by 3 to 7 % from Sandia reports of 2004 and 2008.
Investigation of possible cascading damage on LNG carriers
The issue of cascading effects has been a concern for some time in LNG risk assessments. In particular, a breach releasing LNG into a double-hulled LNG carrier introduces the threat of metal stress on structural steel members from two temperature extremes, cryogenic cooling and fire heating. The interim Sandia report concludes:
- About 40 % of LNG spilled can stay within the LNG vessel, causing cryogenic and fire thermal damage to the vessel’s structure;
- The cargo tank insulation and pressure relief valve systems appear adequate to prevent overpressurization of the cargo tanks in an LNG fire;
- Simultaneous, multiple cargo tank spills (cascading failure) from an initial event seems unlikely;
- More detailed risk mitigation and management may be required, depending on site-specific conditions and operations (e.g., improved traffic control, lightering operations and capabilities, high-capacity firefighting tug escorts, etc.
LNG security
For decades, the LNG industry has maintained secure operations around the world, including areas where terrorism is a concern. However, since LNG infrastructure is highly visible and easily identified, it can be vulnerable to terrorist attack.
Codes for security
A number of international and national safety and design standards have been developed for LNG ships to prevent or mitigate spills of LNG over water. These standards are designed to prevent groundings, collisions, steering or propulsion failures, and attacks. They include traffic control, exclusion zones around a vessel while in transit within a port, escort by Coast Guard vessels, as well as early notice of a ship’s arrival, investigation of crew backgrounds, at-sea boarding of LNG ships, special security sweeps, and positive control of an LNG ship during port transit.
Several of the provisions covered earlier for codes and standards have security provisions. The US codes 33CFR104 Part Cd Vessel Security Assessment (VSA) and 33CFR105 Part Cd Facility Security Assessment (FSA) give the US Coast Guard jurisdiction over maritime security on vessels and at facilities subject to 33CFR Parts 126, 127, and 154. The VSA is the responsibility of vessel owners and operators. The FSA is the responsibility of the facility owner/operator who must designate a Facility Security Officer (FSO) with background and experience specified in the regulation. The FSO is responsible to prepare a Facility Security Plan (FSP) based on an FSA. Paragraph 105.305 sets forth the minimum requirements for the FSA.
In addition, Canada requires LNG tankers and terminals to have an approved security plan under the Marine Transportation Security Act and the Marine Transportation Security Regulations.
Security vulnerability analysis (SVA)
Security risk is defined as a function of consequence, vulnerability, and threat. Consequence is a measure of a result if an item, process, or system is destroyed or interrupted. Vulnerability is a measure of how well a site is physically protected by barriers, electronics, people, and processes. Threat is a measure of how likely it is that a person or group has targeted the site for penetration .
A performance-based SVA method that is relevant to LNG facilities is available from the American Petroleum Institute (API) and the National Petrochemical & Refiners Association (NPRA). This guideline, “Security Vulnerability Assessment Methodology for the Petroleum and Petrochemical Industries,” draws heavily on the AIChE Center for Chemical Process Safety (CCPS) SVA methodology.
Essentially all SVA methods involve similar steps as illustrated in Figure 36). The five steps in the method illustrated in Figure 36 are similar to the widely accepted Navigation Vessel Inspection Circular (NVIC) No. 11-02, “Recommended Security Guidelines for Facilities,” published by the US Coast Guard.
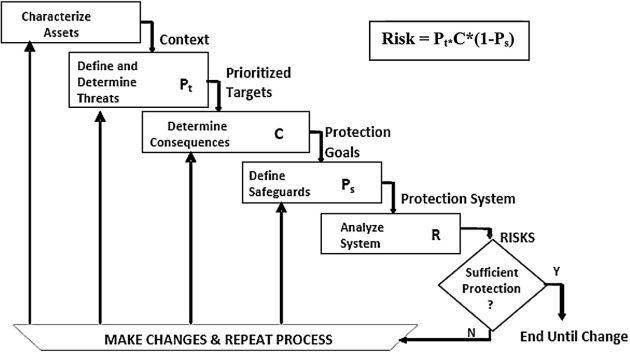
Figure 36 is illustrated as an iterative process in which layers of safeguards (barriers or procedures) are added and the risk is reevaluated, very much like conventional risk analysis except that the threat probability is very difficult to quantify. The steps are:
- Characterize assets. Collect information on critical operations, hazardous materials, nearby populations and businesses, and security systems;
- Identify desirable target assets and prioritize their value;
- Identify possible threats and vulnerabilities. Rank the threats after determining the consequences and safeguards. Assign a probability \( \style{font-size:22px}{P_T} \) to quantify this ranking;
- Determine consequences for each threat scenario. Establish the potential damage to a ship cargo tank or onshore facility and the potential volume and rate of spills that could occur;
- Establish the environmental conditions (e.g., wind, currents, atmospheric stability) and calculate the volatilization, dispersion, fire radiation contours, and explosion potential and estimate the cost of each threatened event, \( \style{font-size:22px}C \);
- List current safeguards, layers of protection, and response resources. Estimate the effectiveness in reducing the severity of an event, \( \style{font-size:22px}{P_S} \);
- Calculate risk, \( \style{font-size:22px}R \), as the product \( \style{font-size:22px}{P_T\;(1-P_S\;)} \) \( \style{font-size:22px}C \) for each threat and sum all threats;
- If the risk seems too high provide additional layers of protection to reduce risk of attack/sabotage.
Improvements to reduce security risk usually focus on reducing vulnerability by developing strategies to detect, delay, and respond to an adversary in the shortest amount of time.
Examples of layers of protection and areas for improvement include:
- Physical:
- fencing, trenches, motion detectors, trip wires, lighting, etc;
- Internal surveillance:
- security personnel, TV monitors, etc;
- Tank and insulation upgrades;
- Tanker standoff protection systems;
- Improved surveillance and searches of tugs, ship crews, and other vessels;
- Redundant offshore mooring and offloading systems;
- External surveillance:
- local and state law enforcement, port authorities, USCG, FBI;
- Improved emergency response coordination, communication, drills, and training;
- These measures reduce the likelihood that those with criminal intent will target their vessels or facilities.
Security vulnerability criticality index
Several approaches are used in security analysis with application to LNG facilities. One approach is to estimate an index that semiquantifies the impact or criticality, \( \style{font-size:22px}C \), ofan attack, or the value to a terrorist, as additive factors such as:
where \( \style{font-size:22px}{C_{TYPE}} \) is the significance ofa monument, \( \style{font-size:22px}{C_{CASUALTIES}} \) is number of casualties, \( \style{font-size:22px}{C_{ECONOMIC\;IMPACT}} \) is cost of replacement damage to equipment (or ship), \( \style{font-size:22px}{C_{OUTAGE\;TIME}} \) is cost of lost business (business interruption), \( \style{font-size:22px}{C_{IMPACT\;ON\;OTHER\;SECTORS}} \) is cost to restore the supply chain and to replace energy supply, and \( \style{font-size:22px}{C_{ENVIRONMENT}} \) is cost to restore the damaged environment.
There are also less quantifiable factors that could enter a terrorist’s estimation of the value of a target such as the reaction that can be achieved from society, such as an impact on stock markets, or a depression of the economy.
Similarly, estimate the effectiveness of protective measures, \( \style{font-size:22px}{E_P} \), or, inversely, the likelihood of a successful attack, \( \style{font-size:22px}{L_A} \), where:
The effectiveness of protective measures can be given a value (probability) from Table 17.
Such security analyses have placed LNG facilities generally below a number of other potential targets for both impact and for the likelihood of a successful attack.
Deciding on sufficiency of protective measures
The approach described previously selects strategies based on site-specific conditions and the expected impact of a spill on public safety and property. Less intensive strategies could often be sufficient in areas where the impacts of a spill are low. A two-tiered approach is illustrated in Table 18.
For any operation, some level of residual risk remains after continued risk reduction programs.
Security of ships and land-based LNG facilities
LNG ships may be physically attacked in a variety of ways to destroy their cargo, or commandeered for use as weapons against coastal targets. However, with their double-hull construction, robust cargo tanks with multiple layers of insulation, implementation of maritime security measures following the attack on the World Trade Center in New York in 2001, scrutiny from regulators, transit risk mitigation measures, and the training required for the crew, LNG ships are becoming less desirable targets.
Land-based LNG facilities may also be physically attacked with explosives or through other means. Alternatively, computer control systems may be “cyber-attacked,” or both physical and cyber attack may happen at the same time. Some LNG facilities may also be indirectly disrupted by other types of terror strikes, such as attacks on regional electricity grids or communications networks, which in turn could affect dependent LNG control and safety systems.
LNG facilities have been the subject of many analyses and studies by government authorities, research centers, and large insurance companies. Security experts do not consider LNG facilities to be a priority terrorist target. Studies concluded that full containment tanks were unattractive targets given the difficulty of undermining the structural integrity of these tanks. These facilities are identified as part of a country’s critical infrastructure and enhanced security measures have been implemented. However, a report from the US Congressional Research Service noted that pipelines and oil facilities have already been the targets of attacks throughout the world.
Security initiatives, RAMCAP
The US Department of Homeland Security (DHS), Directorate of Information Analysis and Infrastructure Protection (JAIP), Protective Services Division (PSD) contracted with the American Society of Mechanical Engineers Innovative Technologies Institute, LLC (ASME: ITI) to develop guidance on Risk Analysis and Management of Critical Asset Protection (RAMCAP). The objectives are:
- Improve the framework for Security Vulnerability Analysis (SVA) by providing a common basis for developing SVAs and for making vulnerability assessments and risk-based decisions;
- Improve the screening process used by the DHS for understanding the assets that are important to protect against terrorist attacks and to prioritize risk management steps.
This effort recognized that initially in the security field there were differing approaches, terminology, criteria, scales, and outputs. The development of RAMCAP is expected to provide more consistent terminology, criteria, and such, and consistent, objective, and integrated application of risk analysis methods. A driving force is that resources are limited and allocating resources requires prioritization. A seven step process has been outlined as the RAMCAP framework for interaction between facility owners/operators and the DHS (Table 19).
Security of offshore and remote LNG facilities
Some have suggested that new LNG import terminals should be built only offshore to keep associated terrorism hazards away from populated areas. Such a strategy may indeed reduce terrorism risks to ports and coastal communities, but it may also increase the risks to the terminals and terminal operators themselves. Because offshore oil and gas facilities are remote, isolated, and often lightly manned, some experts believe they are more vulnerable to terror attacks than landbased facilities. Offshore oil and gas facilities have not been frequent terror targets, but they have been attacked in the past during wartime and in territorial disputes. Since September 11, 2001, international concern about terrorist attacks on these platforms has grown. Some experts believe terrorist attacks against offshore platforms and remote land-based facilities have been on the rise recently in countries with a history of terror and extortion activity like Nigeria, Colombia, Yemen, and Indonesia, although many of these attacks may be motivated by finance/extortion, rather than politics. Disruption of any single offshore LNG terminal would not likely have a great impact on natural gas supplies, but if several new offshore terminals were attacked in the future, the effects on natural gas availability and prices could have serious consequences for energy markets. Onshore versus offshore siting alternatives should, therefore, be considered in the context of exposure to security breaches, public security, and the security of national gas supplies.
Similarly, the greater availability of spot cargoes versus long-term supply contracts means that disruption of supply is now easier to accommodate. In the past, there were only long-term contracts, and if a ship were lost there was no replacement immediately available. With spot cargoes, if one vessel is no longer available, it is readily replaced by a spot cargo.
Policy issues in LNG security
The LNG industry has taken significant steps to secure the LNG infrastructure. But continued progress in implementing and sustaining LNG security faces several challenges.
Some LNG operating companies have resisted suggestions that they pay more for public security. Others have expressed a willingness to pay for “excess” security only if it exceeds the level of government agency service ordinarily provided from corporate tax payments. It is difficult to predict how the public component of LNG security costs will evolve as the LNG industry grows. The public component might be expected to decrease, particularly if security threats decline in the medium-term. Altogether, the potential increase in security costs from expanding LNG infrastructure and shipping warrants a review of these costs, the public share and sustainability.
While acknowledging the potential terrorist threat, many experts, including those in the LNG industry, believe that public concern about threats to LNG infrastructure is overstated. Industry rep-resentatives argue that deliberately attacking an LNG facility to cause disruption, terror, and injury might perhaps be attempted, but remains extremely difficult to execute effectively. LNG proponents also believe that LNG facilities are relatively secure compared to other hazardous chemical and hy-drocarbon infrastructures, which also receive less public attention. However, it may be impossible for the LNG industry officials to ever prove that LNG infrastructure will not be targeted by terrorists. As the US FERC has remarked, “unlike accidental causes, historical experience provides little guidance in estimating the probability of a terrorist attack on an LNG vessel or onshore storage facility”. Because the probability and impact of a terrorist attack on LNG infrastructure cannot be known with certainty, policy makers, plant operators, emergency response specialists, and community leaders must ultimately rely on their judgment to decide on the adequacy of LNG security measures for a specific facility. Also what will adequately protect the public and what, if any, of the incremental security costs, personnel, and resources are to be provided from public funds.