Discover how Loran-C technology utilizes skywaves for navigation in this comprehensive article. Learn about the advantages and challenges of skywave reception, explore published DMAHTC corrections, and review a numerical example that illustrates key concepts. Gain insights into the dual nature of skywaves as both a boon and a bane for navigators, along with answers to frequently asked questions.
Skywave propagation of Loran-C signals is discussed in the main body of this handbook. As noted there, a portion of the Loran-C signal radiates upward and is reflected off the ionosphere before reaching the receiver – this is the skywave. Compared to the groundwave, the skywave differs in two key respects.
Introduction – Skywaves A Boon or a Bane?
First, from simple geometry it can be seen that the skywave signal travels a longer and less constant (because the height of the various layers of the ionosphere exhibits diurnal variability) distance to the receiver than the groundwave.
Second, the skywave is attenuated to a lower degree than the groundwave, because it passes through the atmosphere rather than directly over terrain and seawater. If the skywave signal is receivedrather than the groundwave – and this goes unrecognized – then the loran positions determined from the loran overprinted charts or the receiver’s coordinate conversion logic will be in error, because the correspondence between geodetic position and apparent TD differs, depending upon whether a groundwave or skywave signal is received.
Because the propagation characteristics (and, therefore, the geographic location of TDs) of skywaves are less predictable, the Loran-C system was designed to exploit groundwaves. In the normal Loran-C context, skywaves are principally a “nuisance” and various technical means, such as the location of the sampling or tracking point in the pulse and phase coding, have been devised to lessen the likelihood of skywave “contamination.”
Still, these measures are imperfect, particularly at long distances (i. e., areas outside of these depicted in the coverage diagram) from the transmitter and secondaries. At these extreme ranges, groundwaves are severely attenuated, but skywaves suffer less attenuation, with the result that skywave reception may be the only option. Moreover, exploitation of skywaves can substantially increase the usable range of Loran-C. Although skywave propagation is less predictable than for groundwaves, the Loran-C system can still be used with skywaves. Indeed, the earliest versions of the loran system were based upon skywave reception only.
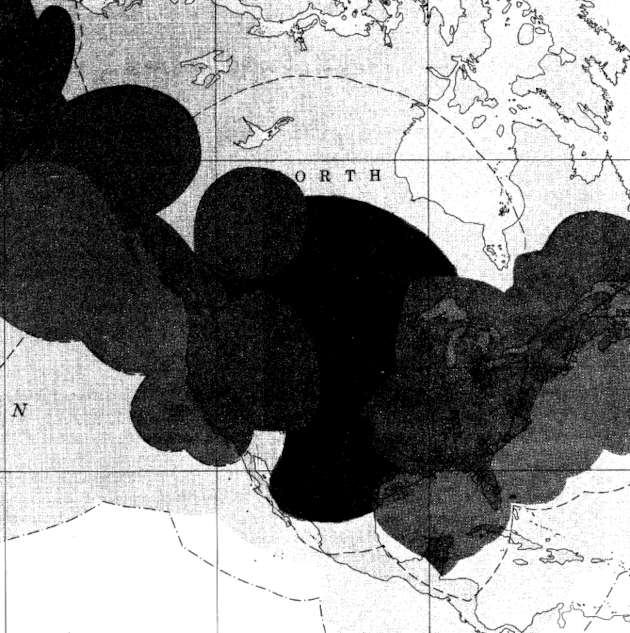
Figure 1 shows a portion of DMA Chart 5133. This figure shows the limits or loran groundwave reception (2 drms of < 1 500 ft and an SNR of at least 1:10), denoted by the dashed ine, and of skywave reception As defined by DMA.x (minimum SNR of 1:10, minimum crossing angle of 15 degrees and gradient of line position of less than 2 NM per usec), denoted by the combination dashed-dotted line. As can be seen, use of skywaves can substantially extend the limits of coverage of the Loran-C system.
In order to use skywaves, however, it is necessary to:
- Recognize that the receiver is tracking skywaves and;
- Apply appropriate corrections to the measured TDs (to account for propagation differences) to obtain corrected TDs that are used to determine position on a loran overprinted chart.
Indications of Skywave Reception
It is first necessary to determine exactly which signals (master or any of the secondary) are skywaves rather than groundwaves. Consult the owner’s manual for the particular loran receiver for detailed guidance. (The owner’s manuals for many makes and models do not address skywaves for navigation, but this is the first place to look.) The following general criteria are useful for this purpose.
- Skywave reception is much more likely outside the limits of conventional groundwave reception. Therefore, the vessel’s location should be considered. Anytime the vessel is outside the limits of the chain’s published coverage diagram, skywave reception is likely.
- A few older Loran-C receivers are equipped with a “sky” alarm or status indicator that alerts the user to skywave reception.
- Skywave reception is likely when the SNR is much larger than would be expected for groundwaves. (This serves as another example of the utility of recording the SNRs of master and secondary whenever a fix is determined. Without such data it is impossible to determine norms for comparison.).
- Skywave reception is indicated when SNRs vary more than “normal.” (Again, this indicates the utility of maintaining a performance log.).
- Skywave reception is likely if TDs vary more than normal.
- Skywave reception is likely if there are large apparent position errors.
The user should determine exactly which stations (master and secondary) exhibit these indications. This is important, because it is necessary to determine which TDs to correct if skywave data are to be used.
Options
Faced with the possibility (probability) of skywave reception, the user has two alternatives.
- Temporarily discontinue the use of Loran-C for navigation purposes until the vessel or aircraft has returned to the area of reliable groundwave coverage.
- “Correct” the apparent TDs of the signals, using correction factors explained below, and use the skywaves for position fixing.
Undoubtedly, option (1) is the “conservative” choice – and that recommended here if there are other suitable means of navigation at hand. Option (2) may be attractive if other methods of position fixing are unavailable or likewise unreliable. If option (2) is selected, the mariner or aviator must use loran position information with much more caution, for the following reasons.
- The navigator may “misdiagnose” skywave indications, and misclassify a groundwave as a skywave, or vice versa. In this event, the user would apply the wrong corrections to the measured TD. The “corrected” TD could be further in error than the uncorrected TD.
- The published correction factors are only average values. Propagation conditions vary over time, and these corrections do not reflect these temporal changes.
- Gradients and crossing angles of the loran LOPs may be “poor” in areas where skywave reception is likely. Therefore, the accuracy of the resulting fix may be much less than for groundwave reception in the chain’s groundwave coverage area.
In consequence, the Loran-C “fix” uncertainty is much greater in areas where skywave reception is likely. Confine this method of position fixing in “safe water” where larger fix uncertainties are more tolerable. Finally, cross-check any skywave “fixes” with those determined by other methods, such as observation of celestial bodies or use of GPS.
Published DMAHTC Skywave Corrections
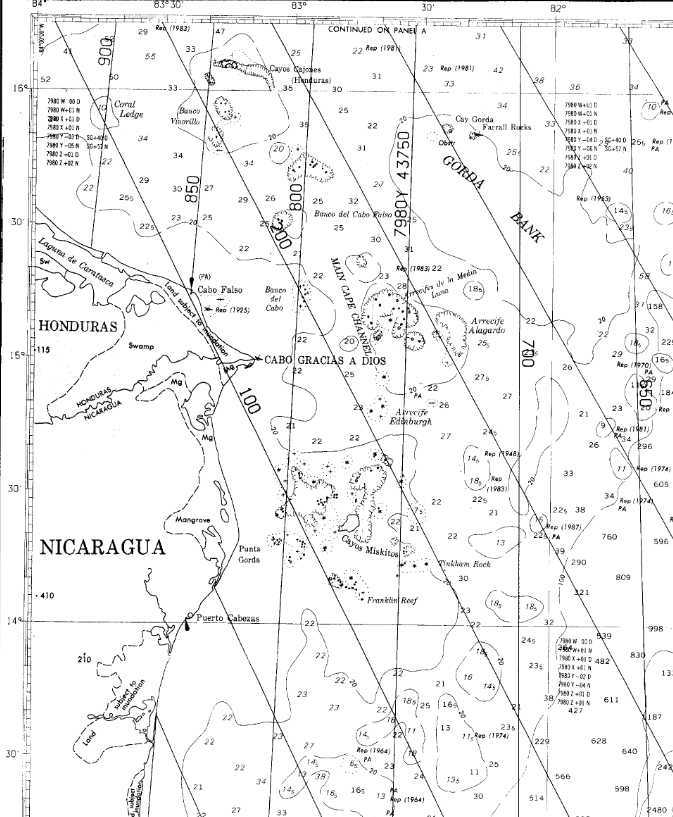
Figure 2 reproduces an extract from DMAHTC Chart 28001 that shows a portion of the Gulf of Mexico near the Honduras/Nicaragua border. Reference to Figure 1 (or the coverage diagrams provided in Introduction and Overview of Loran-C“Data Sheets and Coverage Diagrams”) indicates that this area is outside of the coverage diagram for the 7980 chain, yet still within the area of possible skywave coverage. And, as can be seen from examination of the actual chart legend, loran LOPs are printed for the Xray, Whiskey, Yankee, and Zulu secondaries of the 7980 chain.
The locations of the Loran-C TDs overprintedon this chart have been calculatedon the assumptionof groundwave propagation only. This convention is adopted not because groundwave reception is most likely in this area, but rather to provide a basis for applying skywave corrections to the measured TDs. Simply put, published adjustments are used to correct the observed TD to what it would be if only groundwave signals were received.
Read also: GDOP Explained and Illustrated
The chart section shown in Figure 2 is of conventional appearance except for the “data blocks” inserted at regular intervals of the intersections of meridians of longitude and parallels of latitude. On this chart, the data blocks are shown at each degree of latitude and for every two degrees of longitude. These data blocks provide the adjustments necessary for correcting measured TDs prior to plotting a position.
In areas where skywave reception is possible, there are four logical reception possibilities for each station pair. These are shown in Table 1; both signals groundwave, both signals skywave and two possibilities of mixed groundwave – skywave reception.
| Table 1. Logical possibilities for groundwave skywave reception from master and secondary | |||
|---|---|---|---|
| Secondary Signal | Type of Signal | Master Signal | |
| Groundwave | Skywave | ||
| Groundwave | Use loran LOPs as printed on chart | Use corrections prefixed with “SG“ | |
| Skywave | Use corrections prefixed with “GS“ | Use special correction shown immediately to right of printed rate | |
However, at a particular point on the earth, not all of these combinations are equally likely. At some locations far removed from both master and secondary, only skywave reception for both master and secondary is possible. At other locations, groundwave reception is also possible for either the master or secondary signal. Likely combinations of groundwave and skywave reception are identified in the dsta blocks.
A Numerical Example
Observed TD readings do not need to be corrected if both signals are determined to be groundwaves. However, if one or both of the master secondary signals involve skywaves, then corrections are necessary. These skywave corrections to the observed TDs are best illustrated by a numerical example. Consider first the data block found in thevicinity of latitude 16 degrees north and 82 degrees west, a position slightly northeast of Gorda Bank on the chart. For ease of reading, Table 2 reproduces the data block found at this location in Figure 2.
| Table 2. Skywave correction extract from L: 16° 00,0 N, Lo: 82° 00,0 W (Northeast of Gorda Bank) on DMA Chart 28001 Scale 1:1 300 000 at L: 16° 00 | |
|---|---|
| 7980 W +01 D | |
| 7980 W +01 N | |
| 7980 X +01 D | |
| 7980 X +01 N | |
| 7980 Y -04 D | SG +40 D |
| 7980 Y -06 N | SG +57 N |
| 7980 Z -01 D | |
| 7980 Z -02 N | |
The first line, “7980 W +01D” signifies that, if the 7980 W rate is being used (7980 W), the observation is takenduring daylight hours (“D“) and both the master and Whiskey secondary signals are skywaves, then 1 microsecond (+01) should be added (+) to the observed TD for this station pair to obtain a corrected TD for position plotting. The second line, “7980 W +01N,” indicates that if, the observation is taken at night (“N“) i. e., between the hours of sunset and sunrise and both the master and secondary signals are skywaves, then 1 microsecond should also be added to the observed TD to provide a corrected TD for position plotting. These “skywave-skywave” corrections are typically not large.
Skip down to the fifth and sixth lines in the data block. The entry, “7980 Y -04D,” signifies that if both the master and Yankee secondary are skywaves and the time of observation is from sunrise to sunset (day, or “D“), 4 microseconds are to be subtracted (-04) from the observed TD to produce a corrected TD for this rate. Were this observation taken at night, 6 microseconds would have to be subtracted (“-06N“) from the observed TD.
Now, notice the entry “SG+40D” to the right of “7980 Y -04D.” This entry signifies that if the master is a skywave signal, and that for the Yankee secondary is a groundwave (SG), and the observation is taken during the day (“D“), then a 40 microsecond correction is to be added (“+40D“)to the observed TD. If the observation were taken at night, a 57 microsecond correction would be necessary. These “mixed corrections” are substantial in this example. The gradient of the Yankee secondary in this area is approximately 12 NM per 50 usec (1 500 ft/usec), so the +57 usec nighttime correction would shift the vessel’s (or aircraft’s) position approximately 13,7 miles further west.
Note that the largest corrections always occur when there is mixed skywave-groundwave reception. This is initiatively reasonable, because of differences in the propagation path between skywaves and groundwaves.
Questions and Answers About This Example
The careful reader may have a few questions about the numerical example at this point. Possible questions and answers are summarized below.
Question: Referring to the information given in the fifth line of the data block, what if the secondary were a skywave and the master a groundwave?
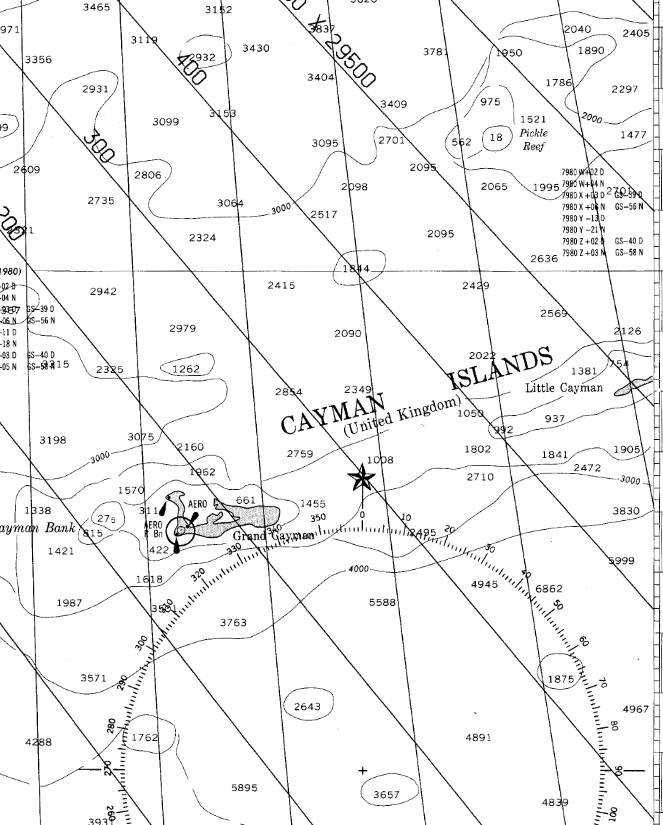
Answer: In this case the correction would be identified as “GS,” rather than “SG.” And, indeed, depending upon the relative locations of the master and the secondary, “GS” corrections are provided on these charts. Figure 3, for example, shows another excerpt from the same chart as Figure 2. The area detailed is in the general vicinity of the Cayman Islands. Note the number of “GS” corrections shown in the surrounding data blocks.
Question: Fair enough, but why isn’t a “GS” correction included in the data block for the Gorda Bank location?
Answer: The TD corrections are only given for the likely reception possibilities. At this location, it is not likely that the receiver would pickup a groundwave from the master and a skywave from the Yankee secondary. To see why this is true, consider the relative distances from this point to the master (located in Malone, FL) and the Yankee secondary (located in Jupiter, FL). The Yankee secondary is closer to this point than the master, and therefore, it is more likely that any groundwave would be received from the Yankee secondary than from the master. In contrast, in the vicinity of the Cayman Islands, it is more likely that groundwaves would be received from the master. Finally, it should be noted that skywave correction data blocks are omitted entirely in areas where only groundwave reception is likely.
Question: Why isn’t there an “SG” correction given in the skywave data block near the Gorda Bank shown in Table 2 for any rate other than the master Yankee station pair?
Answer: Reception of a skywave from the master and groundwave signals from these other secondaries (Whiskey, Xray, and Zulu) is very unlikely at this location. Therefore, no corrections are provided. Refer to the data block immediately south of that usedin this numerical example, i. e., that at latitude 14 degrees north and longitude 82 degrees west. Note that no “SG” corrections are given for any of the rates shown in this block. This location is approximately 60 miles farther south and groundwave reception of the Yankee secondary is unlikely at this location. You simply “run out of groundwave” as you go farther from the station.
Question: This is clear now, but suppose that (in the location of the first example), notwithstanding the likelihood of this combination, my receiver indications suggested that the master signal were groundwave, and the secondary skywave?
Answer: Check these indications more carefully. This is an unlikely reception combination at this location. In any event, no correction is published for this combination, so the mariner or aviator should regard any position information as tentative. Referring to the chart in this general location, note also that the gradients are relatively large, at least for some secondaries (for example, although the gradient of the Xray secondary is approximately 700 ft/usec, that for the Whiskey secondary is approximately 1 700 ft/usec). As well, the crossing angles are much less than in the designated coverage area. The best crossing angle among these station pairs, Xray and Zulu, is only 30 degrees, and others are less. The LOPs of the Yankee and Zulu secondaries, for example, are nearly parallel!
Summary
Skywaves can be used for navigation. For this purpose it is necessary to correct the observed TDs prior to plotting. Corrections can be found on DMAHTC charts in areas where skywaves can be used.
Skywave corrections shown here must be used with core, and only in circumstances where larger position errors are tolerable. Cross check any skywave fixes with those determined by other methods.
Use of skywaves considerably extends the Loran-C coverage area. However, positions so determined are less accurate, partially because skywave propagation is more difficult to predict, and partially because of the “poor geometry” of LOPs in the skywave coverage area.

- Abramowitz, M., et al. “Approximate Method for RapidLoran Computation,” Navigation; Journal of the Institute of Navigation, Vol. 4, No. 1, March 1954, pp. 24-27.
- Alexander, G. “The Premier Racing Tool,” Ocean Navigator, Issue No. 20, Jul/Aug 1988, pp. 37, er seq.
- Anonymous. “Loran: Installation Pitfalls, and How Friendly Should Your Loran Be?” Practical Sailor, Vol. 11, No. 24, December 15, 1985, pp. 1, et seq.
- Anonymous. Manual on Radio Aids to Navigation, International Associationof Lighthouse Authorities, Nouvelle Adresse, 13 Rue Yvon-Villarceau 75 116, Paris, 1979.
- Appleyard, S. F. Marine Electronic Navigation. Routledge and Kegan Paul Ltd., Boston, MA, 02108, 1980.
- Ashwell, G. E., B. G. Pressey, and C. S. Fowler. The Measurement of the Phase Velocity of Ground Wave Propagation at low Frequencies Over a Land Path. Proceedings of the Institute of Electrical Engineering (London) 100 Part III, 1953.
- Bedford Institute of Oceanography. Loran-C Receiver Performance Tests, Bedford Institute of Oceanography, P. O. Box 1006, Dartmouth, NovaScotia, Canada, B2Y 4A2.
- Blizard, M. M. et al. Harbor Monitor System Final Report, CG-D-17-87, ADA 183 477, Dec. 1986, Available through the National Technical Information Service, Springfield, VA, 22161.
- Blizard, M. M., Lt. and CWO 3 D. C. Slagle. Differential Loran-C System Final litter, Draft, United States Coast Guard, January 1987.
- Blizard, M. M. and D. C. Slagle, “Loran-C West Coast Stability Study,” Proceedings of the Fourteenth Wild Goose Technical Symposium, Wild Goose Association, Bedford, MA, 1985.
- Brogdon, B., “Loran Expansion,” Ocean Navigator, Issue No. 42, SeptfOct 1991, pp. 87, et seq.
- Brogdon, W. “Loran Hook, a Little Known, Foible Explained,” Boating, August 1991, p.42.
- Brogdon, W. “Electronic Errors,” Ocean Navigator, Issue No. 40, June 1991,pp. 70, etseq.
- Brogdon, W. “Pathfinders,” American Hunter, Vol. 19, No. 7, July 1991.
- Burt, W. A., et al. Mathematical Considerations Pertaining to the Accuracy of Position, Location, and Navigation Systems, Part I, Stanford Research Institute, 1966. Available from National Technical Information Service, AD-629609, US Department of Commerce, 5825 Port Royal Road, Springfield, VA 2215 1.
- Canadian Coast Guard, Aids and Waterways Branch. A Primer on Loran-C, Ottowa, Ontario, Canada, 1981.
- Connes, K. The Loran, GPS & NAVICOMM Guide, Butterfield Press, 1990.
- Culver, C. “A New High Performance Loran Receiver,” Proceedings of the Sixteenth Annual Technical Symposium, The Wild Goose Association, 20-27 October 1987, pp. 282, et seq.
- Dahl, B. “Adopting Loran-C to Everyday Navigation,” Cruising World,May 1983,pp. 40-45.