This article covers information about the State of Liquefied Petroleum Gas Market and shows the diagrams, graphs and tables of LPG trade, macroeconomics, analysis, fleet etc.
Summary
- Macroeconomic overview.
- Trade analysis.
- LPG carrier fleet.
- Market Balances, Rates & Prices.
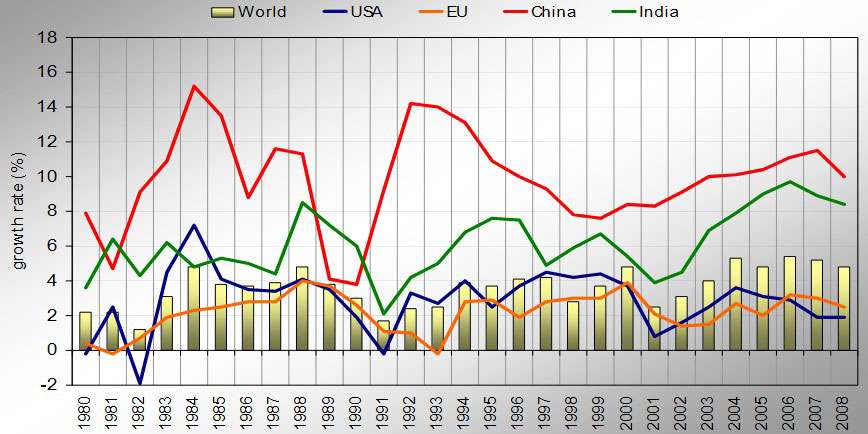
Macroeconomic overview
GDP growth
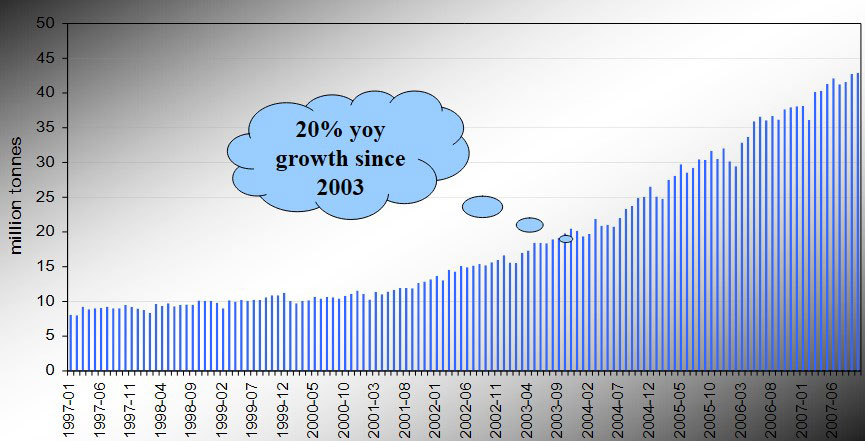
Steel production in China 1997 to 2007 (monthly)
Trade Analysis
LPG…why is it a growing market?
- Seaborne trade forecast to increase at a strong rate => increase in required tonnage / gas capacity i. e. demand for ships.
- High economic growth in US, EU, Japan and China will contribute to LPG demand growth.
- High price of crude oil & natural gas prices encourages LPG consumption.
- LNG associated production (Qatar 2010…10 m tonnes).
- Popular alternative energy source to oil & coal (energy diversification).
- Environmental degradation is a salient issue.
LPG…what are the risks?
- Weak economic growth in US, EU, Japan and China.
- Dampen demand / consumption.
- Exporting countries reduce LPG made available for export in order to service domestic demand.
- Middle East…?
And the fleet…
- Fleet growth exceeds demand growth…causing an erosion in freight earnings.
- A likely scenario.
Industry view
Current situation
Significant capacity to be added to the LPG carrier fleet through to 2010
- Ocean Shipping Consultants.
- One year TC rates set to fall through to 2011.
- Despite increases in LPG demand and supply the increase in fleet capacity is forecast to have a significant negative impact on freight rates in the near term.
- Harry Vafias.
- Believes that fleet growth will be absorbed by fleet replacement and stable demand.
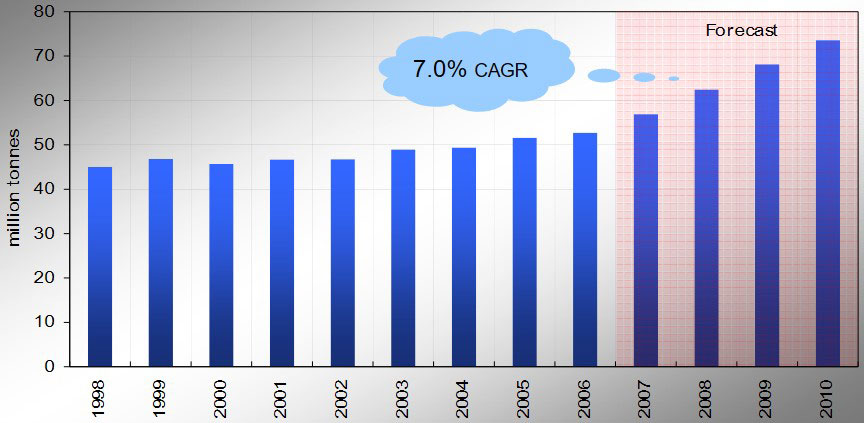
- MSI data reveals strong demand outlook through to 2010 – CAGR of 7,0% for LPG seaborne trade would indicate a positive trade outlook.
LPG trade to 2010 – million tonnes
LPG Seaborne Trade
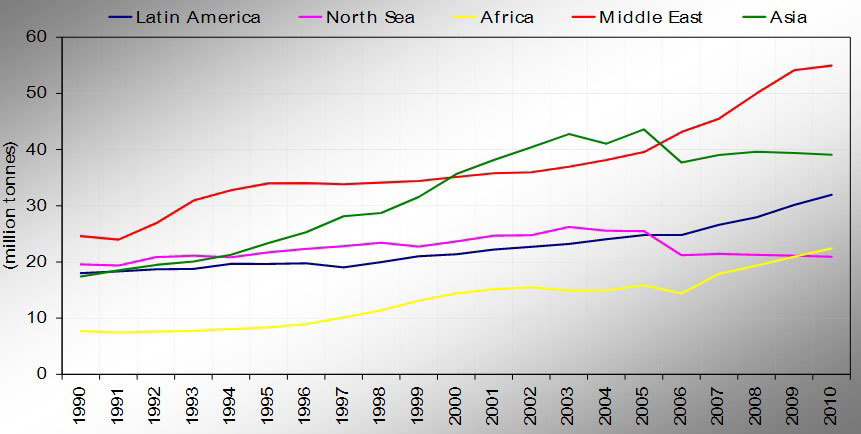
LPG Production
- USA & Saudi Arabia are largest producers…Saudi Arabia #1 Exporter…USA marginal exporter.
- China, India & Russia increasing production substantially – growth rates exceed global growth rate.
| LPG Producer (000 tonnes) | 1995 | 2005 | CAGR |
|---|---|---|---|
| USA | 45,6 | 41,8 | -0,1 % |
| Saudi Arabia | 18,0 | 18,9 | 0,04 % |
| China | 3,6 | 13,7 | 14,3 % |
| Russia | 5,1 | 8,3 | 5,1 % |
| India | 3,3 | 7,6 | 8,7 % |
| Global total | 171,1 | 218,7 | 2,5 % |
LPG Production by Region 1990 to 2010
LPG Consumption
Japan, USA and China are the largest consumers of LPG…42 % of world total.
- Japan huge importer – Seaborne Imports comprise 75 % of LPG consumption.
- USA & China next biggest importers but dependence on imports relative to consumption is less than other countries…China (30 %) & USA (22 %).
| LPG Consumer (000 tonnes) | 1995 | 2005 | CAGR |
|---|---|---|---|
| USA | 48,8 | 50,4 | 0,3 % |
| China | 5,9 | 20,6 | 13,3 % |
| Japan | 19,3 | 18,6 | -0,01 % |
| Russia | 4,2 | 6,6 | 5,0 % |
| India | 3,9 | 9,9 | 9,7 % |
| Global total | 166,1 | 215,2 | 2,6 % |
LPG Carrier Fleet
Existing fleet Vs Orderbook
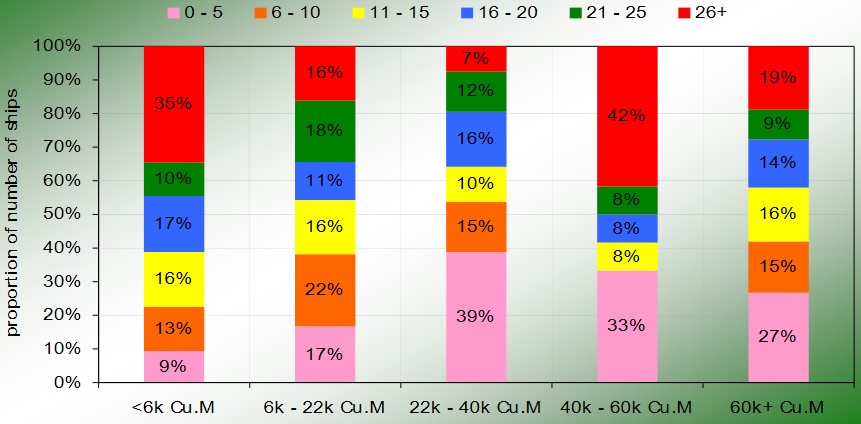
LPG carrier fleet is aged:
- 42 % 20+ years old (no. ships).
- 33 % 20+ years old (GT).
- 33 % 20+ years old (gas capacity).
An abundance of tonnage can be regarded as prospective scrap.
| Existing Fleet | Orderbook | Orderbook/Existing Fleet Ratio | |
|---|---|---|---|
| 1 081 ships | 192 ships | 17,5 % => Number of Ships | |
| 10,4 million GT | 4,4 million GT | 42,3 % => Gross Tonnage | |
| 15,7 million Cu. M | 7,1 million Cu. M | 45,2 % => Gas Capacity |
Fleet Compound Annual Growth Rate (CAGR) of 6,0 % from 2007 to 2010.
| Fleet development…million Cu. M | |||||
|---|---|---|---|---|---|
| Size profile Cu. M | Fleet | Orderbook | Total | Fleet/Orderbook Ratio | % change in fleet |
| <6 k | 1,7 | 0,2 | 1,8 | 12,0 % | 10,9 % |
| 6 k – 22 k | 1,9 | 0,6 | 2,5 | 31,5 % | 33,7 % |
| 22 k – 40 k | 2,1 | 0,7 | 2,8 | 33,3 % | 34,8 % |
| 40 k – 60 k | 1,3 | 0,0 | 1,3 | 0 % | 0 % |
| 60 k | 8,8 | 5,3 | 14,1 | 60,2 % | 60,8 % |
| Total | 15,7 | 6,9 | 22,6 | 43,9 % | 43,6 % |
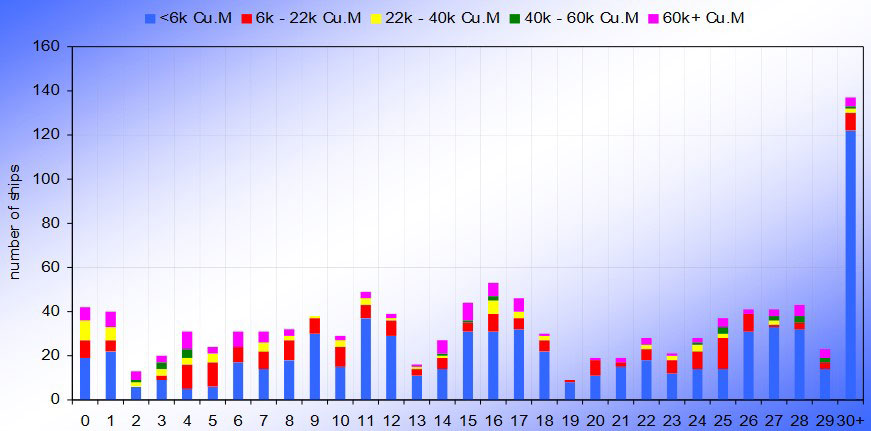
Age Profile – number of ships
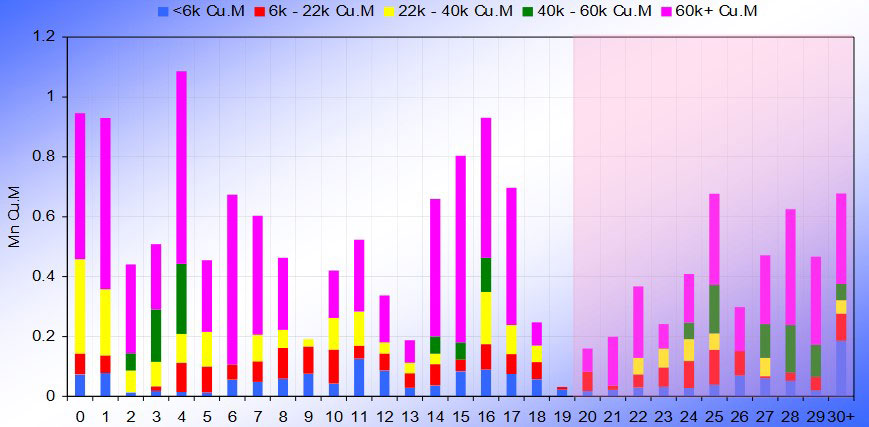
Age Profile – gas capacity
Age Profile – proportion of number of ships
Fleet versus Orderbook – Cu.M

Fleet versus Orderbook – number of ships

Delivery Schedule – number of ships
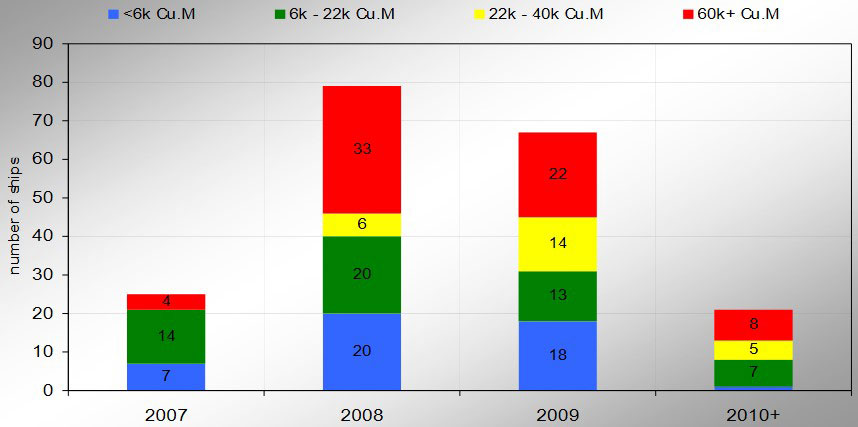
Delivery Schedule – Mn Cu.M

Market Balances, Rates & Prices
| Balance of shipping demand and ship supply – ex scrapping | |||||||
|---|---|---|---|---|---|---|---|
| 2006 | 2007 | 2008 | 2009 | 2010 | |||
| Deliveries | number | 41 | 59 | 79 | 67 | 20 | |
| mGT | 0,6 | 0,9 | 1,9 | 1,5 | 0,5 | ||
| Mn Cu. M | 0,9 | 1,4 | 3,1 | 2,4 | 0,8 | ||
| Fleet Development | number | 1 064 | 1 123 | 1 202 | 1 269 | 1 289 | |
| mGT | 10,3 | 11,2 | 13,1 | 14,7 | 15,2 | ||
| Mn Cu. M | 15,6 | 17,0 | 20,1 | 22,5 | 23,3 | ||
| Growth | % Mn Cu. M | 6,0 % | 8,9 % | 18,1 % | 12,1 % | 3,6 % | |
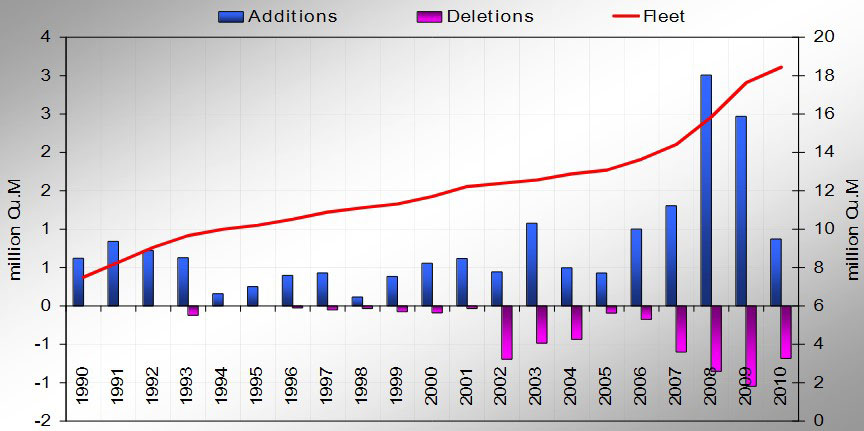
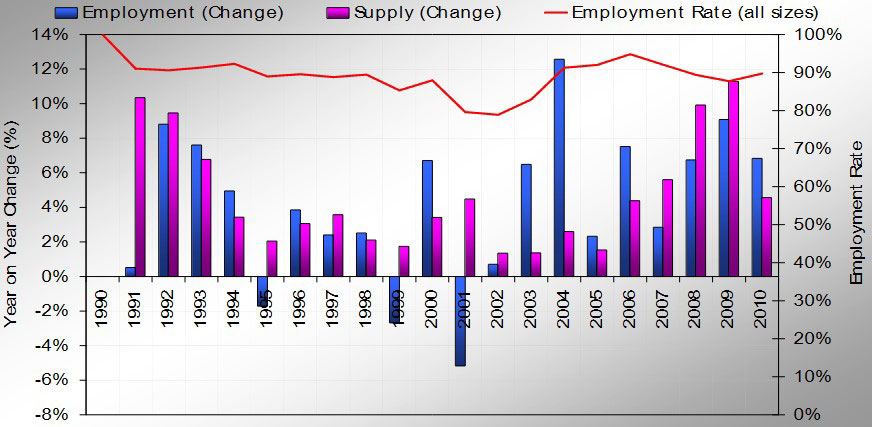
Fleet Development 1990 to 2010…what can we be relatively certain about?
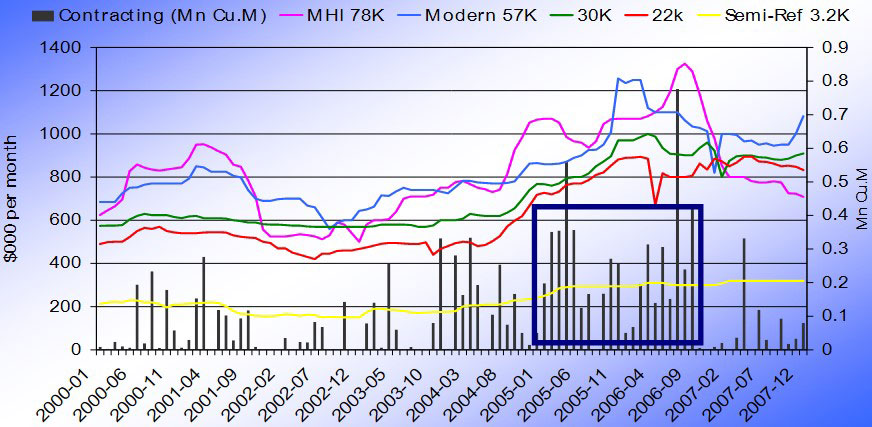
Spot Rates

LPG TC Vs Contracting
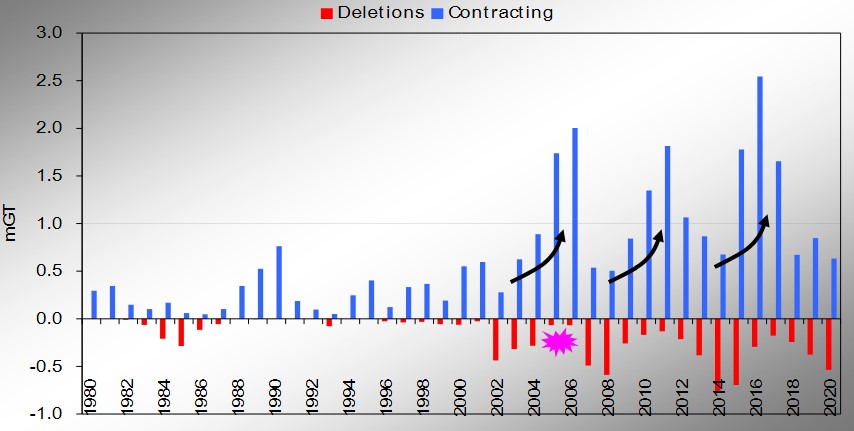
LPG carrier supply responses – contracting & deletions
Vessel Employment (Demand by Cargo – All Sizes)
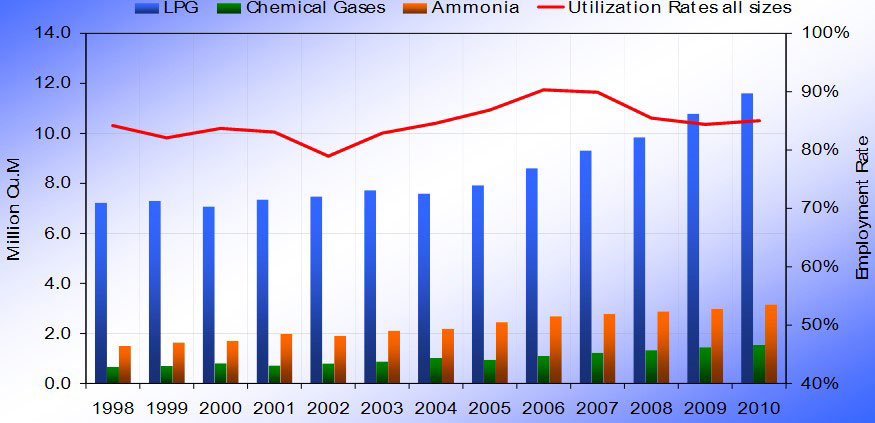
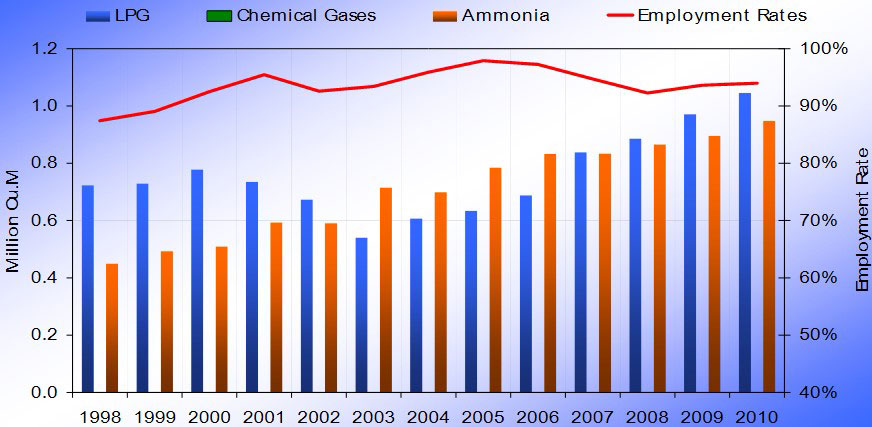
Vessel Employment (6 k – 22 k Cu. M Demand by Cargo)

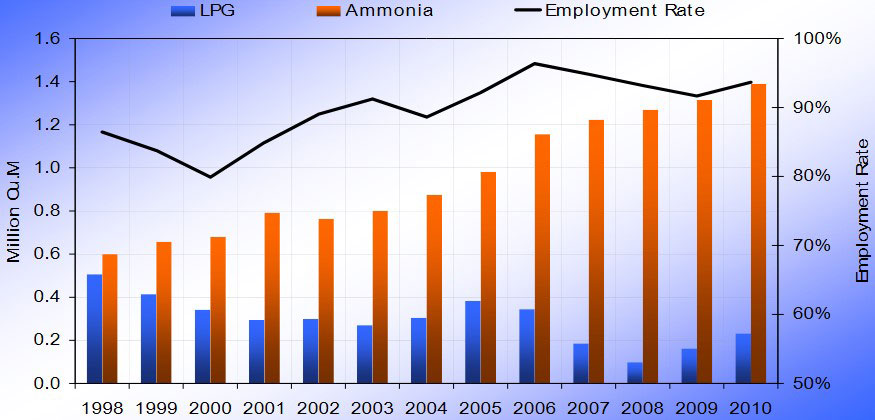
Vessel Employment (22 k – 40 k Cu. M Demand by Cargo)
Vessel Employment (40 k – 60 k Cu. M Demand by Cargo)
Vessel Employment (60+ k Cu. M Demand by Cargo)

LPG Carrier Market Fundamentals
| Vessel Operating Costs 2003 – 2007 (US dollar per day) | ||||||
|---|---|---|---|---|---|---|
| Manning | H&M | P&I | R&M | Others | Total | |
| 2003 | 2 670 | 355 | 215 | 1 875 | 2 385 | 7 500 |
| 2004 | 2 770 | 465 | 265 | 1 960 | 2 480 | 7 490 |
| 2005 | 2 670 | 445 | 290 | 2 250 | 2 625 | 8 280 |
| 2006 | 2 935 | 470 | 300 | 2 195 | 2 960 | 8 860 |
| 2007 | 3 050 | 500 | 315 | 2 095 | 2 995 | 8 995 |
| % increase | 14 % | 41 % | 47 % | 12 % | 26 % | 20 % |