The importance of gas-condensate reservoirs has increased considerably in the last few years because of the increased demand for all types of hydrocarbon energy sources and because, as deeper drilling occurs, more and more condensate reservoirs are being discovered.
- Well Testing and Sampling
- Well Conditioning and Sampling Procedures
- Laboratory Testing
- Calculation of Initial In-Place Gas and Condensate
- Composition Analysis Not Available
- Compositional Analysis Available
- Recovery Estimates
- Laboratory Simulation
- Flash Calculations
- Empirical Correlations for Estimating Performance
- Effects of Water Drive
- Gas Cycling
- Areal Sweep Efficiency (EA)
- Vertical Sweep Efficiency (Ev)
- Displacement Efficiency (ED)
- Reservoir Cycling Efficiency (ER)
- Feasibility of Gas Cycling
Gas-condensate reservoirs may occur at pressures below 2 000 psi and temperatures below 100 °F and probably can occur at any higher fluid pressures and temperatures. Most known gas-condensate reservoirs are in the range of 3 000 to 6 000 psi and 200 to 400 °F. These pressure and temperature ranges, together with wide composition ranges, provide a great variety of conditions for the physical behavior of gas-condensate deposits. This emphasizes the need for engineering studies of each gas-condensate reservoir in order to arrive at the best mode of development and operation.
Condensate reservoirs include both wet gas and retrograde condensate types, as described in Best and Most Widely Methods to Perform Necessary Calculations with a GasMethods to Made Calculations for a Gas Producing System. In both types the fluid exists as a single phase gas at initial reservoir conditions, the distinction being that liquid is formed in the reservoir only for the retrograde type.
A rough classification can be made based on the performance of the reservoir at initial conditions. If initial producing gas-oil ratio (GOR) exceeds about 15 000 scf/STB, and pressure and temperature do not exceed 8 000 psia and 225 °F, respectively, it is likely that no liquid will form in the reservoir.
Where producing gas-oil ratios exceed 6 000 but not 15 000 scf/STB, the reservoir may experience retrograde behavior. Under these conditions it is important that a representative reservoir fluid sample be obtained and a pressure-volume-temperature (pVT) analysis be made. This will permit planning for the most efficient and profitable development of the reservoir. Where the initial gas-oil ratio is between 3 000 and 6 000 scf/STB, the reservoir may contain either a volatile oil or a retrograde gas condensate. A representative fluid sample can be obtained and pVT studies made to make the distinction between the two types. The distinction is important, since optimum exploitation for the two different types of reservoirs may be substantially different. Where spacing regulations exist, spacing would normally be wider for a “gas” reservoir as opposed to an “oil” reservoir. These regulations recognize the increased mobility of gas, as contrasted with oil and the different migration capabilities of each during producing operations.
Below an initial producing gas-oil ratio of 3 000 scf/STB, the reservoir will contain oil, volatile or otherwise. It is theoretically possible to have a retrograde gas condensate reservoir with an initial producing gas-oil ratio as low as 2 000 scf/STB, but this would take a unique combination of very high discovery pressure (exceeding 8 000 psia), modest temperatures, and high concentrations of intermediates, C2 through C6.
Table 1 shows the mole compositions of a typical dry gas, single-phase wet gas, retrograde gas condensate, and a volatile oil reservoir.
| Table 1. Mole Composition of Typical Hydrocarbon Reservoir Fluids | ||||
|---|---|---|---|---|
| Component | Dry Gas | Single Phase Wet Gas | Retrograde Gas Condensate | Volatile Oil |
| C1 | 96,0 | 90,0 | 75,0 | 60,0 |
| C2 | 2,0 | 3,0 | 7,0 | 8,0 |
| C3 | 1,0 | 2,0 | 4,5 | 4,0 |
| C4 | 0,5 | 2,0 | 3,0 | 4,0 |
| C5 | 0,5 | 1,0 | 2,0 | 3,0 |
| C6 | – | 0,5 | 2,5 | 4,0 |
| C7+ | – | 1,5 | 6,0 | 17,0 |
| 100,0 | 100,0 | 100,0 | 100,0 | |
| Mol. Wt. C7+ | – | 115 | 125 | 180 |
| GOR, scf/STB | High | 26 000 | 7 000 | 2 000 |
| Tank Gravity, °API | – | 60 | 55 | 50 |
| Liquid Color | – | Water White to Light Yellow | Light Yellow to Yellow | Amber to Darker Colors |
Picture 1 illustrates a pressure-temperature phase diagram for a reservoir fluid.

The development of this diagram assumes that volume and the total composition of the fluid are constants. The figure is useful as a guide to relationships among the several reservoir fluid types but is not truly representative of all types since both single phase gas reservoirs and oil reservoirs are represented, with only pressure and temperature allowed to change. However, it is useful for descriptive purposes.
Single-phase gas reservoirs are shown by point A to the right of the cricondentherm. Pressure depletion with production at constant reservoir temperature results in the gas remaining as gas. However, cooling and pressure drop in the well bore and surface facilities allow the condensing of hydrocarbons along line A to A2.
Retrograde gas condensate reservoirs exist at pressures sufficient to be at or above the upper boundary of the two-phase envelope and at a temperature between the critical and cricondentherm values. Frequently, retrograde gas condensate reservoirs are found to be on, or very close to, the dew-point line at the time of discovery. Apparently this is due to the presence of a large percentage of intermediates (C1 to C6). It is also quite common to find a small volatile oil rim in the reservoir. By definition, in this latter instance the gas cap would be exactly at the Dew Point – Definition and Pronunciationdew point. Should the observed dew point in the laboratory duplicate the discovery pressure within a few percent, an oil rim would probably be present.
Picture 2 presents descriptive phase diagrams for a gas cap gas and oil zone fluid for the two cases of a retrograde gas cap, and a nonretrograde gas cap.

Notice the superimposing of the diagrams at the time of discovery, since phase equilibrium exists.
Well Testing and Sampling
Proper testing of gas-condensate wells is essential for ascertaining the state of the hydrocarbon system at reservoir conditions and for planning the best production and recovery program for the reservoir. Without proper well tests and samples, it would be impossible to determine accurately the phase conditions of the reservoir contents at reservoir temperature and pressure and to estimate accurately the amount of hydrocarbon materials in place.
Tests are made on gas condensate wells for a number of specific purposes: to obtain representative samples for laboratory analysis, for identifying the composition and properties of the reservoir fluids; to make field determinations of gas and liquid properties; and to determine formation and well characteristics, including productivity, producibility, and injectivity. The first consideration for selecting wells for gas-condensate fluid samples is that the well be far enough removed from the “black-oil ring” (if present) to minimize any chance that the liquid oil phase will enter the well during the test period. A second and highly important consideration is the selection of wells with productivities as high as possible, so that minimum pressure drawdown will occur in actually acquiring the reservoir fluid samples.
Well Conditioning and Sampling Procedures
Proper well conditioning is essential to obtaining representative samples from the reservoir. The best production rates prior to and during the sampling procedure have to be considered individually for each reservoir and for each well. Usually the best procedure is to employ the lowest rate that results in smooth well operation and the most dependable measurements of surface products. Minimum drawdown of bottom-hole pressure during the conditioning period is desirable, and the produced gas-liquid ratio should remain constant (within about 2 %) for several days; the less permeable reservoirs require longer periods. The further the well deviates from a constant producing gas-liquid ratio, the greater the likelihood that the samples will not be representative.
Recombined separator samples from gas condensate wells are usually considered more representative of the original reservoir fluid than are bottom-hole samples. The tubing strings of gas-condensate wells almost invariably contain both liquid and gas, usually with a liquid layer adhering to the tubing walls making it very difficult to obtain a representative sample from such a stream by employing bottom-hole samplers. In addition, the relatively large quantities of material required for adequate laboratory studies favor surface sampling.
The original reservoir fluid cannot be simulated in the laboratory unless accurate field measurements of all the separator streams are taken. If the produced gas-condensate ratio from field measurements is in error by as little as 5 %, the dew point pressure determined in the laboratory may be in error by as much as 100 psi.
Separator pressures and temperatures should remain as constant as possible during the well conditioning period; this will help maintain constancy of the stream rates and the observed hydrocarbon gas-liquid ratio.
Laboratory Testing
With laboratory equipment, pressure-depletion tests can be made on a gas-condensate reservoir fluid in such a manner as to simulate pressure depletion of the actual reservoir, usually assuming that retrograde liquid appearing during pressure reduction would remain immobile in the reservoir. This assumption applies in those cases for which volume of condensation is low enough that liquid saturation of the rock pores remains too low to provide significant permeability to the retrograde liquid. However, there are cases wherein reduction of pressure isothermally would condense relatively large volumes of liquid in the pores, raising the liquid saturation high enough for some liquid to migrate to producing wells. If preliminary tests indicate this possibility, it is then necessary to obtain relative-permeability curves for the particular rock-liquid system to adjust the predicted behavior of the reservoir.
The actual test procedure for simulating pressure depletion (with immobile reservoir liquid) in a laboratory visual cell is to place the properly recombined reservoir fluid sample of known total composition in the cell at original reservoir pressure and temperature. Maintaining the cell volume and temperature constant (to simulate a constant-volume reservoir), pressure is reduced stepwise at about 500 psi increments by removing gas. The volumes of gas and liquid (below the dew point) remaining in the cell are recorded. The gas removed at each step is measured and analyzed. The fractional analyses yield composition information for calculating the condensable liquids content of the gases produced at all stages of pressure depletion. Condensible liquids content can also be determined experimentally by subjecting the cell output gas stream to field separation conditions, but this usually is not considered necessary. The computation of natural gas content is useful in designing gasoline plants for recovery of liquid products.
The stepwise pressure-depletion tests are usually carried to some level representing abandonment pressure of the reservoir, after which the quantity and composition of the fluids remaining in the cell are determined. This provides a means of checking the quantity of each component produced in the gases during pressure-depletion, since original system composition is known. An example of a pressure-depletion test starting at the dew point pressure of 4 265 psia is shown in Picture 3.

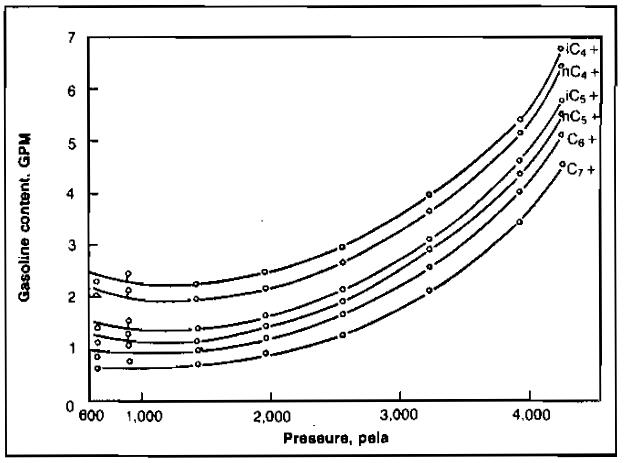
The gasoline content of the heavier components in the produced gas is illustrated in Picture 4.
Calculation of Initial In-Place Gas and Condensate
The initial amounts of both the gas and the condensate in a reservoir can be calculated on a unit volume basis by two methods. The more accurate method requires a compositional analysis of the reservoir fluid, but an estimate can be made if limited data are available. A procedure and example calculation for each case are presented.
Composition Analysis Not Available
The initial in-place gas and oil (condensate) for gas-condensate reservoirs, both retrograde and nonretrograde, may be calculated from generally available field data by recombining the produced gas and oil in the correct ratio to find the average specific gravity (air = 1,00) of the total well fluid, which is presumably being produced initially from a one-phase reservoir. The method may also be used to calculate the initial oil and gas in gas caps.
Let:
- R = initial surface gas-oil ratio of the production, scf of dry or residue gas per barrel of oil;
- γo = specific gravity of the tank oil (water = 1,00);
- Mo = molecular weight of the tank oil, and;
- γg = average specific gravity of the gas produced from the surface separator(s), air = 1.00
Standard conditions are 14,7 psia and 60 °F, at which conditions the molar volume is 379,4 scf/mole (other base conditions yield different molar volumes).
Then, on the basis of one barrel of tank oil and R standard cubic feet of separator or residue gas, the mass of total well fluid mw is:
The total moles of fluid in one barrel of oil and R cubic feet of gas is:
Hence the molecular weight of the total well fluid Mw is:
and the specific gravity of the well fluid is Mw/28,97, or:
If the molecular weight of the tank oil is not known it may be estimated using the following formula developed by Cragoe:
Example 1:
Calculate the Initial oil and gas in piace per acre-foot for a gas-condensate reservoir, given:
- Initial pressure = 2 740 psia;
- Reservoir temperature = 215 °F;
- Average porosity = 25 %;
- Average connate water = 30 %;
- Daily tank oil = 242 bbl;
- Oil gravity, 60 °F = 48,0 °API;
- Daily separator gas = 3 100 MCF;
- Separator gas gravity = 0,650;
- Daily tank gas = 120 MCF;
- Tank gas gravity = 1,20.
Solution:
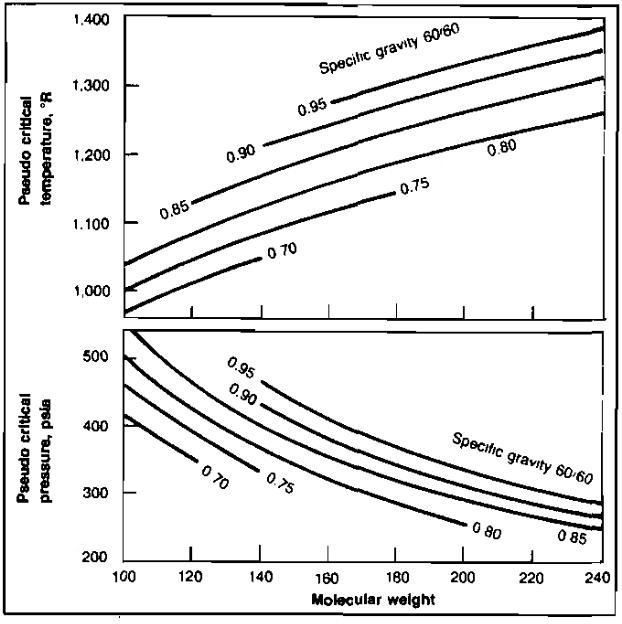
From Picture Best and Most Widely Methods to Perform Necessary Calculations with a Gas“Pseudocritical properties of natural gases” Tc = 425 °R and pc = 652 psia using the condensate curves. Then Tr = 1,59 and pr = 4,20, from which the gas deviation factor is 0,82 at 2 740 psia and 215 °F. Then the total initiai gas in place per acre-foot of bulk reservoir rock is:
Since the volume fraction equals the moie fraction in the gas state, the fraction of the total that is produced on the surface as gas is:
Then:
Since the gas production is 94,83 % of the total moles produced, the total daily gas-condensate production in standard cubic feet is:
The total daily reservoir voidage by the gas law is:
This includes the stock tank vapors rather than just the gas from the main, high-pressure separator; therefore, the gas gravity should be the average of all gases produced. The gas deviation factor at initial reservoir temperature and pressure is estimated from the gas gravity of the recombined oil and gas.
Compositional Analysis Available
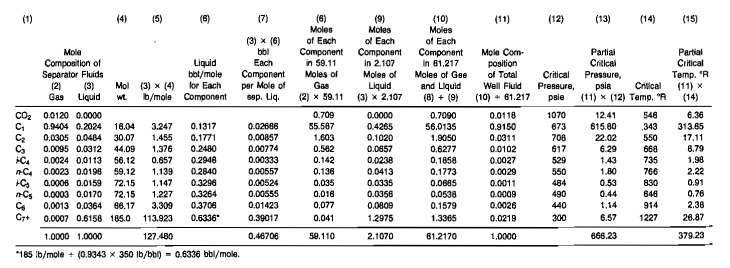
If a compositional analysis of the separator gas and liquid is available, a compositional analysis of the total well fluid, from which a more accurate Z-factor can be calculated, can be obtained by recombining the gas and liquid phases in the correct proportions. The following example, adapted from Craft and Hawkins, illustrates the procedure.
Example 2:
Use the following data and the compositions given in Columns 2 and 3 of Table 1 to calculate the initial gas and condensate in the reservoir.
- Reservoir pressure = 4 350 psia;
- Reservoir temperature = 217 °F;
- Hydrocarbon porosity = 17,4 %;
- Std. cond. = 15,025 psia, °F;
- Separator gas = 842 600 scf/day;
- Stock tank oil = 31,1 STB/day;
- Mol. wt. C7+ in separator liquid = 185,0;
- Sp. gr. C7+ in separator liquid = 0,8343;
- Sp. gr. separator liquid at 880 psig and 60 °F = 0,7675;
- Separator liquid volume factor = 1,235 bbl at 880 psia/STB, both at 60 °F;
- Compositions of high-pressure gas and liquid = Cols. (2) and (3), Table 2;
- Molar volume at 15,025 psia and 60 °F = 371,2 cu ft/mole.
Solution:
1 Calculate the mole proportions in which to recombine the separator gas and iiquid. Multiply the mole fraction of each component in the llquld, Column 3, by its molecular weight, Coiumn 4, and enter the products in Column 5. The sum of Column 5 is the molecular weight of the separator liquid, 127,48. Since the specific gravity of the separator liquid is 0,7675 at 880 psig and 60 °F, then the moles per barrei is:
The separator liquid rate is 31,1 STB/day·1,235 sep. bbl/STB so that the separator gas-oil ratio is:
Since the 21 940 scf is 21 940/371,2, or 59,11 moles, the separator gas and liquid must be recombined In the ratio of 59,11 moles of gas to 2,107 moles of liquid.
2 Recombine the 59,11 moles of gas and 2,107 moles of liquid.
Multiply the mole fraction of each component in the gas, Column 2. by 59,11 moles, and enter in Column 8. Multiply the mole fraction of each component in the liquid, Column 3, by 2,107 moles, and enter in Column 9. Enter the sum of the moles of each component in the gas and liquid, Column 8 plus Column 9, in Column 10. Divide each figure in Column 10 by the sum of Column 10, 61,217, and enter the quotients in Column 11. which is the mole composition of the total well fluid. Calculate the pseudocritical temperature, 379,23 °R and pressure 668,23 psia from the composition. From the pseudo-criticals find the pseudoreduced values. and then the deviation factor at 4 350 psia and 217 °F. which is 0,963.
3 Find the gas and oil in place per acre-foot of net reservoir rock. From the gas law. the initial moles per acre-foot at 17,4 % hydrocarbon porosity is:
The pseudocritical properties of the C7+ fractions used in Table 2 were obtained as a function of molecular weight and specific gravity from Picture 5.
Recovery Estimates
Once the initial hydrocarbons in place are determined it is then necessary to calculate the amounts of gas and condensate that can be recovered. assuming a certain abandonment pressure. As pressure drops below the dew point, liquids will condense in the reservoir and will, in most cases. be unrecoverable. This causes the gas produced to contain fewer heavy components as the reservoir is depleted. An estimate of recoveries by pressure depletion must be made before the feasibility of maintaining pressure by cycling can be established.
Three different methods for predicting depletion performance for a volumetric reservoir are discussed. These are:
- Laboratory simulation;
- Flash calculations, and;
- Empirical correlations.
The most accurate is the laboratory simulation method, and this method should be used if possible. The added cost is certainly justified when the value of the reserves is considered.
Laboratory Simulation
The laboratory simulation procedure assumes that the separation process occurring in the reservoir is a differential process; that is, no liquid phase is produced from the reservoir.
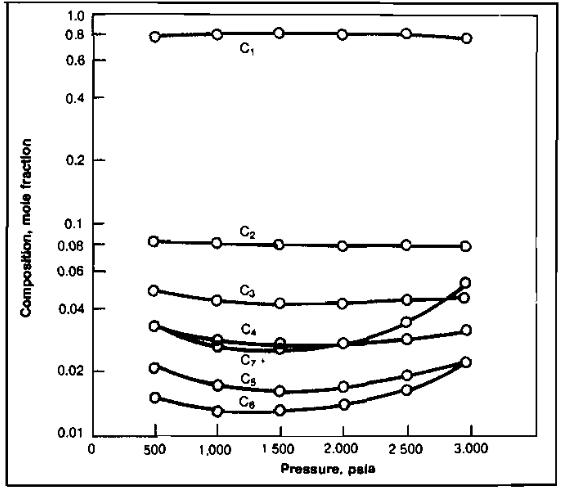
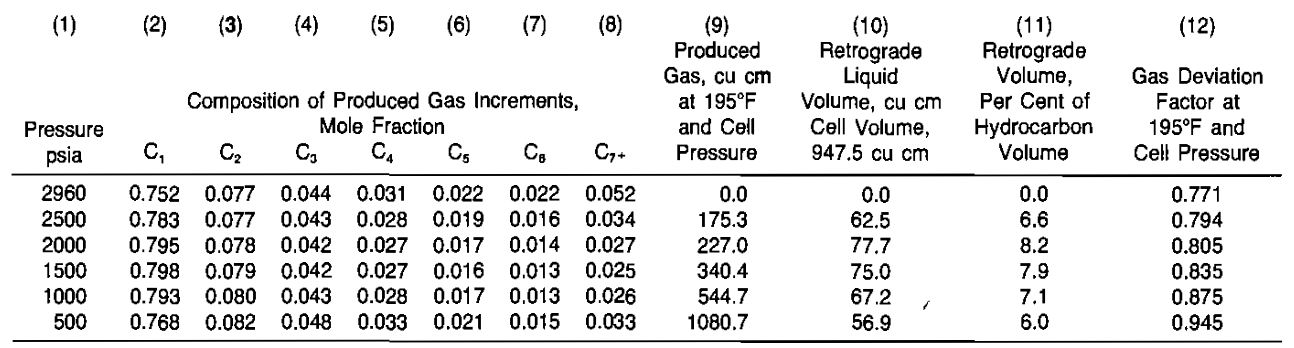
The process consists of starting with a reservoir fluid sample at or above its dew point pressure and at reservoir temperature. Gas is removed to decrease the pressure in reasonable increments, down to the assumed abandonment pressure. Each increment of gas removed is analyzed to determineits composition, and the volume removed is measured. The changing composition with pressure decrease is illustrated in Picture 6.
The liquid recovery from the gas increments produced from the cell may be measured by passing the gas through small-scale separators, or it may be calculated from the composition for usual field separation methods or for gasoline plant methods. Liquid recovery of the pentanes plus will be somewhat greater in gasoline plants than by field separation, but much greater for the propanes and butanes, commonly called liquefied petroleum gas, LPG.
The following example, taken from Craftand Hawkins, illustrates the calculation procedure. It was assumed that the recoveries of liquid from the produced gas would be 25 % of the butanes, 50 % of the pentane, 75 % of the hexane, and 100 % of the heptanes and heavier components.
Example 3:
Calculate the performance of the retrograde condensate reservoir based on the results of a differential laboratory separation given in Table 3 and the following data:
- Initial pressure (dew point) = 2 960 psia;
- Abandonment pressure = 500 psia;
- Reservoir temperature = 195 °F;
- Connate water = 30 %;
- Porosity = 25 %;
- Standard conditions = 14,7 psia & 60 °F;
- Initial cell volume = 947,5 cc;
- Mol. Wt. of C7+ in Initial Fluid (Assumed constant) = 114 lb/lb-mole;
- Sp. Gr. of C7+ in Initial Fluid (Assumed constant) = 0,775 at 60 °F.
Solution:
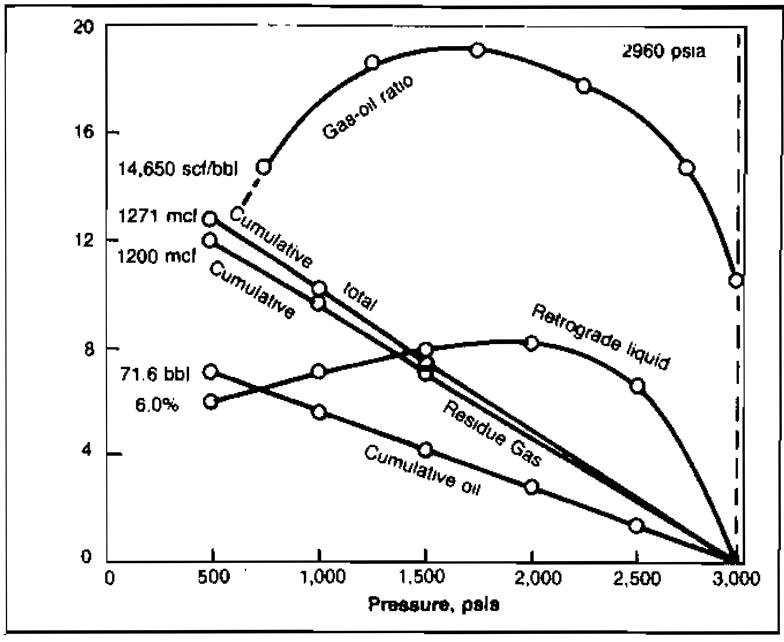
The solution is summarized in Table 4 and Picture 7. Details of some of the calculations are given below.
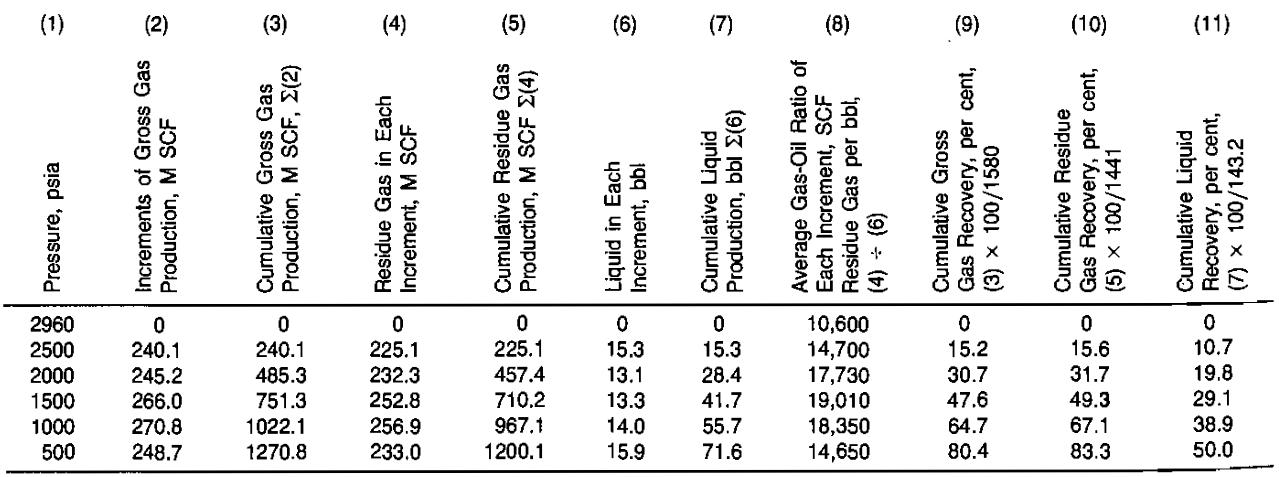
1 Calculate the increments ofgross production In Mscf per acre-foot of net bulk reservoir rock, and enter in Column 2 of Table 4.
For example, In the pressure increment between 2 960 and 2 500 psia:
2 500 psia and 195 °F:
Column 3 is the summation of gross gas produc- tion in Column 2.
2 Calculate the Mscf of residue gas and the barrels of liquid obtained from each increment of gross gas production and enter in Columns 4 and 6. Then, the mole fraction recovery as liquid is:
Since mole fraction is the same as volume fraction in gas, the Mscf recovered as liquid from 240,1 Mscf is:
This volume of gas can be converted to gallons of liquid using table Best and Most Widely Methods to Perform Necessary Calculations with a Gas“Physical constants of hydrocarbons” of the Gas Properties article for C4, C5 and C6. The average of the iso- and normal compounds is used for C4 and C5.
For C7+:
hen the total liquid recovered from the 240,1 Mscf determined in part (1) is:
The residue gas recovered from the 240,1 Mscf determined in part (1) is:
Column 5 is the summation of Column 4, and Column 7 is the summation of Column 6.
3 Calculate the gas-oil ratio foreach Increment of gross production in units of residue gas per barrel of liquid. Enter in Column 8. For instance:
4 Calculate the cumulative percent recoveries of gross gas, residue gas, and liquid. Enter in Columns 9, 10, 11. The initial gross gas-in-place is:
The liquid mole fraction is 0,088, and the total liquid recovery is 3,808 gal/Mscf of gross gas, which are calcuiated from the initial composition in the same manner as shown in part (2). Then:
At 2 500 psia, then:
Reference to Picture 7 will show that the producing gas-oil ratio increases and then declines below 1 500 psia due to revaporization of liquids. However, as a practical matter, field experience suggests that essentially all liquids are held to rock surfaces by capillary forces and virtually none is revaporized. Thus, the field producing gas-oil ratio does not normally decline.
Reference to Columns 10 and 11 of Table 4 will show that 83,3 % of the residue gas is calculated as recovered to an abandonment pressure of 500 psia. However, only 50 % of the liquids are recovered due to retrograde condensation. Gas cycling projects are justified on the recovery of the liquids that would be otherwise lost if production operations only permitted pressure depletion of the reservoir involved.
Flash Calculations
In the absence of direct laboratory data on a specific gas-condensate system, estimates of pressure-depletion behavior can be obtained by using vapor-liquid equilibrium ratios to compute the phase behavior when composition of the total gas-condensate system is known. Correlations for estimating phase volumes must also be available.
When multicomponent hydrocarbon gases and liquids exist together under pressure, part of the lighter hydrocarbons are dissolved in the liquid phase, and part of the heavier hydrocarbons are vaporized in the gas phase. A convenient concept for describing quantitatively the behavior of specific components is the equilibrium ratio. The ratios vary considerably with the pressure, temperature, and composition of the system involved.
The use of equilibrium ratios for flash calculations is illustrated in Best and Most Widely Methods to Perform Necessary Calculations with a GasMethods to Made Calculations for a Gas Producing System. Determining the proper convergence pressure for selecting a set of equilibrium ratios is a problem because of the changing composition of the fluids as pressure decreases. This problem is discussed extensively by Standing. A step-by-step procedure for calculating performance using equilibrium ratios follows.
- Assume flashing the original (known) composition from original pressure (and volume) to a lower pressure, at which the compositions and amounts (in moles) of the liquid and gas phases are computed, using the best k values available.
- Estimate the volume of each phase using methods discussed below.
- Assume removal of enough vapor phase volume at constant pressure to cause the remaining gas plus all the liquid to conform to the reservoir’s original constant volume.
- Subtract from the original system composition the number of moles of each component in the vapor represented by this gas removal.
- Using the new total composition from step 4, consider the system flashed to the next lower pressure in the stepwise process and repeat the above procedure. Removal of vapor phase alone is required by the assumption that fluid flowing into the wells will not be accompanied by any liquid phase at any step of the process.
As indicated, the stepwise calculations require knowledge of the volume occupied by each phase at each step. Means of estimating these volumes are described in Best and Most Widely Methods to Perform Necessary Calculations with a GasMethods to Made Calculations for a Gas Producing System and also by Standing. In estimating phase volumes, smoothed values should be used from curves drawn through the points computed from properties of the phase at each known composition.
The above calculations are intended to approximate the experimental procedure used in the pVT cell during a laboratory pressure-depletion study. The number of pressure steps to be used in making such calculations is arbitrary but probably should conform to about 500 psi intervals, with points usually closer together at the start and at the end of the calculations. After the pressure-depletion calculations have been made on a stepwise basis to some assumed abandonment pressure, the resulting information can be used for plotting smoothed curves similar to those obtained from laboratory experiments. Calculated ultimate recoveries of gas and natural gas liquids can then be made by the methods discussed previously.
The prediction of condensate reservoir performance from equilibrium ratios alone is likely to be in considerable error. Nothing takes the place of carefully collected and analyzed reservoir fluid samples obtained early in field life (or early in reservoir life if multiple reservoirs are involved). Standing has discussed this problem. Unfortunately, equilibrium ratios change with pressure, temperature, and composition. Condensation of liquids in the reservoir changes the composition of the flowing hydrocarbons; therefore, the equilibrium values change.
Empirical Correlations for Estimating Performance
Where laboratory studies of the reservoir fluid are not available, it is sometimes possible to use the published results of Jacoby, Koeller, and Berry. This is often the case for small reservoirs. It also is a useful method where estimates of future condensate and gas production are needed in advance of a laboratory analysis, even if such work is ultimately planned. The authors studied several rich natural gas-condensate systems (gas-oil ratios of about 3 600 to 60 000 scf/STB), one natural volatile oil system (gas-oil ratio of 2363 scf/STB), and a series of relatedsynthetic reservoir fluid mixtures (gas-oil ratios of 2 000 to 25 000 scf/STB). The correlations made were by regression analysis. It was found that total tank oil-in-place could be correlated with initial GOR and that the cumulative oil and separator gas-in-place recovered from the saturation pressure to an abandonment pressure of 500 psi could be correlated with initial GOR, initial tank oil gravity, and reservoir temperature. It was noted that depletion from saturation pressure to 500 psi would recover an average of 92 % of the total separator gas-in-place.
The calculated ultimate oil recovery by depletion from the saturation pressure to 500 psi is correlated by the equation:
where:
- Np = cumulative stock tank oil production from dew point pressure to 500 psia, bbl stock tank oil/bbl HCPS;
- Ri = initial separator gas-oil ratio, scf/STB oil;
- T = reservoir temperature, °F, and;
- °API = initial stock tank oil gravity.
In Equation 5, it is worth noting that pressure was found not to be an important correlating factor. This might not be the case for lean gases. Equation 5 fits the available data with a standard deviation of the percentage errors of 11,3 %.
The separator gas-in-place at the saturation pressure was correlated by the equation.
where:
- G = total initial primary separator gas-in-place, scf, and;
- pd, b = saturation pressure (dew point or bubble point), psia.
Equation 6 fits the available data points with a standard deviation of the percentage errors of 3,8 %.
Effects of Water Drive
Very few cases of gas-condensate reservoirs operated under natural water drive have been reported in the literature. To be economically attractive a water drive would have to be sufficiently strong to maintain pressure high enough to minimize condensed hydrocarbon losses in the formation.
Gas-condensate reservoirs (whether exhibiting retrograde behavior or not) may perform volumetrically or may produce under a partial or total water drive. If pressure maintenance occurs, the recovery will depend upon the stabilization pressure and the displacement efficiency of the invading water (i. e., a frontal displacement mechanism). The liquid recovery for retrograde reservoirs will be less since the liquid will usually be immobile and will be trapped with some gas behind the invading water front. Unfortunately, recoveries are usually lower with water influx than with volumetric depletion.
If no oil zone is associated with the gas condensate reservoir, the material balance may be presented as follows:
or as:
Equations 7 and 8 can be used to determine water influx, We, the original gas-in-place, G, or the initial reservoir gas volume, Vi. Care should be taken in the determination of z at the reservoir pressure of interest, since it must include the equivalent condensate or oil; i. e., it is a two-phase gas deviation factor.
The injection of water into a gas-condensate reservoir to maintain pressure is sometimes considered. A number of factors must be carefully weighed before a decision is reached. The mobility ratio in this case is favorably low because of the very high mobility of the gas, thus tending to provide high areal sweep and pattern efficiencies. However, there is strong evidence that displacement efficiency by the water is not high, and it may be as low as 50 %. This is offset to some extent by the improved areal sweep efficiency at low mobility ratio. All things considered, the recovery of gas condensate in the vapor phase by water injection is likely to be appreciably lower than by cycling, and any consideration of water injection for gas-condensate recovery should be accompanied by detailed experimental work on cores from the specific reservoir involved. This will help determine whether the water can in fact accomplish a high enough displacement efficiency to justify its use.
Gas Cycling
Incentive exists to cycle gas-condensate reservoirs in those instances in which natural depletion of the resource will result in substantial loss of liquid hydrocarbons. This occurs in water drive fields where “wet” gas is trapped or in volumetric-type reservoirs where retrograde behavior exists. Liquid hydrocarbons formed during pressure depletion are not normally revaporized at lower reservoir pressures and thus are lost. Where the reservoir rock has favorable characteristics, cycling with “dry” gas should permit recovery of part of the liquids that would otherwise be lost.
Liquids recovery is determined in the reservoir by displacement efficiencies, which are a product of the vertical, areal, and pore-to-pore fractional recoveries. Most cycling projects recover in the range of 50 % of the liquid hydrocarbons that would otherwise be lost.
Recoveries from cycling projects depend on the volume of reservoir contacted by the dry gas and on the fraction of wet gas displaced in the contacted volume. The definitions of and methods for determining the various efficiencies are described.
Areal Sweep Efficiency (EA)
Areal sweep efficiency is the area enclosed by the leading edge of the dry gas front divided by the total area of the reservoir. EA can be estimated using analog models or by observing well performance in an actual project.
Vertical Sweep Efficiency (Ev)
Vertical sweep efficiency is the pore space invaded by the injected gas, divided by the hydrocarbon pore space enclosed by the projection (through full reservoir thickness) of the leading edge of the dry-gas front.
Vertical sweep efficiencies can be as high as 90 % under favorable conditions. However, invasion is significantly affected by large variations in reservoir flow properties. These might be:
- Strictly lateral variations in horizontal permeability of a single bed comprising a reservoir that does not have any variations vertically at any location;
- Strictly layering effects, by which several strata may comprise the reservoir, each being uniform as to properties but differing appreciably in permeability from all the others;
- or combinations of these extreme cases.
Performance of cycling operations can vary appreciably according to what combination of the two extremes may exist for a given reservoir. Analog models can handle permeability variations to a limited extent in representing gas-condensate reservoirs; such techniques are handicapped considerably by lack of detailed data on lateral and vertical permeability distributions in the reservoir since wells are widely spaced and unfortunately are not all cored to provide the necessary subsurface information.
Displacement Efficiency (ED)
Displacement efficiency ED is the volume of wet hydrocarbons swept out of individual pores or small groups of pores, divided by the volume of hydrocarbons in the same pores at the start of cycling; note that both volumes must be calculated at the same conditions of pressure and temperature. Displacement efficiency is controlled mainly by the miscibility of the driving and driven fluids and their mobilities. For a cycling operation in which the pressure is being maintained at or above the dew point, the displacement efficiency resulting from the action of the dry gas against the wet gas phase in the individual pores will be virtually 100 %.
Reservoir Cycling Efficiency (ER)
Reservoir cycling efficiency is the overall recovery factor defined as the wet hydrocarbons recovered divided by the wet hydrocarbons initially in place in the reservoir. It is the product of the three previously defined efficiencies. That is:
Feasibility of Gas Cycling
In choosing between pressure depletion and pressure maintenance as operating methods for a gas-condensate reservoir, detailed analyses must be made for predicting optimum economics. Cycling and gas-processing procedures require sizable plant expenditures. Possible processing methods, whether reservoir fluids are cycled or not, include stabilization, compression, absorption, and fractionation. The latter two recover appreciably more condensibles from wet gas than do the former. If the removal of ethane from a gas stream is desirable, for economic or other reasons, fractionation can accomplish this.
When the reservoir characteristics appear favorable for recovery of condensible hydrocarbons, it must then be considered whether cycling would be economic. The primary comparison is between value of the estimated additional recovery of liquid products by cycling and the actual cycling costs, taking into account deferment of gas income and other factors. Economic analyses of cycling and noncycling are required; these must be carried out in detail for maximum dependability, using information factors and assumptions pertinent to each particular case.
The primary considerations in making a decision on whether or not to cycle are summarized by Frick.
- Reservoir formation and fluid characteristics; occurrence or absence of black oil; size of reserves of products; properties and composition of reservoir hydrocarbons; productivities and injectivities of wells; permeability variation-controls the degree of bypassing of injected gas; degree of natural water drive existing.
- Reservoir development and operating costs.
- Plant installation and operating costs.
- Market demand for gas and liquid petroleum products.
- Future relative value of the products.
- Existence or absence of competitive producing conditions between operators (in the same reservoir).
- Taxes, severance, ad valorem, and income.
- Special hazards or risks (limited concession or lease life, political climate, others).
- Overall economic analysis.