This article covers basic information about methodology, methods and risks of LNG Bunkering Operations, and why it’s important and necessary.
The environmental and economic advantages of using LNG as marine fuel have been recognized by the industry. In response to increasing demand, construction of LNG bunkering infrastructure is under rapid development. Several ports are preparing to supply LNG, but uncertainties concerning the bunkering process and operational safety still exist
Abstract
Recently, much work has been done to standardize LNG bunkering solutions, including a launch of an ISO guideline and a Recommended Practice (RP) by DNV. One of the main topics of these documents and of international discussion is operational safety and the establishment of safety zones around the operations. High risk is particularly associated with “vulnerable objects” (i. e. third parties, like ferry passengers) in the vicinity of the bunkering operation. Ferries are currently the main LNG fuel consumer and some ferries have passengers on at all times. Current regulations do not allow passenger presence during bunkering. This limitation reduces the functionality and competitiveness of LNG, and has proved to be problematic for ferry companies.
The goal of this thesis is to establish probabilistic safety zones for a generic ship-to-ship (STS) bunkering case. Threats to vulnerable objects and the associated likelihood, in the event of an LNG leak, is identified. The specific purpose is to determine whether acceptable safety levels for passengers are present on board a ferry performing LNG bunkering operations. This study will assess the risks involved and calculate safety zones through an established probabilistic approach, known as Quantitative Risk Assessment (QRA) methodology. This method includes frequency and consequence calculations of possible Loss of Containment (LOC) scenarios. The acceptable risk level for third parties per bunkering operation is assessed against the widely used criteria of 10-6.
Based on the contour results provided by PHASTRisk (the DNV risk analysis software tool), it is clearly demonstrated that passenger safety can be maintained during bunkering operations. This study concludes that there is no unreasoning risk in allowing passenger presence during bunkering. Passenger safety issues should consequently not limit the application of LNG as fuel for ferries.
List of Abbreviations
NG – Natural Gas.
LNG – Liquefied Natural Gas.
HFO – Heavy Fuel Oil.
MDO – Marine Diesel Oil.
MGO – Marine Gas Oil.
LOC – Loss of Containment.
QRA – Quantitative Risk Assessment.
IMO – International Maritime Organization.
ISO – International Organization for Standardization.
RP – Recommended Practice.
ECA – Emission Control Area.
STS – Ship-to-Ship.
TTS – Truck-to-Ship.
PTS – Terminal (Pipeline)-to-Ship.
LOD – Layer of Defence.
AIR – Acceptable Individual Risk.
LSIR – Location-Specific Individual Risk.
HCRD – Hydrocarbon Release Database.
HSE – Safety Executive.
LEL – Lower Explosion Level.
UEL – Upper Explosion Level.
LFL – Lower Flammability Level.
UFL – Upper Flammability Level.
1/2 LFL – half Lower Flammability Level.
ERC – Emergency Quick Release Connector/Couplers.
ESD – Emergency Shutdown Systems.
ERS – Emergency Release Systems.
ACDS – Advisory Committee on Dangerous Substances.
SIMOPS – Simultaneous Operations.
PLC – Programmable Logic Controller.
LCV – Level Control Valve.
P&ID – Piping and instrumentation diagram.
Background
Motivation
“The LNG industry is the fastest growing segment of the energy industry around the world.”
Global oil is growing about 0,9 % per annum, global gas at 2 %, while Liquefied Natural Gas (LNG) has been growing at a comparatively soaring 4,5 %.
“Lloyd’s Register believes LNG could account for up to 9 % of total bunker fuel demand by 2025.”
Small-scale distribution and bunkering of LNG has been booming as well. LNG was created as an alternative to pipelines for transportation of natural gas (NG) over long distances in a more economical way. LNG is reduced to approximately 1/600 th in volume through liquefaction. Transportation and handling of LNG as cargo on both land and sea have been proven for many decades. With new emission regulations the potential applications for LNG is expanding. Among these applications is use of LNG as marine fuel. LNG is particularly attractive for marine vessels traveling set routes in near coast waters such as tugboats, ferries, and support vessels.
Heavy Fuel Oil (HFO), Marine Diesel Oil (MDO) and Marine Gas Oil (MGO) are all current conventional bunkering fuels. Ship based fuel is a large part of oil consumption and all these fuels are high on emission rates. Based on a review of existing marine engine technology, reductions in emission from using LNG as a fuel are:
- CO2 and GHG 20-25 %,
- SOx and particulates approximately 100 %,
- and NOx 85-90 %.
For further information, see project report section 3.1.4: Natural Gas – The Solution.
Around the world new LNG projects, applications and technological advancements are being announced regularly. Currently there are 38 LNG fuelled ships in operation and 74 confirmed contracts for construction. The reason for this strong increase and interest in LNG as a marine fuel is based on two main factors:
- The Marine Environmental Protection Committee, part of International Maritime Organization (IMO), is introducing emission controls, constraining the extent of exhaust gas emission. This is forcing the industry to rethink its fuelling options and LNG is proving to be a solid alternative.
- The availability of NG has increased due to large offshore discoveries and unconventional gas findings in the US (shale gas), creating lower prices on NG compared to conventional fuels. This creates a drive in the industry, as consumers are able to obtain commercial saving against alternative fuels.
In response to increasing demand, construction of LNG bunkering infrastructure is under development. 6 Development of a worldwide LNG supply chain based on Ship/Shore Interface in Gas tradingship-to-ship or shore-to-ship bunkering is of paramount importance for LNG to become a real alternative to heavy fuel oil.
Underlying Hypothesis
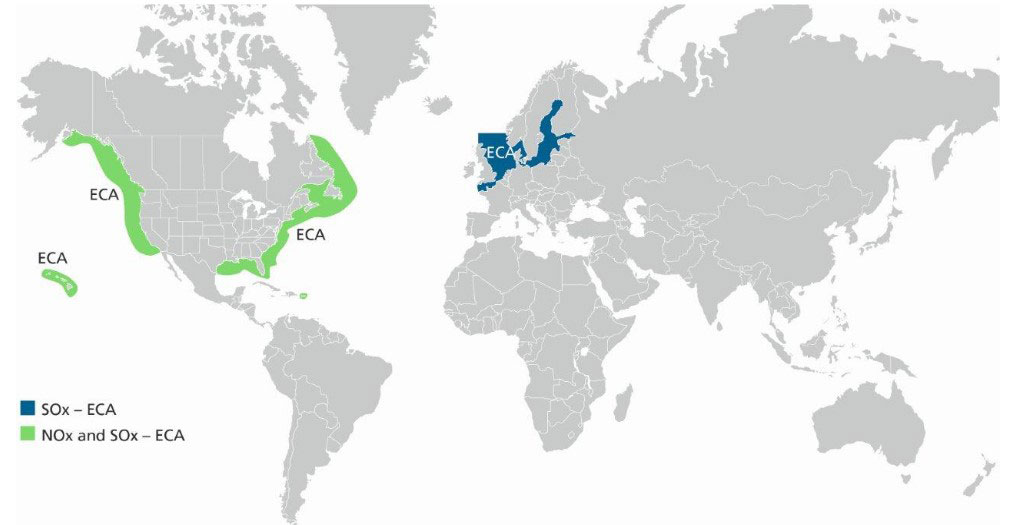
The development of LNG bunkering facilities has obtained increased focus in several countries 8 and especially those within Emission Control Area (ECA), see figure 1 and project report section 3.2.1 Emission Control. Several ports are preparing to supply LNG, but uncertainties concerning the bunkering process and operational safety still exist. Bunkering with conventional marine fuels or large scale bunkering offshore is at this stage not covering the relevant risk for small scale bunkering in a port.
LNG is stored at low temperatures and development of a gas cloud in the event of an unexpected release to the surroundings, requires insight to the risks. The risks are analysed through evaluating frequencies and consequences of leak scenarios. Risk results will provide insight as to what safety distance should be taken into account, given a specific bunker configuration. As such it can be used as an initial screening tool for suitability of bunker locations in the port area.
Recently, much work has been done to standardize LNG bunkering solutions, including a launch of an International Organization for Standardization (ISO) guideline 11 and a Recommended Practice (RP) by DNV 12. One of the main topics of these documents and of international discussion is operational safety and the establishment of safety zones around operations. A direction for establishing safety zones has been provided by the ISO and DNV RP, but thus far no international consensus has been reached on the method and results. Consequently, there are differences in practices and precautions on existing operations.
Read also: Ship conversion to use Liquefied Natural Gas as Fuel
What the bunkering procedure currently considers as high risk with respect to third parties in the vicinity of the operation (vulnerable objects), is not yet advised by official guidelines. This is especially problematic for ferries (assumed to be the LNG fuel’s main market), which have passengers on at all times. The functionality and strengths of LNG compared to other fuels will be considerably reduced if vulnerable objects to the bunkering operation (i. e. individuals who are not operational personnel) can’t be present in the area.
If passenger presence during bunkering is a real threat it is important to establish this before the construction of a large LNG bunkering infrastructure is commenced. It would be equally unfortunate if the expansion of LNG as a fuel was held back due to perceived safety barriers affecting its application. For successful incorporation of bunkering in ports it is essential that the safety zones allow the bunkering operation to remain practical. The security and safety zones therefore need to be established conclusively for generic applications.
Main Goal of Thesis
The goal of this thesis is to establish probabilistic safety zones for a generic ship-to-ship (STS) bunkering case. Threats to vulnerable objects and their likelihood of taking place, in the event of an LNG leak, will be identified. Vulnerable objects in our study are to be understood as ferry passengers. The specific purpose is to determine whether acceptable safety zones (for vulnerable objects) is present on board a ferry performing LNG bunkering operations.
So far there are few studies that have systematically assessed LNG bunkering hazards. This study will assess the risks involved and calculate distances through an established probabilistic approach, known as Quantitative Risk Assessment (QRA) methodology. The method includes frequency and consequence calculations of possible Loss of Containment (LOC) scenarios. Both the probabilistic approach and the stages of a QRA analysis will be expressed in Methodology.
Scope of Thesis
The thesis will cover methodology, establish the context, risk analysis and risk treatment. The context will outline the base case considered in the study, including definition of essential parameters and sensitivities. Risk analysis will involve the QRA method, including frequency and consequence calculations, and an evaluation of whether regulatory requirements are met. Risk treatment will provide the concluding remarks to the study. The report is limited by the available description of bunkering technologies, site-specific information, and historical data on bunkering processes. Use of the findings would require consideration of system and site-specific to the application.
This thesis use material from the project report Evaluation of technical challenges and need for standardization for LNG bunkering which was written as an introduction to the topic of LNG bunkering. The project report looked at various systems and methodology for LNG bunkering employed in present operations to define a typical or “best practice” approach today. In this master thesis some of the key elements discussed in the project report will be recapitulated. To a certain extent it will be advantageous but not necessary for the reader to have understanding and knowledge of this report prior to reading this study. The report presents physical hardware, operating procedures and the advantages of using LNG as a bunker fuel.
Methodology
Safety Zone
“The minimum safety zone shall be defined as the area around the bunkering facilities where the likelihood of flammable mixtures due to LNG or NG releases from the bunkering exceeds 10-6 per bunkering operation.”
The safety zone is the contour of a cumulative frequency of an ignitable gas cloud (using 100 % LFL) > 10-6 per bunkering. This means that a 10-6 risk contour per operation for flash fires mark the safety zone distance and necessary boundaries for an operation. To produce risk contour results, a probabilistic assessment of all release scenarios from all processing equipment in the bunkering installation (hose, piping, tanks, connectors, flanges, valves, etc.) is required.
Risk Acceptance Criteria
To be able to define zones, risk acceptance criteria for individuals need to be recognized. The acceptance criteria used in this study is in alignment with regulatory requirements. The DNV RP and ISO guidelines express the following risk acceptance criteria for LNG bunkering operations:
| Individual risk | Applies to | Acceptance criteria |
|---|---|---|
| 1st party | Crew and personnel | AIR < 10-5 |
| 2nd party | Post personnel | AIR < 5×10⁻⁶ |
| 3rd party | General public without involvement in the activity (passengers) | AIR < 10-6 |
Acceptable Individual Risk (AIR) is the most common risk criteria used in the industry in risk assessment for relating risk to people. In this assessment we are concerned with passenger presence on board ferries during STS bunkering. Ferry passengers are classified as third party individual risk with an acceptance criterion of 10-6 per bunkering operation.
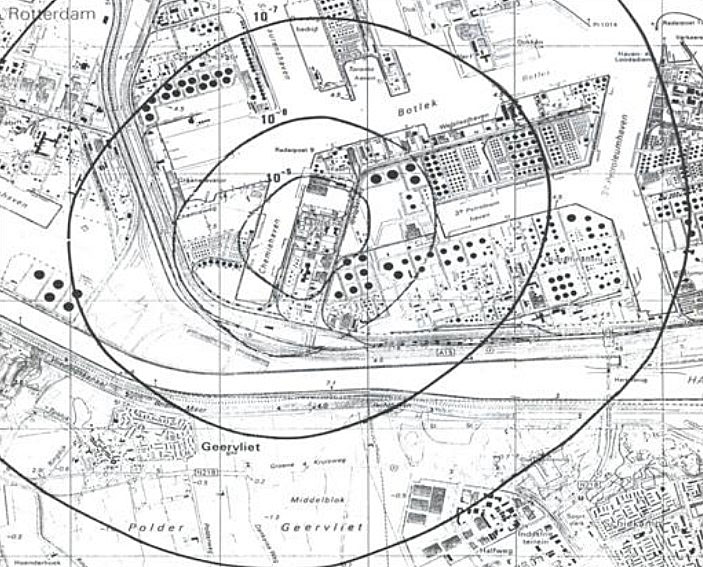
The Location-Specific Individual Risk (LSIR) is usually presented in terms of risk contours. An example of what risk contours are can be seen in figure 1. Every line in this picture represents a risk level: i. e.: 10-5 could be the inner most circle and then it decreases from there on out. In this study, the risk analysis will through the use of software tools (explained below) produce results in the form of contours, relevant and proportional to a STS bunkering arrangement layout.
Purpose of the Safety Zone
The purpose of the safety zone is to reduce the likelihood of igniting leaked NG. The idea is that the scenario of an uncontrolled LNG release should at all times be avoided. Measures to reduce uncontrolled releases are part of the first layer of defense. If, however, a leak was to take place, measures need to be implemented to reduce the likelihood of igniting the dispersing cloud. The prevention of ignition is part of the second layer of defense. The safety zone reduces the probability of ignition by excluding uncontrolled and controlled ignition sources from the zone. This is achieved by not allowing any non-essential personnel or activities within the defined safety zone. This will also reduce the number of people who could be exposed to a hazardous event.
Site-Specific Limitation
Any zone implementation should be a result of a site-specific risk assessment. Results obtained in this generic study ought to not be implemented directly to a real life bunkering system. The aim here is to create a generic result, which can provide insight as to how hazardous a bunkering case is, and possibly as a tool to complete system specific calculations.
Layers of Defense (LOD)
To ensure safe operation of LNG bunkering, the ISO guidelines and the DNV RP promotes layers of defense (LOD). LOD is a concept for how to understand the causes and consequences of a LNG or NG release and introduces three levels of how their effects can be reduced.
- 1st LOD: requirements to prevent an accidental release.
- 2nd LOD: requirements to contain and control a hazardous situation.
- 3rd LOD: procedures to minimize consequences and harmful effects.
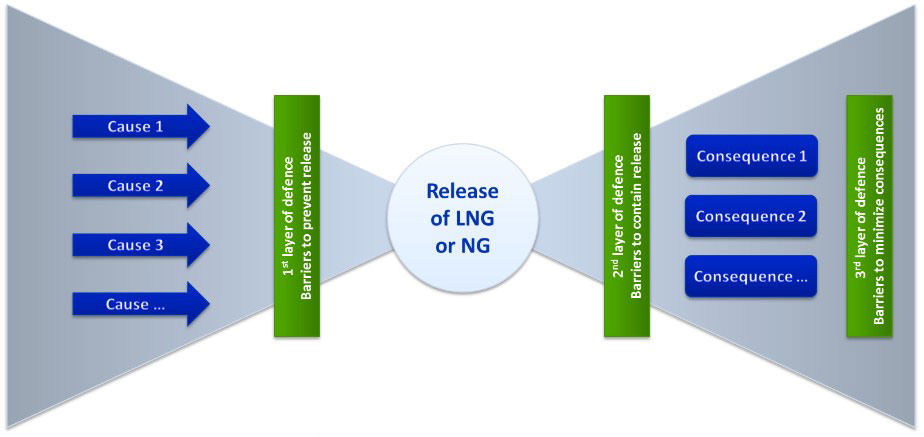
The below figure, figure two, is known as a bow-tie model and illustrates the concept of three layers of defense. First LOD is preventive and prior to any actual release, the second LOD is immediately after the release and this is where the safety zone comes in as a preventive tool. Finally, the third LOD are measures taken when the release has taken place.
As part of this study, a bow-tie analysis will be undertaken in the initial stages, see Risk Assessment in the Liquefied Natural Gas Bunkering Operations, Hazard IdentificationRisk Identification. In this section, the causes leading to a LNG or NG release and the consequences of this release will be outlined.
Method
The ISO guidelines propose two approaches to calculate a safety zone for any process: deterministic or probabilistic. This section will give a short introduction to the two approaches and argument for the choice made.
Deterministic Approach
A deterministic approach is only applicable for standard bunkering scenarios where all functional requirements in the ISO guidelines are met. The safety zone is in this case determined by a consequence-based methodology. The calculations are based on a maximum credible dispersion scenario, and the results include maximum distances from the bunkering activity where the cloud of NG could be flammable. This approach is considered very simple and conservative, and will lead to large safety zones, as no safeguards are included in the analysis.
Probabilistic Approach
The probabilistic method follows a risk-based approach, which requires a more complex analysis of the operation. It considers the maximum distance to flammable concentration of each possible release scenario as well as its likelihood (i. e. both qualitative and quantitative aspects of the procedure). The safety zone is defined by the distance at which the frequency of the occurrence of a flammable cloud is equal to one occurrence every million operations (i. e. 10-6).
The probabilistic approach credit safeguards and consider the likelihood of the various scenarios. Consequently, this method will lead to smaller safety zones. It is therefore typically used for locations with space constraints and where large safety zones cannot be implemented. If passengers are on board the ferries during bunkering operations, the safety zone needs to be established, but it is also clear that an unreasonably large zone can’t be implemented. The probabilistic approach offers a more rational basis for making informed decisions than an approach based on single, large event scenarios, as in the deterministic. Although more thorough and time consuming, the probabilistic method is chosen.
QRA Method
The risk distance is modelled and quantified using Quantitative Risk Assessment (QRA). The QRA method is a recognized approach in calculating risk distances to vulnerable objects in the event of a hazardous substance leakage. The assessment considers consequence estimates and the probabilities for quantity of release, process section of release (i. e. hose, tank or process equipment), operational procedures and probability of ignition as a function of time after the release. Through calculating the potential effect of various scenarios for a specific system and their probability of occurrence, it is able to provide insight on the risk of human life.
The working process of QRA covers:
- Hazard identification – what can go wrong?
- Consequence modelling – how bad?
- Frequency estimation – how often?
- Risk assessment – so what?
- Risk management – what can be done about it?
Risk Management
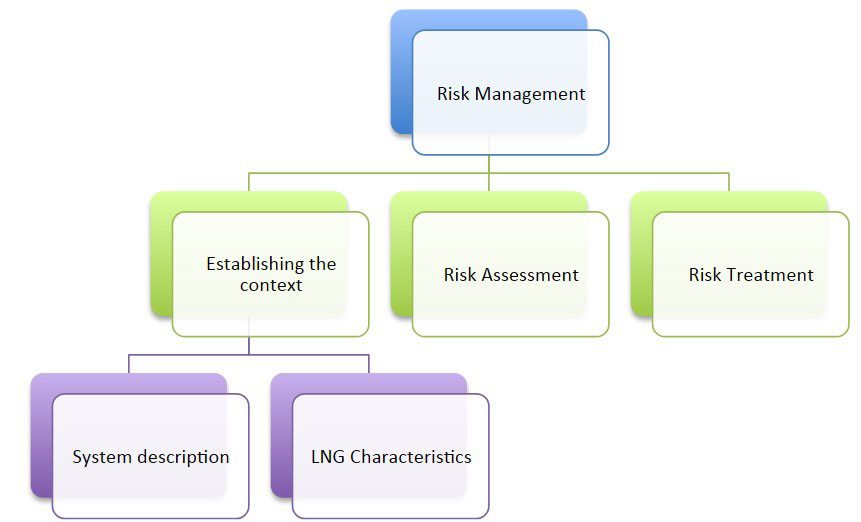
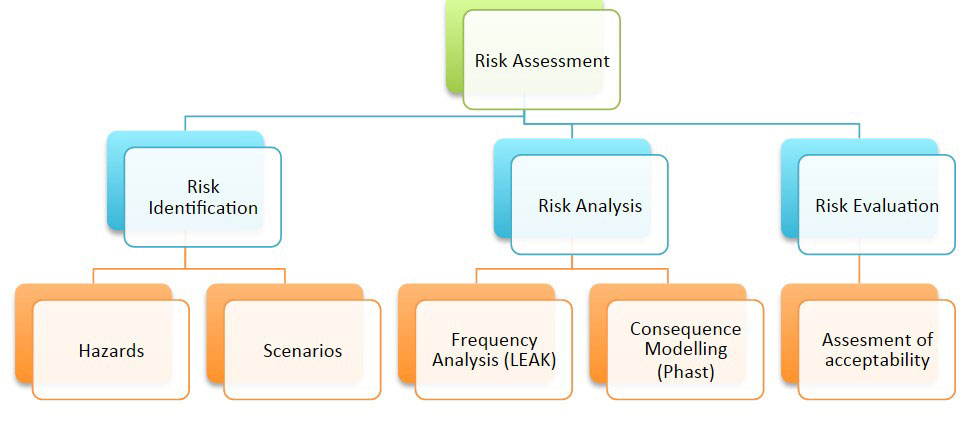
The overall theme of the report is risk management, in terms of evaluating the risks involved in STS bunkering of LNG. Risk management will involve three main components as can be seen from figure 3. The risk management process is in accordance with the ISO 31000.
Risk management involves introducing risk reduction measures to make a process acceptable, if necessary. If risk criteria are not met in the first QRA, additional mitigating measures will be introduced, and the QRA will be repeated. Detailed investigation of risk mitigating measures and their impact on risk calculations will not be included in this study.
Establishing the Context
The objective of this article is to establish the context of this study. This involves establishing the scope, criteria and system boundaries for the risk management process. The context overview will include bunkering arrangement, process equipment specific information, and LNG characteristics and hazards.
Risk Assessment
“Risk assessment is the overall process of risk identification, risk analysis and risk evaluation. Risk assessment provides an understanding of risks, their causes, consequences and their probabilities.”
The approach identifies hazards associated with a given project or operation. Including identification of how the hazards materialize into an accident and an account of preventive barriers in place. Risk assessment is when the technical information from risk analysis is combined with risk criteria to evaluate whether the risks are intolerable or negligible, or to make other value judgments about their significance. In other words, the technical and factual is combined with the non-technical, and the element of decision-making and human error is introduced. Details of the approach can be seen from figure 4.
Risk Treatment
Risk treatment considers the calculated and evaluated risk, and proposes further hazard reducing measures if needed. In this study, this article will include a discussion on other sensitivities that could have been considered, and that should be considered in real life scenarios (i. e. further studies).
Risk Identification
Risk identification will involve a HAZID (Hazard Identification) process, which is a structured and specific method for identifying hazards and evaluating them for relevance. For every major hazard, such as an LNG leak, the source of the event (cause), the effects of the event (consequence) and the implemented safeguards, will be identified.
Risk is the severity of the event, multiplied with the likelihood of the event.
Risk Analysis
In this section it is important that all assumptions, identified uncertainties, modelling choices and settings of calculation parameters are documented.
Frequency Analysis
After the hazards of a system or process have been identified, the next step in performing the QRA is to estimate the frequency at which the hazardous events may occur. The selected technique and tools used depend on the availability of historic data and statistics. Available tools and techniques are:
- Analysis of historical data.
- Fault tree analysis or event tree analysis.
- Simulations.
Consequence Modeling
Consequence modelling evaluates the resulting effects if the accidents occur, and their impact on personnel and the system. The consequence of any fire taking place is predominantly dependent on the type of LOC scenario and the process conditions (i. e. pressure, temperature) during the release.
“The consequence assessment shall be carried out using recognized consequence modelling tools that are capable of determining the resulting effects and their impact on personnel, equipment and structures, or the environment. This shall be validated by experimental test data appropriate for the size and conditions of the hazard to be evaluated.”
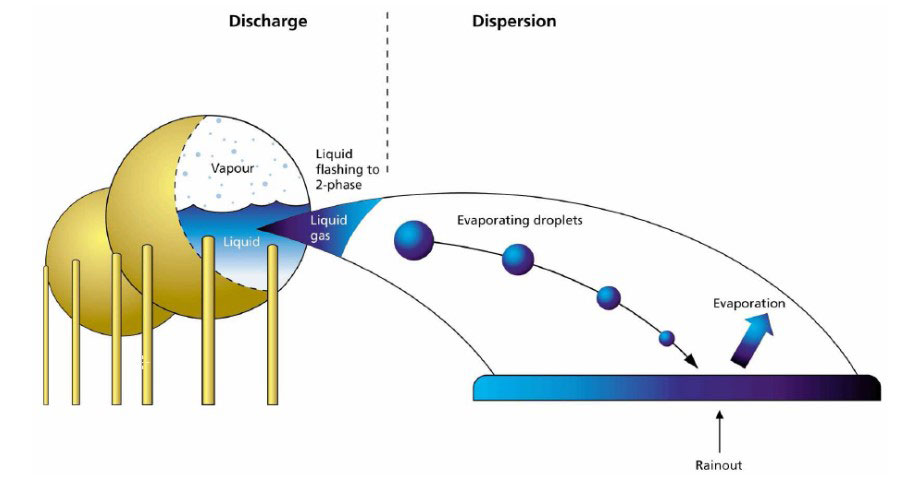
Figure 5 shows an example, which illustrate a two-phase release of LNG:
- The accidental release develops a jet flow due to pressure.
- The liquid jet breaks into aerosol.
- Some droplets will partly or fully evaporate, while the remaining liquid rains out to form a pool of LNG.
The consequence modelling involves the following consecutive steps:
- Discharge calculations – carried out to set release characteristics for the LNG (including depressurization to ambient). Scenarios that will be modelled are defined by the LOC scenarios list. Leak scenarios to be considered are both non-pressurized and pressurized releases, as defined by the bunker system.
- Dispersion calculations – carried out to determine the concentrations of gas when the cloud travels in the downwind direction. The chosen tool needs to be able to account for effects of jet, heavy-gas and passive dispersion. In the case of a two-phase release, rainout may occur and pool formation or spreading and re-evaporation shall be modelled accordingly.
- Fire calculations – carried out to produce the final risk level results. The calculation takes ignition probability into account, combined with discharge and dispersion effects.
- Explosion calculations – is part of the required calculations if the system is partially or fully within enclosed spaces.
Risk Evaluation
The results are presented and the risk of the events to individuals is quantified and evaluated against the risk acceptance criteria.
Software Tools
The risk analysis will involve the use of software tools. This section provides a short description of which functions they perform in the calculations. The use and specific examples will be provided in Risk Assessment in the Liquefied Natural Gas Bunkering Operations, Hazard IdentificationRisk Assessment as part of the risk analysis in this study.
Frequency Analysis Tools
Fault Tree
Fault tree excel ad-in is a DNV software tool, created to easily calculate how initial events combine with and/or gates and create overall event frequencies for a specific process section of the transfer system. For creating the model, events (E) and gates (G) needs to be named and combined accordingly. Initial frequencies to the main events are added by the events. The frequencies of the gates, which also can be known as grouped or main events, will be calculated by the fault tree tool/software.
LEAK
The DNV software LEAK is used to estimate the leak frequencies. The software uses statistical data from the Hydrocarbon Release Database (HCRD), compiled by the UK Health and Safety Executive (HSE). The database is extensive and covers leak registrations over a 20-year period, but is limited to the British Oil and Gas sector and offshore operations. This means that it will not provide failure rates for LNG operations and cryogenic equipment specifically. Any data concerning cryogenic or LNG-specific applications is currently limited.
Frequency estimates are recognized as one of the largest sources of uncertainty in QRA studies.
“The main risk drivers on an LNG site are events that are unlikely to be within the direct experience of individual plants and terminals. Establishing the frequencies of such events is difficult, precisely because of their rarity. It requires systematic data collection, for leaks and exposed equipment population, over many plants for many years. Such data collection is time-consuming and hence unusual.”
The relevance of HCRD offshore data is compensated by the weight of statistical data supporting the derived failure rates for specific equipment items, compared to the limited data on LNG and cryogenic facilities. The generic data derived from the HCRD has therefore been applied directly without any modification.
Consequence Modelling Tools
The consequence modelling tools used in this study is DNV’s software tools called PHAST and PHASTRisk. Together they give a comprehensive overview of possible outcomes and impact potential associated with the release of a hazardous material. Both programs can account for a whole range of factors (sensitivities) that affect the development of a loss of containment scenario for the process industry. The outcomes can undergo a full analysis in a single integrated calculation run by utilizing linked models.
PHAST undergoes continuous improvements and one of the recent developments in the 6.7 version, includes validation for release of LNG/NG (methane). Until recently this had not been possible, but it has been driven by a need by the industry. This is why studies such as this master thesis are emerging rapidly and are of high importance and interest at the moment.
PHAST 6.7
PHAST provides discharge calculations, which produce release rates and maximum distances. PHAST is a tool for the deterministic approach.
PHASTisk 6.7 (Safeti)
PHASTRisk, also known as Safeti, is a QRA software tool used to complete the consequence calculations for a probabilistic approach. PHASTRisk will take PHAST output and add further sensitivities such as weather conditions and the bunkering layout arrangement. PHASTRisk will incorporate visualization tools, which allow the impact ranges to be imposed on location maps (i. e. pictures of the bunkering layout), providing a clear understanding of the results. Using extensive and validated models one can quickly and easily simulate accident scenarios, including the extent of discharge, dispersion, flammable, explosive and toxic effects, for a specific substance.