To understand the risks (risk evaluation) involved in LNG bunkering, a technique called Hazard Identification (HAZID) is employed.
Risk Identification
Hazard Identification (HAZID)
The various scenarios of a LNG bunkering operation are systematically analyzed to identify the risks and they are then subject to frequency estimations and consequence modeling. The main hazards recognized in this study relate to LNG leakage, also known as LOC of LNG, exclusively during the bunkering operation. Hazards that arise from intermediate LNG storage (i. e. on land storage or in shuttle tankers used to transport LNG) are not considered within the scope of this study. During the hazard identification, the cause, consequence and credibility of each of the hazards have been identified.
The work process in this study started by comparing HAZIDS in past DNV projects on LNG. On Table B below, an example of the process sections, equipment and scenarios that are considered are listed.
| Table B. STS bunker vessel to LNG fulled vessel | |||||||||||||||||
|---|---|---|---|---|---|---|---|---|---|---|---|---|---|---|---|---|---|
| Event No. | Accident Scenario | Cause | Consequences | Control/Mitigation Barriers | Risk Ranking (people) | Risk Ranking (Environment) | Risk Ranking (Asset) | Risk Ranking (Reputation) | Overall Risk | ||||||||
| C | L | RR | C | L | RR | C | L | RR | C | L | RR | ||||||
| 1 | LNG leakage from connecting arms/hoses | a. Cool-down too fast b. Loss of mooring/stability c. Poor design/materials d. Poor jointing or connection e. Overpressure or Overfilling f. Hoses and flanges do not fit g. Water-hammer effect h. Fabrication or material defects | a. Frost burns b. Injuries and fatalities c. Fires/Explosions d. Embrittlement of materials e. Disruption of operations | a. Competent crew b. Cool down procedures & temperature indication c. Emergency response procedures d. Loading arm/hose and jetty/mooring design e. ESD system & alarms f. Overpressure protection & thermal relief g. Control of arms/hose connecting procedure h. Pressure transient analysis to be used as piping design basis | 3 | 2 | T | 1 | 2 | T | 3 | 2 | T | 2 | 2 | T | T |
| 2 | LNG leakage from damaged loading arms/hoses | a. Impacts from ship or crane arms b. Objects dropping from cranes loading the ship | a. Fires – if ignition sources are present b. Risks to ship passengers and/or fatalities c. Embrittlement d. Frost burns e. Gas release | a. Concrete or other protective barriers and traffic rules (speed limits etc) b. Lifting procedures | 4 | 3 | C | 1 | 3 | T | 3 | 3 | C | 3 | 3 | C | C |
| 3 | Unplanned disconnection of the hose or loading arm | a. Excessive ship motions due to failure in engine control system on the ship b. Failure in mooring c. Passing ships d. Extreme weather conditions | a. Fires if ignition are present b. Risks to ship passengers and/or fatalities c. Embrittlement d. Frost burns e. Operation delay | a. Berthing and engine control of the ship b. Quick release coupling that will minimize damages to the loading arm | 4 | 1 | T | 1 | 1 | T | 3 | 1 | T | 3 | 1 | T | T |
| 4 | Overfilling of receiving ships fuel tank(s) | a. Control failure in instrumentation and systems b. Human operational error | a. Fires if ignition sourses are present and risks to ship passengers b. Abortion of the filling process in an unsafe state | a. Operational procedures and tank protection system (level indicators) | 2 | 1 | T | 1 | 1 | T | 2 | 1 | T | 1 | 1 | T | T |
| 5 | Damage to piping system at LNG bunker vessel or receiving vessel filling lines | a. Overpressure due to backflow from ships LNG tank(s) to the bunker vessel | a. Release of LNG through tank relief valves, and through pressure relief valves | x | 2 | 2 | T | 1 | 2 | T | 1 | 2 | T | 1 | 2 | T | T |
| 6 | Break of ship filling line on board | a. Lack of cryogenic protection b. Failure of drip tray c. Insulation material failure | a. Frost burns b. Fire and explosion if ignition sources are present | x | 4 | 1 | T | 1 | 1 | T | 3 | 1 | T | 3 | 1 | T | T |
| 7 | LNG hoses, piping or tanks damaged during simultaneous cargo operations | a. Dropped object, Failing goods b. Damage by truck, cranes etc | a. Damage to equipment (including escalation) b. LNG leakage, fire if ignition sources present | Separation distances, timing, sequence. Crew awareness and training, Procedures, ESD systems on the barge | 3 | 3 | C | 1 | 3 | T | 1 | 3 | T | 1 | 2 | T | C |
| 8 | LNG leaks from receiving ships fuel tank or bunker vessel LNG tanks | a. Overpressure b. Cool-down too fast c. Poor design/materials d. Vessel strike e. Overfilling | a. Rapid phase transition (water explosion) b. Cryogenic damage to hull and or jetty c. Fire, explosion leading to fatalities d. Reputation damage e. Loss of operations up to 3 months f. Damage to human health (e. g. cold burns) | a. Crew competence b. Cool-down procedures & temperature indication c. Emergency response d. Over-pressure protection e. Double hull design – LNG leaks from Fuel tanks have to be contained? f. ESD system & alarm | 4 | 1 | T | 1 | 1 | T | 3 | 1 | T | 3 | 1 | T | T |
| 9 | Ship-to-ship collision: unrelated vessel collides with bunker vessel during LNG transfer to end-user | a. Lack of well defined safety zone around LNG carrier/FSU b. Fast Approach c. Inclement weather d. Human Error e. Incorrect approach f. Loss of thrust/power g. Sabotage/terrorism h. Night time operations | a. Gas release b. Hull breach c. Environmental damage caused by spillage of LNG and/or marine diesel oil | a. Carrier/cargo tank design b. Competent crew c. Emergency response procedures d. Redundant power/thrust systems e. Speed and traffic control f. Emergency release coupling shall be in place g. Exclusion zones shall be set up, eg. Buoys | 3 | 2 | T | 1 | 2 | T | 3 | 2 | T | 1 | 2 | T | T |
| 10 | Bunker vessel sail away or ship sailing off with hose still connected | a. Human error b. Poor communication c. Commercial pressure/stress | a. Damage to equipment (including escalation) b. LNG leakage, fire if ignition sources present | x | 1 | 2 | T | 1 | 2 | T | 1 | 2 | T | 1 | 2 | T | T |
| 11 | Inaccurate or poor quality of weather forecasts and/or prediction of available operational window | a. Lack of timely and accurate information | a. High waves causing pipe/hose rupture b. Interrupted berthing plans and effect on departure plans c. Damage to vessel d. Failure with loss of LNG containment e. Fatalities | x | 1 | 2 | T | 1 | 2 | T | 1 | 2 | T | 1 | 2 | T | T |
| 12 | Deteriorating weather resulting in vessel disconnect | a. Strong wind b. Strong currents c. Mooring failure | a. Damage to equipment (including escalation) b. LNG leakage, fire if ignition sources present | a. Disconnect system b. Emergency systems c. Fire-fighting systems on both vessels | 1 | 2 | T | 1 | 2 | T | 1 | 2 | T | 1 | 2 | T | T |
The DNV RP recommends this table. HAZIDS results include a list describing the threats and a risk-ranking matrix. Risk-ranking matrixes prioritize the events through evaluation of their severity. Medium- and high-risk events should be analyzed numerically in the QRA. Both of these tables can be seen in Table B and C. The HAZID results will be used to form the bow-tie model explained below.
| Table C. Risk Ranking Matrix | |||||||||||
|---|---|---|---|---|---|---|---|---|---|---|---|
| Frequency (Likelihood) | |||||||||||
| STS LNG bunkering | O (1) | A (2) | B (3) | C (4) | D (5) | E (6) | |||||
| <1,0E-06 | 1,0E-06 – 1,0E-04 | 1,0E-04 – 1,0E-03 | 1,0E-03 – 1,0E-01 | 1,0E-01 – 1 | <1 | ||||||
| Practically non-credible occur. | Rarely occur | Unlikely occur | Credible occur | Probable occur | Likely/Frequent occur | ||||||
| Consequence | People | Environment | Asset | Reputation | Could happen in E&P industry | Reported in the E&P industry | Has occurred at least once in Company | Has occurred several times in Company | Happens several times/yr in Company | Happens several times/yr in one location | |
| 1 | Slight health effect/injury | Slight Effect | Slight Damage | Slight Impact | 10, 11, 12 | ||||||
| 2 | Minor health effect/injury | Minor Effect | Minor Damage | Limited Impact | 4 | 5 | |||||
| 3 | Major health effect/injury | Local Effect | Localised Damage | Considerable Impact | 1,9 | 7 | |||||
| 4 | PTD or Single Fatality | Major Effect | Major Damage | National Impact | 3, 6, 8 | 2 | |||||
| 5 | Multiple Fatality | Massive Effect | Extensive Damage | International Impact | |||||||
Bow-Tie Model
HAZID is a process performed to understand the potential causes and consequences of an LNG leakage. This information is fundamental to build a bow-tie model, which is a tool for understanding the mechanisms of a hazardous event.
LNG Leak Causes
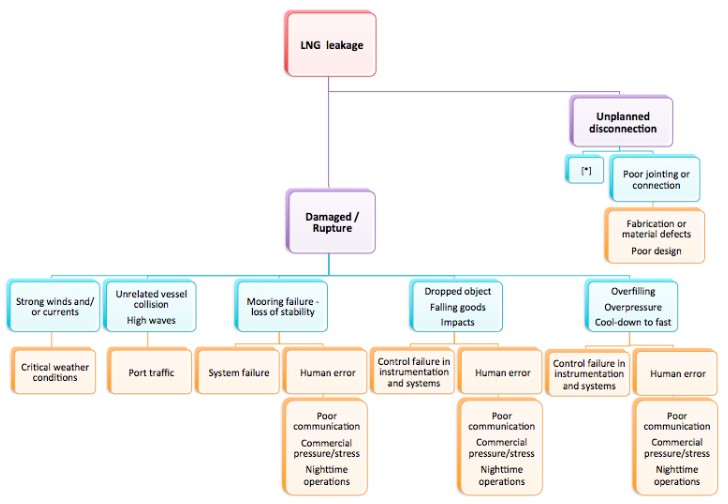
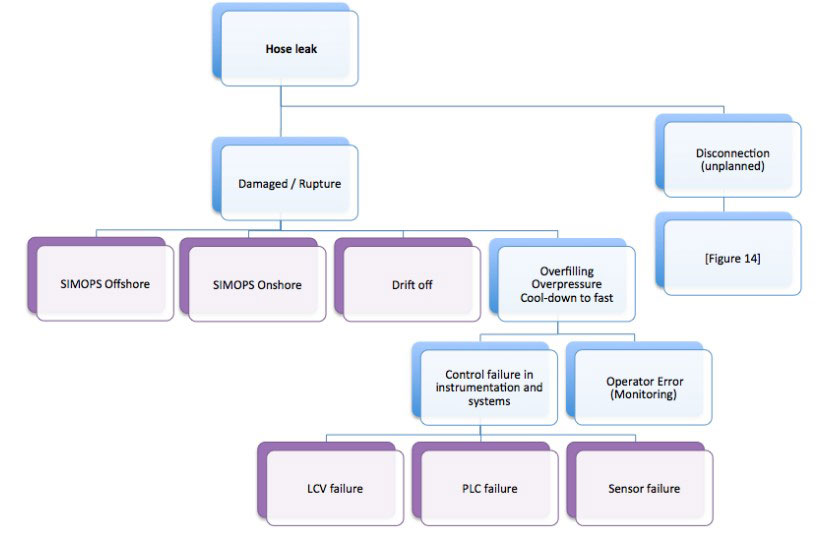
In figure 1, a hierarchy of identified failure mechanisms that could initiate a LNG leak/LOC during bunkering is shown

The orange coloured boxes represent the initial events. These could then lead to the secondary events, which are represented by the turquoise coloured boxes, and finally, the purple coloured boxes represent a leak. For unplanned disconnection the events are exactly the same as for damage/rupture case (this is marked by the [*] box), to simplify the model (i. e. the event tree is exactly the same for both main events except for the additional failure of poorly made up connections in the system).
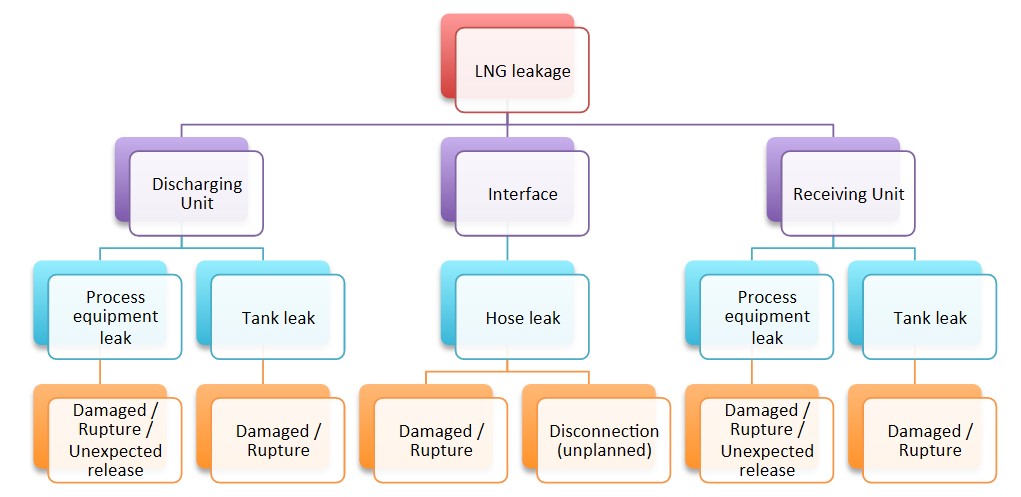
For ease of modeling the LNG system is split into process sections. Figure 2 shows how the system has been split in this study. The various process sections have different types of equipment, which needs to be considered, and will therefore be calculated and modeled for
frequencies in different ways.
Identification of Loss of Containment Scenarios
Based on the process section separation, a list of LOC scenarios has been identified:
- Hose leakage – small.
- Hose leakage – medium.
- Hose leakage – large (FBR).
- Hose disconnection – ERC works.
- Hose disconnection – ERC fails (FBR).
- Discharging tank leakage.
- Receiving tank leakage.
- Discharge line (piping, flanges, valves, pump etc.) leakage – small.
- Discharge line leakage – medium.
- Discharge line leakage – large (FBR).
- Receiving line leakage – small.
- Receiving line leakage – medium.
- Receiving line leakage – large (FBR).
All of these scenarios will be evaluated for emergency shutdown system (ESD) working, ESD failure with operator intervention, and ESD and operator failure.
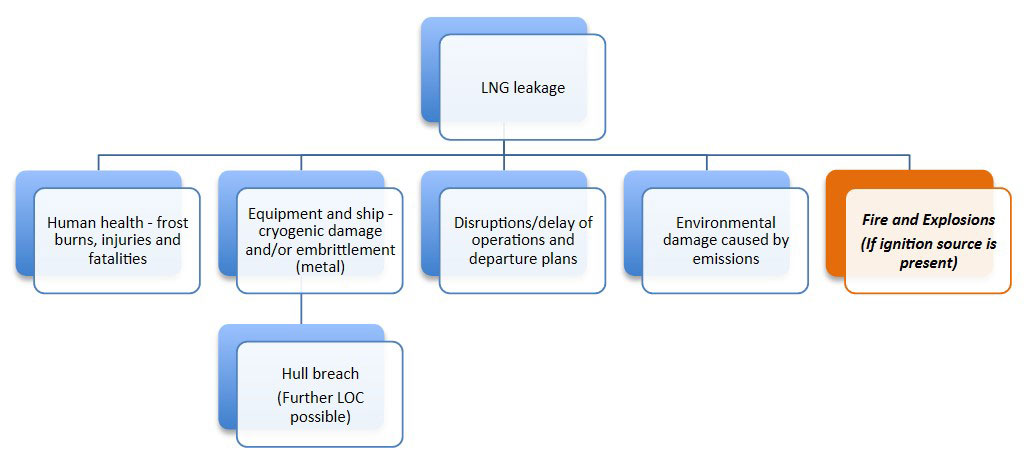
LNG Leak Consequences
The consequences reflect the LNG hazards and outcomes of a leak discussed in article Ship to Ship Bunkering Operations of the Liquefied Natural GasLNG. Human accidents due to frost burns require very close contact with LNG, and realistically this will only be a risk to the LNG transfer operators, not third party individuals. Equipment damage and environmental effects are also critical issues, but not related to safety zone calculations. The main concern for this study is the consequence of fire and explosions. Fire and explosions does however not happen as a direct result of the leak. Fire and explosion requires a leak, a mix with air at correct concentrations and the presence of an ignition source. The calculation of leak probability is the largest part of the workload, while the likelihood of ignition presences is added as a single probability ranging from 0-100 % probability per leak event.
Risk Analysis
Frequency Analysis
The frequency analysis determines the likelihood of a release of hazardous LNG/NG from process equipment for LNG bunkering. The objective of the LEAK frequency analysis is to estimate the frequency of accidental releases originating from the process equipment of the discharging and receiving unit in a Ship to Ship Bunkering Operations of the Liquefied Natural Gasship-to-ship (STS) LNG bunkering system. The interface between the discharging and receiving units, the cryogenic transfer hose, will be covered separately through fault tree analysis.
The frequency analysis combined with the hole size distribution are fundamental for the consequence- and risk estimates. The aggregate frequency analysis result will subsequently provide inputs for PHAST and PHASTRisk calculations and modeling. All frequencies will be established on a per bunkering operation basis.
Transfer Hose Failure Frequencies
The interface between the two units covers the cryogenic hose and vapor return line. This process section cannot be calculated using LEAK software as there is no data covering hoses and in particular not cryogenic. To produce leak frequencies for the hose, a fault tree is created and events leading to a leakage are considered at a fundamental level. The aim is to create generic failure frequencies for flexible cryogenic transfer hoses.
Current standard practice is to use data from Advisory Committee on Dangerous Substances (ACDS) on loading arm frequencies directly. ACDS is considered the most representative data on LNG bunkering systems so far. Loading arms are more complex fixed pipes with multiple swivel systems, and differ significantly from hose based systems in terms of the fault tree. Loading arms will as a consequence include other factors in addition to considering the ACDS. This will be a more conservative approach, and it also shows the procedure in calculating frequencies from initial to main event.
DNV RP accident scenarios
Accidents scenarios, which should be considered for relevance.
| LNG accident scenarios | ||
|---|---|---|
| Source of release | Scenario | Possible causes |
| General process and cargo handling | Accidental release from equipment and piping | Lack of flange tightness |
| Defective gasket | ||
| Weld defects | ||
| Corrosion | ||
| Impact | ||
| Supporting structure damage | ||
| External fire | ||
| Overpressure (e. g. pressure tests during commission) | ||
| Embrittlement | ||
| Earthquake, floods and other natural hazards | ||
| Accidental release from LNG tanks at jetty or on ships | Ship collision | Passing ship adrift |
| Ship pressure relief valve | Overpressure | |
| Rollover | ||
| On shore storage | Tank leakage | Dropped in tank pump |
| Internal or external leak in tank bottom or wall | ||
| Earthquake | ||
| Catastrophic rupture and leakages | ||
| Tank PSV release | Tank overfilling | |
| Tank overpressure | ||
| Rollover | ||
| BLEVE | Fire impact on pressurized hydrocarbon liquid containers. BLEVE is only considered as a potential threat for pressurised storage tank, where the loadbearing structure is exposed to fire loads. | |
| Loading/unloading lines | Leaks from piping and manifold | See general |
| Accidental release from the loading arm or hose | Leak/full bore rupture | Mechanical failure mode |
| Loss of mooring, drift off | ||
| Passing ship adrift | ||
| Ship collision | ||
| LNG truck | Releases during transfer | Rupture of transfer hoses, truck or piping. Operational errors, mechanical errors. |
| Catastrophic rupture, warm BLEVE | ||
| LNG supply ship | Leakage from cargo tank | Structural damage |
| Collision damage if this is identified as a credible risk in the HAZID | ||
This section will present what is considered initial events, which could lead to LNG leakage or LOC taking place and explanations for determining event frequencies. The assumptions made will be summarized. When the relevant events are determined, the “fault tree” (excel add-in) will be used to calculate the frequencies for this process section of the transfer system.
Based on the HAZID two main types of failures have been identified for the flexible cryogenic transfer hose: an unplanned disconnection (of the breakaway coupling) and damage or rupture of the hose, see figure 12.
Fault Tree
In this study, nine initial events have been identified, and five gates. A full picture and input overview for the fault tree model can be seen on the table below.
| Cut sets: | {1} {2} {3} {4, 7} {8} {9} {5-7} {6, 7} | |||
|---|---|---|---|---|
| Unused Nodes: | ||||
| Frequency: | 8,3499E-05 | 1/Operation | ||
| Time Period: | 0 | Operation | ||
| Top Gate: | 0 | |||
| Event/Gate | No | Type | Data | Description |
| Event-base | 1 | Frequency | 2,30E-08 | SIMOPS Offshore |
| Event-base | 2 | Frequency | 1,40E-05 | SIMOPS Onshore |
| Event-base | 3 | Frequency | 6,70E-08 | Drift off |
| Event-base | 4 | Frequency | 3,47E-05 | PLC failure |
| Event-base | 5 | Frequency | 5,96E-06 | LCV failure |
| Event-base | 6 | Frequency | 7,06E-06 | Sensor failure |
| Event-base | 7 | Frequency | 1,00E-05 | Operator Error (Monitoring) |
| Event-base | 8 | Frequency | 6,88E-05 | Equipment failures |
| Event-base | 9 | Frequency | 6,10E-07 | Operator Error (Connection) |
| Gate | 0 | Or | G1, G2 | Hose Leakage |
| Gate | 1 | Or | E1, E2, E3, E4 | Damaged/Rupture |
| Gate | 2 | Or | E1, E2, E3, G3, G5 | Disconnection (Unplanned) |
| Gate | 3 | And | G4, E7 | Overfilling – Overpressure – Cool dowm to fast |
| Gate | 4 | Or | E4, E5, E6 | Control failure in instrumentation and systems |
| Gate | 5 | Or | E8, E9 | Connection failures |
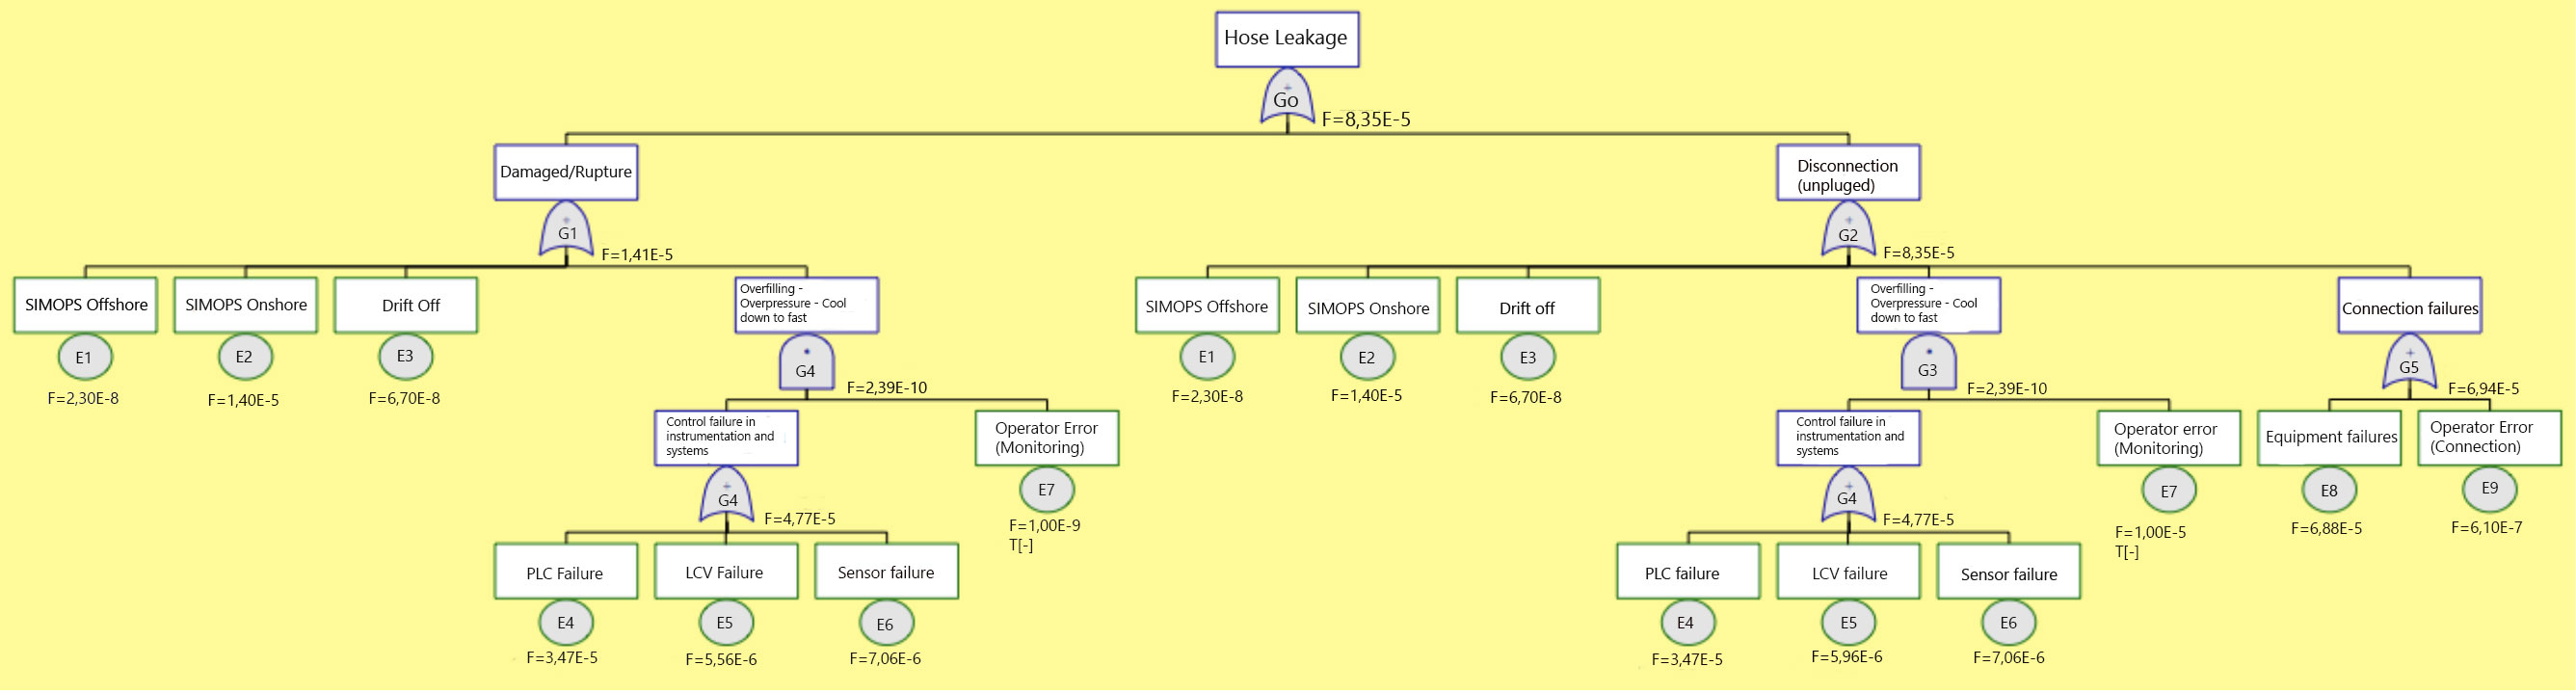
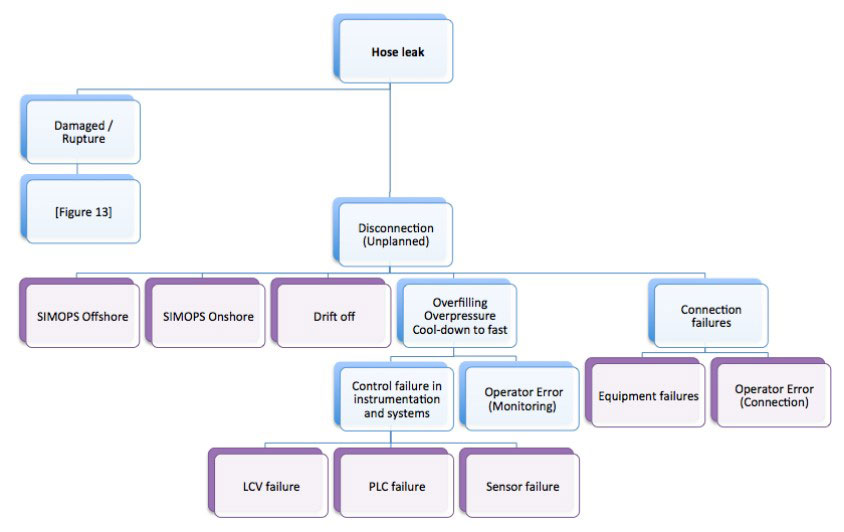
The following two figures, 3 and 4, will provide an overview over initial events considered (purple coloured boxes) and gates (blue coloured boxes) for establishing the frequencies.
Due to space limitations the total model is split in two sections: figure 3 covers damage rupture events and figure 4 covers disconnection.
SIMOPS Offshore
SIMOPS Offshore are simultaneous operations taking place offshore. This failure event relates to collision risk and frequencies. This type of failure is site-specific, meaning that it will vary depending on the port traffic in that specific location. In site-specific studies, nautical activity in a port is considered and collision frequencies and their impact energies are calculated specifically. The assessment will further cover the probability of LOC scenarios. Overall, the assessment requires high amounts of port data to be completed.
This thesis is generic and not site-specific. As such it does not include considerations relevant to a specific site. The selected failure frequency represents collisions as a whole and does not include information on the size and force of the impact, nor the ensuing consequences. The frequency is considered low, and to be conservative it is assumed that all collisions lead to LOC failures for the hose. A low SIMOPS Offshore frequency is reasonable since the bunkering is considered to take place in ports or other sheltered locations, as discussed in section Ship to Ship Bunkering Operations of the Liquefied Natural GasNautical Activity.
ACDS loading arm frequency consider collisions as one of its contributors to failure. The frequency consequently used is 2,30E-07. Leak frequencies presented in ACDS is based on filling of LNG tankers, which typically last for 18-24 hours. A ferry has a much shorter duration, assumed to last two hours per bunkering operation, in this study. The frequencies are consequently modified according to duration.
Statistics must be gathered over several decades to give reliable outcome (sample population). Small-scale STS bunkering has only been a technical solution since 2001 (Norwegian ferry Glutra was the first LNG fuelled ship), and any data compiled is not considered sufficient. The chosen frequency is conservative considering that collision events have been reduced over time, attributed to introduction of dynamic positioning systems and improved communication systems, electronic charting, navigational techniques and improved procedures. Based on this, any collision frequency chosen based on historical data should be conservative to current expected frequency.
SIMOPS Onshore
SIMOPS Onshore are simultaneous operations taking place onshore and refers to failures such as dropped objects, falling goods and impacts. The LNG fuelled vessel (receiving unit) will in the case of small-scale LNG bunkering be moored to dock. In the case of limited port time, simultaneous operations such as lifting of goods might take place. If these operations fail, it could have consequences for the LNG process equipment.
OGP – Risk Assessment Data Directory, Report No. 434-08 Mechanical lifting failures, is used to provide frequencies for SIMOPS Offshore. In part two, summary of recommended data, in the table “Dropped object probabilities for mobile units (per lift)”. The mobile unit’s probability is used instead of the fixed as the receiving ship could experience movement and for STS both units are seaborne. To be conservative in the choice of frequency the total frequency used is 1,4E-05. This frequency includes all types of lifting failures for mobile units. It is also assumed that SIMOPS Onshore takes place once for every bunker operation. By assuming this we can apply the frequency directly as a per operation frequency. The assumption to assume SIMOPS every time is very conservative as current LNG bunkering guidelines advice against such operations while bunkering takes place.
Drift-off
Drift-off failures develop from mooring failure and loss of stability in vessels. This frequency can also be provided by ACDS (as for SIMOPS Offshore). The drift-off frequency is consequently 6,70E-07 for loading arm failure for larger transfers. This frequency will also be altered to fit the current study.
Overfilling, overpressure and Cool-down
Overfilling and overpressure in the tanks, can lead to failures in the rest of the process equipment. Rapid cool-down is a risk to the entire process equipment. These types of events are further divided into two initial events, which include instrumentation and/or system failure or operator error.
Control Failure in Instrumentation and Systems
Control failures in instrumentation and systems are divided into three types of failures. Frequency information on these instrumentations is gathered from OREDA, Offshore Reliability Data 5 th edition 2009, Volume 1 – Topside Equipment (pages 457, 479 and 497). The failure rates given are per hour of operation. There are 8 760 hours in a year, but bunkering only takes place a fraction of these hours.
- PLC (Programmable Logic Controller): 17,37E-06.
- LCV (Level Control Valve): 2,98E-06.
- Sensors: 3,53E-06.
These frequencies will be modified to account for frequency per bunkering operation.
Operator Error (Monitoring)
OGP – Risk Assessment Data Directory, Report No. 434-05 Human factors, in QRA table 2.7 is used to provide information on the “Human Errors”. Once proper training has been provided, monitoring of the operation for an operator is uncomplicated and repetitive. The receiving unit’s control room, where monitoring takes place, should be stress-free when in port. Based on these assumptions, the operator error for monitoring qualifies as human error type 2, with frequency 10E-04 per demand. This number is directly used as the operator error per transfer.
Connection Failures
For unplanned disconnection scenarios, connection failure is an additional event, which can take place. Connection failures can be divided between equipment failures and operator error. Both of these failures can be obtained from the ACDS and once again they will be modified to comply with bunkering time.
Equipment Failures
The frequency is combined from two initial sources and includes poor jointing or connection between the hose and pipework, and failures in the quick release connectors. A leak could occur at the flange face, resulting in an initial slow release with little impact at first, but later develop through erosion of the flange face material by the leaking fluid. The complete frequency for this failure is 6,88E-05.
Operator errors (Connections)
Prior to bunkering, the hose is connected to the vessel’s manifold. The connection is established manually by an operator, which could lead to connection errors for the hose. The ACDS provides a specific failure rate for connection failures by the operator, 6,10E-06, which will be used and modified according to bunkering time.
Transfer Hose Failure Frequency Overview
This table is a summary of the initial event frequencies that will be used in the fault tree calculations. The values presented represent failures per bunker operation, after having been modified as described for each specific failure event. The complete calculations for transfer hose (interface) failure frequency can be seen on table below:
| Hose Failure Frequency Calculations | |||||
|---|---|---|---|---|---|
| Cause/Type of failure | 18-24 hours | 2 hours | |||
| Connection failures | Failure of arm | 5,70E-05 | 5,70E-06 | ||
| Failure of quick release connection | 5,70E-06 | 5,70E-07 | Equipment failures | 6,88E-06 | |
| Failure of ships pipework | 6,10E-06 | 6,10E-07 | (total of the tree) | ||
| Operator error | 6,10E-06 | 6,10E-07 | Operator error (connection) | ||
| Ranging failures | Mooring fault | 6,70E-07 | 6,70E-08 | Drift off | |
| Passing ships | 2,30E-07 | 2,30E-08 | SIMOPS offshore/collission | ||
| All | 7,58E-05 | 7,58E-06 | |||
| Conservative reduction: | 10 | ||||
| Conservative bunkering time: | 2 | ||||
| Control failures instrumentation | |||||
| Frequencies are per hour of operation. Visit time is set to two hours | |||||
| 1 hour | 2 hours | ||||
| PLC | 1,74E-05 | 3,47E-05 | |||
| LCV | 2,98E-06 | 5,96E-06 | |||
| Sensor | 3,53E-06 | 7,06E-06 | |||
| Operator error | |||||
| Frequency defined per demand | |||||
| Operator error (tank monitoring) | 1,00E-05 | ||||
| SIMOPS onshore – lifting failures | |||||
| Frequency per lift, how often does a lift takes place? | |||||
| One lift per operation (100 %) | Half lifts (50 %) | ||||
| SIMOPS onshore | 1,40E-05 | 7,00E-06 | |||
| Initial failure event | Frequency [per bunker operation] |
|---|---|
| SIMOPS Offshore | 2,30E-08 |
| SIMOPS Onshore | 1,40E-05 |
| Drift off | 6,70E-08 |
| PLC | 3,47E-05 |
| LCV | 5,96E-06 |
| Sensor | 7,06E-06 |
| Operating error (monitoring) | 1,00E-05 |
| Equipment failures | 6,88E-06 |
| Operator error (connection) | 6,10E-07 |
When this information is added to the fault tree excel add-in, (shown on table here), these are the excel input values. The next table illustrates the calculations made and the model, the following results are produced:
| Leakage scenario | Frequency [per operation] |
|---|---|
| Damaged/ruptured total | 1,41E-05 |
| Small (70 %) | 9,87E-06 |
| Medium (25 %) | 3,53E-06 |
| Large (5 %) | 7,05E-07 |
| Disconnection total | 8,35E-05 |
Leak size distribution is another important feature to the analysis. For disconnection failures, 100 % of the total frequency is referred to as a large release or full bore rupture (FBR). In the case of damaged/ruptured failures, 70 % is a small leak, 25 % is a medium leak and the last 5 % are large leaks. The Dutch guideline for risk calculations, also known as HARI, is a source open to the public. It estimates that hose leakage leads to rupture in 10% of the cases when hoses are involved. This is however not including LNG transfer hoses with its advanced technologies. DNV GL practice in newer frequency analysis studies estimate that a 5 % rupture scenario for large leaks is sufficiently conservative.
Read also: Basic Information about Liquefied Natural Gas Bunkering Operations
The categorization of leak event into large (rupture), medium and small sizes is a judgment based on DNV’s estimates of the leak sizes typical for all hose failures, together with comparison against hole size distributions for typical process leaks.
Vapor return
The transfer system is equipped with a vapor return line. Source data provided and gathered does not cover the vapor return line explicitly. Vapor return line leaks are generally much less significant than for the LNG line itself. The same frequencies will be used for the vapor return line as for the LNG line for the various process sections. This means that we consider the same failure rates for vapor return line as LNG line. Vapor return line will be parallel to the LNG line for every process section including; discharging line, receiving line and transfer hose.
Process Equipment Failure Frequency
To calculate frequencies for the process equipment on either unit (except for tanks, see below Tanks Failure Frequency), LEAK software can be used. To obtain the correct frequencies the system needs to be analyzed and equipment needs to be counted, and grouped together. Piping and instrumentation diagram (P&ID) has been analyzed for bunkering scenarios and the following system table has been concluded as representative of a typical STS arrangement.
| STS bunkering equipment count for LEAK | ||||
|---|---|---|---|---|
| Process section | Line (Segment) | Equipment | ||
| Type | Number | Size | ||
| Discharging Unit | ||||
| LNG Pump | LNG line | Small bore fittings | 7 | 0,5 |
| Flanges | 1 | 1 | ||
| 1 | 4 | |||
| 7 | 6 | |||
| 4 | 10 | |||
| Actuated valve | 1 | 2 | ||
| 1 | 4 | |||
| 1 | 6 | |||
| Manual valve | 15 | 1 | ||
| 10 | 2 | |||
| 1 | 3 | |||
| 3 | 4 | |||
| 1 | 6 | |||
| 1 | 10 | |||
| Pump | 1 | – | ||
| Vapor return line | Small Bore fittings | 4 | 0,5 | |
| Flanges | 3 | 1 | ||
| 2 | 2 | |||
| 1 | 4 | |||
| Actuated valve | 1 | 2 | ||
| Manual valve | 7 | 1 | ||
| 7 | 2 | |||
| Flow meter | LNG line | Small bore fittings | 14 | 0,5 |
| Flanges | 6 | 6 | ||
| 10 | 8 | |||
| Actuated valve | – | – | ||
| Manual valve | 10 | 1 | ||
| 4 | 2 | |||
| 10 | 6 | |||
| Vapor return line | Small bore fittings | 1 | 0,5 | |
| Flanges | 4 | 4 | ||
| Actuated valve | – | – | ||
| Manual valve | – | – | ||
| Upstream to ESD valve | LNG line | Small bore fittings | – | – |
| Flanges | – | – | ||
| Actuated valve | 1 | 6 | ||
| Manual valve | 5 | 1 | ||
| 1 | 2 | |||
| 1 | 3 | |||
| 1 | 6 | |||
| Vapor return line | Small bore fittings | – | – | |
| Flanges | – | – | ||
| Actuated valve | – | – | ||
| Manual valve | – | – | ||
| Downstream, ESD valve | LNG line | Small bore fittings | 6 | 0,5 |
| Flanges | 2 | 6 | ||
| Actuated valve | – | – | ||
| Manual valve | 5 | 1 | ||
| 3 | 2 | |||
| Vapor return line | Small bore fittings | – | – | |
| Flanges | 1 | 4 | ||
| Actuated valve | 1 | 2 | ||
| Manual valve | 2 | 1 | ||
| 3 | 1 | |||
| 1 | 6 | |||
| Receiving Unit | ||||
| Bunker/inlet area | LNG line | Small bore fittings | 6 | 0,5 |
| Flanges | 2 | 6 | ||
| Actuated valve | – | – | ||
| Manual valve | 10 | 1 | ||
| 4 | 2 | |||
| 1 | 3 | |||
| 1 | 6 | |||
| Vapor return line | Small bore fittings | – | – | |
| Flanges | 1 | 4 | ||
| Actuated valve | 1 | 2 | ||
| Manual valve | 2 | 1 | ||
| 3 | 1 | |||
| 1 | 6 | |||
| Flow meter | LNG line | Small bore fittings | 14 | 0,5 |
| Flanges | 6 | 6 | ||
| 10 | 8 | |||
| Actuated valve | – | – | ||
| Manual valve | 10 | 1 | ||
| 4 | 2 | |||
| 10 | 6 | |||
| Vapor return line | Small bore fittings | 1 | 0,5 | |
| Flanges | 4 | 4 | ||
| Actuated valve | – | – | ||
| Manual valve | – | – | ||
LEAK Assumption
The following operational assumptions form the basis of the process LEAK frequency analysis:
- The operating pressure is set to 10 bar (g) for the LNG line and 2 bar (g) for the vapor return line.
- The gas/liquid distribution ratio is 0/100 for the LNG line and 95/5 for the vapor return line.
- Pump and ESD (automated valve) is only present on the discharging side.
- Both sides have flow meter.
- The system boundaries exclude the nitrogen tanks and the equipment related to purging exclusively.
- “System Modification Factor” (a function in LEAK software) is applied, which allows for piping to be excluded as separate process equipment
- All components are considered to have LNG or NG presence at all times during the active bunkering hours.
- Category calculation basis is set to hole size (not release rate). Leak will be calculated for three sizes: small, medium and large (full bore rupture). See table below.
- Process time/activity level is set to two hours.
| Hole size ranges | Min (mm) | Max (mm) |
|---|---|---|
| Small | 0 | 5 |
| Medium | 5 | 25 |
| Large (FBR) | 25 | >25 |
Hole sizes and format is based on industry standard.
Process equipment types are divided into two categories:
- Diameter dependent: process pipes, flanges, manual and actuated valves.
- Diameter independent: all other equipment e. g. pumps. For this category the leak sizes are quoted on an equipment size of 6 inches. Allowed, as leak frequencies remain the same for larger diameters.
Pipe line
A common aspect of uncertainty in QRA is associated with the frequency of inter-unit pipeline releases. Application of process pipework failure data will tend to give overly conservative values with respect to longer inter-unit pipe segments. The historical data for process piping from the HCRD is therefore not used for this part of the assessment. Instead, the normal practice is used, which is to apply a factor of 25 % to the overall release frequency to account for process piping contribution.
There is however evidence that the HCRD data gives much higher failure frequencies than what is expected based on historical evidence for LNG facilities. Given the perceived risks associated with LNG it is often the case that fully welded pipelines and connections are employed. This means that in a P&ID, all valves are not necessarily flanged. Based on the findings of the statistical analysis, the contribution from piping in the LNG facility is reduced to 10 % of that of process piping on a regular Oil & Gas offshore platform. Overall piping contribution to the release frequency is then 2,5 %. Topside process equipment contributes to 97,5 % of the release frequency and is not the same as inter-unit pipework. To account for topside process equipment, 100 % is divided by 97,5 %. The overall factor applied to the detailed part count to include the piping contribution is 1,026 (i. e. the increase is 2,6 %).
LEAK Scenarios
The HCRD data includes many leaks that have occurred at low system pressures. LEAK software is consequently set to separate between different types of leak pressures. Figure 5 displays the leak scenarios, their ratios and how they relate.
LEAK functions is set to calculate separate hole size frequencies for the tree types of leak scenarios:
- Total leak frequency (100 %).
- Full pressure leak frequency (94 %): assume a leak trough the defined hole, beginning at the normal operating pressure, until controlled by isolation and blow down, with a probability of isolation/blow down failure.
- Zero pressure leak frequency (6 %): this scenario includes all leaks where the pressure inside the leaking equipment is virtually zero (0,01 bar (g) or less).
Normally a quantitative risk assessment will assume that all leaks are full leaks because these have the potential of developing into serious events endangering personnel and critical safety functions. 68 However, in this study, the pressure in the system is set to 10 bar (g), which is quite high. Zero pressure leaks will therefore be included as it is reasonable that pressures can be lower than 10 bar (g).
The LEAK software is presently not capable of producing results for all the different leak pressures in one operation. The total leak frequencies produced will consequently have an error. Additionally the results will produce yearly averaged frequencies and not the per operation frequencies which this study requires. Certain parts of the LEAK frequency analysis have consequently been done manually.
- Run leak with normal operating pressure to estimate full pressure leak frequencies. If limited leak (51 %) or full leak (49 %) is needed specifically the values can be obtained from taking the correct ratio from the full pressure leaks.
- Change pressure to 0,01 bar (g) for the entire system and re-run the model, in order to get the leak frequency distribution for zero pressure leaks.
- Add full pressure leak and zero pressure leak frequencies to yield the correct total leak frequencies.
- LEAK generates averaged yearly frequencies. There are 8 760 hours in a year and a bunkering operation takes two hours. The frequencies are modified accordingly.
Process Equipment Failure Frequencies Overview
LEAK will produce large amounts of data for the different settings, such as:
- leak scenarios,
- hole sizes,
- process sections,
- segments and equipment.
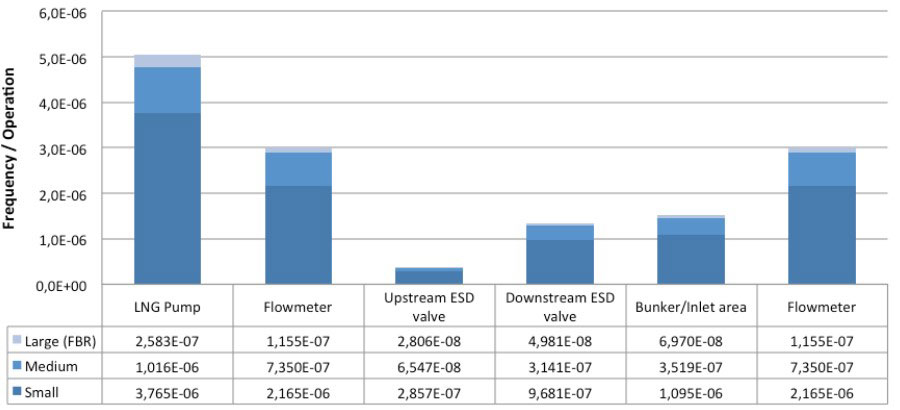
In this study, total leaks (100 %) have been considered. All three-hole sizes have been considered in order to ascertain compatibility with outflow modeling in QRA. The relevant frequencies, for this study, in terms of process sections, are the ones where the main LNG line is split from the vapor return line, and the discharging and the receiving sides are separated from each other (see figure 6 and 7).
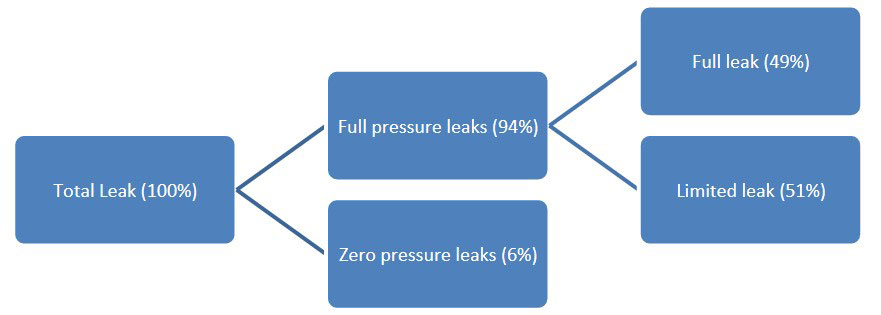
Figure 6 provides the initial results from LEAK with full and zero pressure leaks. In the next figure, the total leak has been calculated. First column is calculated as yearly average, while the second is per operation. The frequency cells marked with blue to the far right in figure 7, are the frequencies used for consequence modeling.

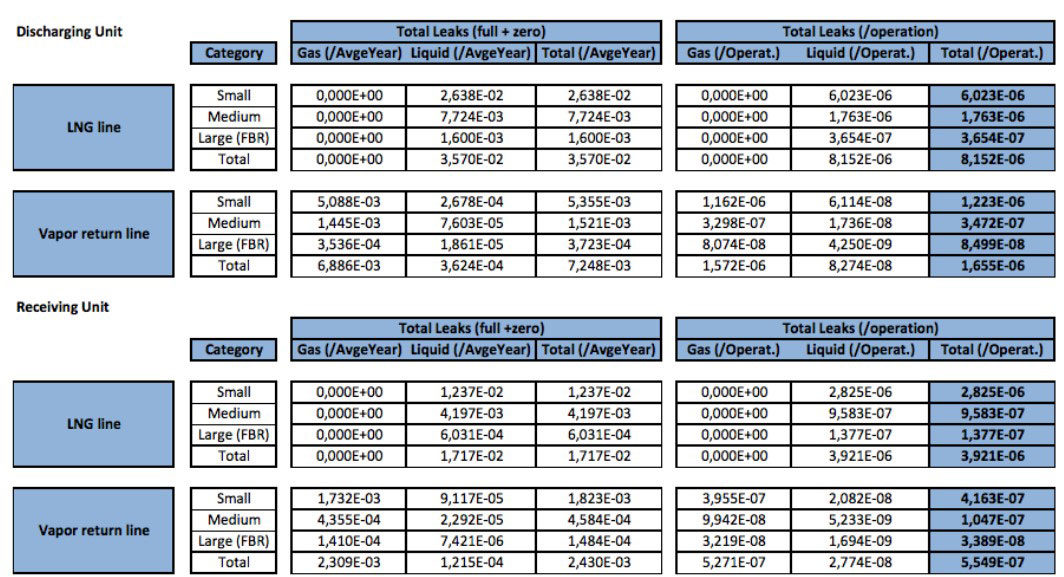
The below table “LEAK Frequency Distribution by Process Section”, includes information which will not directly be used in consequence modeling. It is however added to demonstrate the variation in failure frequency depending on process section, and how failure will vary between different hole size categories. Small leaks have a much higher likelihood of taking place than large leaks.
Tanks Failure Frequencies
The frequency for discharging and receiving tanks will be set as the collision frequency, because rupture in the tank is only dependent on collisions as a realistic option. The frequencies will therefore be the same as the SIMOPSs frequency for the hose. The bunker barge tank is in general more exposed compared to receiving tank that is usually integrated into the structure. It is assumed that collision only leads to tank damages 5 % of the time for discharging unit, and 1 % for the receiving unit. These assumptions are also based on ship size and structure. The LNG tanks are double hull, able to withstand relatively high impacts of outside force before rupture.
For SIMOPS Offshore the representative frequency is 2,30E-07, reduced with factor of 10 to be consistent with bunkering time of two hours and multiplied with the relevant probabilities of rupture due to collision.
- Discharging (5 %): 1,15E-09.
- Receiving (1 %): 2,30E-10.
When tanks rupture there are no method for stopping the leak, so in this scenario the whole static inventory will disperse and be lost. This means that there is no isolation time and no dynamic inventory for this risk scenario. The tanks will be considered full of LNG in the case of a rupture.
Consequence Modeling
In this section, output is generated which will provide input for concluding the necessary range of safety zones. This section will cover PHAST and PHASTRisk input values (i. e. constant and variable parameters), assumptions made and software working procedure.
Input data for PHAST includes frequency and inventory calculation. For calculation purposes, the data will be added in excel. The file is called “Consequence Modeling Calculations”.
The file is incorporated and its content includes:
- INPUTS: constant parameters, dimensions and weather data.
- FREQUENCIES: frequencies for the initial 13 LOC scenarios before split into the sub scenarios of ESD and ERC failures.
- TRANSFER HOSE: two tables; the first table includes input data (frequencies, isolation time and hole size), and the second table providing with PHAST outputs (release rate and duration) and complete inventory calculations.
- PROCESS EQUIPMENT: split between discharging and receiving line. Includes the same two tables as for transfer hose.
- TANKS: equal information as for transfer hose.
Frequency Limit
DNV internal guidelines for frequency calculations (G16 LNG guidelines) suggest not including scenarios with frequencies lower than 10-8 . This is because these scenarios are too small to contribute to the 10-6 contour.
All the frequencies identified on the “FREQUENCIES” page should be considered but when they undergo the final sub scenario distribution of ESD and ERC failure the frequencies drop considerably. The final scenario frequency considered in PHAST and PHASTRisk modeling will be included in the tables for “TRANSFER HOSE”, “PROCESS EQUIPMENT” and “TANKS” respectively.
Many of these are well below the limit (i. e. tank frequencies of 10-11 and 10-12) and could therefore have been excluded. Exclusion takes place in modeling as there is additional work to adding any risk scenario. All scenarios, regardless of low frequency, will be considered in this study to provide results for all process sections of the bunkering system. A total of 65 LOC scenarios are assessed.
| INPUTS | ||
|---|---|---|
| Release height [m] | 0,10 | |
| Flow velocity max [m/s] | 10,00 | |
| Flow rate LNG/Pump rate [m3/h] | 500,00 | |
| Vapor flow rate [m3/h] | 50,00 | |
| Discharge rate (% of flow rate) | 120 % | |
| Transfer properties | ||
| Fluid/Material | Methane | |
| LNG Density [kg/m3/h] | 425 | * depends on pressure and temp |
| Vapor Density | 3,4 | * depends on pressure and temp |
| Ignition temperature [C] | 500 | |
| LEL – UEL | 5-15 % | |
| LNG line pressure [barg] | 10 | |
| LNG line temp [C] | -162 | |
| Vapor return line pressure [barg] | 2 | |
| Vapor return line temperature [C] | -100 | |
| Tank pressure [barg] | 3 | |
| Tank temperature [C] | -162 | |
| Emergency Shutdown Detection | ||
| Isolation Times | [Seconds] | |
| ESD works, small leak | 120 | |
| ESD works, medium and large | 15 | |
| ESD fails, operator, all sizes | 120 | |
| ESD and operator fails | 1 800 | |
| ERC works | 0 | |
| Failure probability | ||
| ESD (automatically) | 0,001 | |
| Operator | 0,1 | |
| ERC | 0,1 | |
| Equipment Dimensions | |||||
|---|---|---|---|---|---|
| Bunker Area | Diameter [in] | Diameter [m] | Length [m] | Volume [m3] | |
| Hose | LNG line | 6 | 0,152 | 8 | 0,15 |
| Vapor return | 2 | 0,051 | 8 | 0,02 | |
| Discharge line | LNG line | 6 | 0,152 | 10 | 0,18 |
| Vapor return | 2 | 0,051 | 10 | 0,02 | |
| Receiving line | LNG line | 6 | 0,152 | 20 | 0,36 |
| Vapor return | 2 | 0,051 | 20 | 0,04 | |
| Tanks | Discharging | 200 | |||
| Receiving x2 | 200 | ||||
| 1 inch = 0,0254 m | |||||
| Weather data | ||||||
|---|---|---|---|---|---|---|
| Wind speed [m/s] | 2 | 5 | 2 | 5 | 2 | 5 |
| Pasquill stability | A | A | C | C | E | E |
| Atm. Temp [C] | 20 | 20 | 20 | 20 | 20 | 20 |
| Relative Humidity | 0,5 | 0,5 | 0,5 | 0,5 | 0,5 | 0,5 |
| Solar radiation flux [kW/m2] | 0,5 | 0,5 | 0,5 | 0,5 | 0,5 | 0,5 |
| Surface type | Open water (spill over water)/Default (spill over land) | |||||
| FREQIENCIES | ||
|---|---|---|
| Hose | Frequency [per operation] | Distribution [%] |
| Damaged/ruptured total | 1,41E-05 | 100 % |
| Small (70 %) | 9,87E-06 | 70 % |
| Medium (25 %) | 3,53E-06 | 25 % |
| Large – FBR (5 %) | 7,05E-07 | 5 % |
| Tanks | Frequency [per operation] | Duration [%] |
| Discharging | 1,15E-09 | 100 % |
| Receiving (x2 tanks) | 2,30E-10 | 100 % |
| Process Equipment | Frequency [per operation] | Distribution [%] |
| Discharging – LNG total | 8,15E-06 | 100 % |
| Small | 6,02E-06 | 74 % |
| Medium | 1,76E-06 | 22 % |
| Large – FBR | 3,65E-07 | 4 % |
| Discharging – Vapor | 1,66E-06 | 100 % |
| Small | 1,22E-06 | 73 % |
| Medium | 3,47E-07 | 21 % |
| Large – FBR | 8,50E-08 | 5 % |
| Receiving – LNG | 3,92E-06 | 100 % |
| Small | 2,83E-06 | 72 % |
| Medium | 9,58E-07 | 24 % |
| Large – FBR | 1,38E-07 | 4 % |
| Receiving – Vapor | 5,55E-07 | 100 % |
| Small | 4,16E-07 | 75 % |
| Medium | 1,05E-07 | 19 % |
| Large – FBR | 3,39E-08 | 6 % |
| Mitigating measures: reaction to LOC | |
|---|---|
| The frequencies provided for the above scenarios needs to be further split into sub scenarios. The final frequencies will depend on failure probabilities of the various mitigating measures. | |
| Damage/Rupture | |
| ESD works | 99,90 % |
| ESD fails, operator intervention | 0,09 % |
| ESD and operator fails | 0,01 % |
| Total | 100,00 % |
| Disconnection | |
| ERC works | 90,00 % |
| ERC fails, ESD works | 9,99 % |
| ERC fails, ESD fails and operator intervention | 0,01 % |
| ERC fails, ESD and operator fails | 0,00 % |
| Total | 100,00 % |
| TRANSFER HOSE | ||||||
|---|---|---|---|---|---|---|
| Leak scenario description | Frequency [1/operation] | Hole sizes [mm] | Isolation time [s] | |||
| LNG Line | Damage/Rupture | Small | ESD works | 9,86E-06 | 5 | 120 |
| ESD fails but operator intervenes | 8,88E-09 | 5 | 120 | |||
| ESD and operator fails | 9,87E-10 | 5 | 1 800 | |||
| Medium | ESD works | 3,53E-06 | 25 | 15 | ||
| ESD fails but operator intervenes | 3,18E-09 | 25 | 120 | |||
| ESD and operator fails | 3,53E-10 | 25 | 1 800 | |||
| Large – FBR | ESD works | 7,04E-07 | 152 | 15 | ||
| ESD fails but operator intervenes | 6,35E-10 | 152 | 120 | |||
| ESD and operator fails | 7,05E-11 | 152 | 1 800 | |||
| Disconnection | ERC works | – | 7,52E-05 | 0 | 0 | |
| ERC fails (rupture) | ESD works | 8,34E-06 | 152 | 15 | ||
| ESD fails but operator intervenes | 7,52E-09 | 152 | 120 | |||
| ESD and operator fails | 8,35E-10 | 152 | 1 800 | |||
| Vapor return line | Damage/Rupture | Small | ESD works | 9,86E-06 | 5 | 120 |
| ESD fails but operator intervenes | 8,88E-09 | 5 | 120 | |||
| ESD and operator fails | 9,87E-10 | 5 | 1 800 | |||
| Medium | ESD works | 3,53E-06 | 25 | 15 | ||
| ESD fails but operator intervenes | 3,18E-09 | 25 | 120 | |||
| ESD and operator fails | 3,53E-10 | 25 | 1 800 | |||
| Large – FBR | ESD works | 7,04E-07 | 51 | 15 | ||
| ESD fails but operator intervenes | 6,35E-10 | 51 | 120 | |||
| ESD and operator fails | 7,05E-11 | 51 | 1 800 | |||
| Disconnection | ERC | – | 7,52E-05 | 0 | 0 | |
| ERC fails (rupture) | ESD works | 8,34E-06 | 51 | 15 | ||
| ESD fails but operator intervenes | 7,52E-09 | 51 | 120 | |||
| ESD and operator fails | 8,35E-10 | 51 | 1 800 | |||
| TRANSFER HOSE | Phast outputs | Inventory | ||||||
|---|---|---|---|---|---|---|---|---|
| Leak scenario description | Release [kg/s] | Release duration [s] | Static [kg] | Dynamic [kg] | Total [kg] | |||
| LNG Line | Damage/Rupture | Small | ESD works | 0,343 | 301 | 62,02 | 41,16 | 103,2 |
| ESD fails but operator intervenes | 0,343 | 301 | 62,02 | 41,16 | 103,2 | |||
| ESD and operator fails | 0,343 | 1 981 | 62,02 | 617,40 | 679,4 | |||
| Medium | ESD works | 8,580 | 22 | 62,02 | 128,70 | 190,7 | ||
| ESD fails but operator intervenes | 8,580 | 127 | 62,02 | 1 029,60 | 1 091,6 | |||
| ESD and operator fails | 8,580 | 1 807 | 62,02 | 15 444,00 | 15 506,0 | |||
| Large – FBR | ESD works | 75,000 | 16 | 62,02 | 1 125,00 | 1 187,0 | ||
| ESD fails but operator intervenes | 75,000 | 121 | 62,02 | 9 000,00 | 9 062,0 | |||
| ESD and operator fails | 75,000 | 1 801 | 62,02 | 135 000,00 | 135 062,0 | |||
| Disconnection | ERC works | – | 0,000 | 0 | 0,00 | 0,00 | 0,0 | |
| ERC fails (rupture) | ESD works | 75,000 | 16 | 62,02 | 1 125,00 | 1 187,0 | ||
| ESD fails but operator intervenes | 75,000 | 121 | 62,02 | 9 000,00 | 9 062,0 | |||
| ESD and operator fails | 75,000 | 1 801 | 62,02 | 135 000,00 | 135062,0 | |||
| Vapor return line | Damage/Rupture | Small | ESD works | 0,011 | 125 | 0,06 | 1,31 | 1,4 |
| ESD fails but operator intervenes | 0,011 | 125 | 0,06 | 1,31 | 1,4 | |||
| ESD and operator fails | 0,011 | 1 805 | 0,06 | 19,71 | 19,8 | |||
| Medium | ESD works | 0,273 | 15 | 0,06 | 4,10 | 4,2 | ||
| ESD fails but operator intervenes | 0,273 | 120 | 0,06 | 32,76 | 32,8 | |||
| ESD and operator fails | 0,273 | 1 800 | 0,06 | 491,40 | 491,5 | |||
| Large – FBR | ESD works | 10,170 | 15 | 0,06 | 152,55 | 152,6 | ||
| ESD fails but operator intervenes | 10,170 | 120 | 0,06 | 1 220,40 | 1 220,5 | |||
| ESD and operator fails | 10,170 | 1 800 | 0,06 | 18 306,00 | 18 306,1 | |||
| Disconnection | ERC | – | 0,000 | 0 | 0,00 | 0,00 | 0,0 | |
| ERC fails (rupture) | ESD works | 10,170 | 15 | 0,06 | 152,55 | 152,6 | ||
| ESD fails but operator intervenes | 10,170 | 120 | 0,06 | 1 220,40 | 1 220,5 | |||
| ESD and operator fails | 10,170 | 1 800 | 0,06 | 18 306,00 | 18 306,1 | |||
| DISCHARGING LINE | ||||||
|---|---|---|---|---|---|---|
| Leak scenario description | Frequency [1/operation] | Hole sizes [mm] | Isolation time [s] | |||
| LNG Line | Damage/Rupture | Small | ESD works | 6,01E-06 | 5 | 120 |
| ESD fails but operator intervenes | 5,42E-09 | 5 | 120 | |||
| ESD and operator fails | 6,02E-10 | 5 | 1 800 | |||
| Medium | ESD works | 1,76E-06 | 25 | 15 | ||
| ESD fails but operator intervenes | 1,58E-09 | 25 | 120 | |||
| ESD and operator fails | 1,76E-10 | 25 | 1 800 | |||
| Large – FBR | ESD works | 3,65E-07 | 152 | 15 | ||
| ESD fails but operator intervenes | 3,29E-10 | 152 | 120 | |||
| ESD and operator fails | 3,65E-11 | 152 | 1 800 | |||
| Vapor return line | Damage/Rupture | Small | ESD works | 1,22E-06 | 5 | 120 |
| ESD fails but operator intervenes | 1,10E-09 | 5 | 120 | |||
| ESD and operator fails | 1,22E-10 | 5 | 1 800 | |||
| Medium | ESD works | 3,47E-07 | 25 | 15 | ||
| ESD fails but operator intervenes | 3,12E-10 | 25 | 120 | |||
| ESD and operator fails | 3,47E-11 | 25 | 1 800 | |||
| Large – FBR | ESD works | 8,49E-08 | 51 | 15 | ||
| ESD fails but operator intervenes | 7,65E-11 | 51 | 120 | |||
| ESD and operator fails | 8,50E-12 | 51 | 1 800 | |||
| DISCHARGING LINE | Phast outputs | Inventory | ||||||
|---|---|---|---|---|---|---|---|---|
| Leak scenario description | Release rate [kg/s] | Release duration [s] | Static [kg] | Dynamic [kg] | Total [kg] | |||
| LNG Line | Damage/Rupture | Small | ESD works | 0,343 | 346 | 77,53 | 41,16 | 118,7 |
| ESD fails but operator intervenes | 0,343 | 346 | 77,53 | 41,16 | 118,7 | |||
| ESD and operator fails | 0,343 | 2 026 | 77,53 | 617,40 | 694,9 | |||
| Medium | ESD works | 8,580 | 24 | 77,53 | 128,70 | 206,2 | ||
| ESD fails but operator intervenes | 8,580 | 129 | 77,53 | 1 029,60 | 1 107,1 | |||
| ESD and operator fails | 8,580 | 1 809 | 77,53 | 15 444,00 | 15 521,5 | |||
| Large – FBR | ESD works | 75,000 | 16 | 77,53 | 1 125,00 | 1 202,5 | ||
| ESD fails but operator intervenes | 75,000 | 121 | 77,53 | 9 000,00 | 9 077,5 | |||
| ESD and operator fails | 75,000 | 1 801 | 77,53 | 135 000,00 | 135 077,5 | |||
| Vapor return line | Damage/Rupture | Small | ESD works | 0,011 | 126 | 0,07 | 1,31 | 1,4 |
| ESD fails but operator intervenes | 0,011 | 126 | 0,07 | 1,31 | 1,4 | |||
| ESD and operator fails | 0,011 | 1 806 | 0,07 | 19,71 | 19,8 | |||
| Medium | ESD works | 0,273 | 15 | 0,07 | 4,10 | 4,2 | ||
| ESD fails but operator intervenes | 0,273 | 120 | 0,07 | 32,76 | 32,8 | |||
| ESD and operator fails | 0,273 | 1 800 | 0,07 | 491,40 | 491,5 | |||
| Large – FBR | ESD works | 10,170 | 15 | 0,07 | 152,55 | 152,6 | ||
| ESD fails but operator intervenes | 10,170 | 120 | 0,07 | 1 220,40 | 1 220,5 | |||
| ESD and operator fails | 10,170 | 1 800 | 0,07 | 18 306,00 | 18 306,1 | |||
| RECEIVING LINE | ||||||
|---|---|---|---|---|---|---|
| Leak scenario description | Frequency [1/operation] | Hole sizes [mm] | Isolation time [s] | |||
| LNG Line | Damage/Rupture | Small | ESD works | 2,83E-06 | 5 | 120 |
| ESD fails but operator intervenes | 2,55E-09 | 5 | 120 | |||
| ESD and operator fails | 2,83E-10 | 5 | 1 800 | |||
| Medium | ESD works | 9,57E-07 | 25 | 15 | ||
| ESD fails but operator intervenes | 8,62E-10 | 25 | 120 | |||
| ESD and operator fails | 9,58E-11 | 25 | 1 800 | |||
| Large – FBR | ESD works | 1,38E-07 | 152 | 15 | ||
| ESD fails but operator intervenes | 1,24E-10 | 152 | 120 | |||
| ESD and operator fails | 1,38E-11 | 152 | 1 800 | |||
| Vapor return line | Damage/Rupture | Small | ESD works | 4,16E-07 | 5 | 120 |
| ESD fails but operator intervenes | 3,74E-10 | 5 | 120 | |||
| ESD and operator fails | 4,16E-11 | 5 | 1 800 | |||
| Medium | ESD works | 105E-07 | 25 | 15 | ||
| ESD fails but operator intervenes | 9,45E-11 | 25 | 120 | |||
| ESD and operator fails | 1,05E-11 | 25 | 1 800 | |||
| Large – FBR | ESD works | 3.39E-08 | 51 | 15 | ||
| ESD fails but operator intervenes | 3,05E-11 | 51 | 120 | |||
| ESD and operator fails | 3,39E-12 | 51 | 1 800 | |||
| RECEIVING LINE | Phast | Inventory | ||||||
|---|---|---|---|---|---|---|---|---|
| Leak scenario description | Release rate [kg/s] | Release duration [s] | Static [kg] | Dynamic [kg] | Total [kg] | |||
| LNG Line | Damage/Rupture | Small | ESD works | 0,343 | 572 | 155,05 | 41,16 | 196,2 |
| ESD fails but operator intervenes | 0,343 | 572 | 155,05 | 41,16 | 196,2 | |||
| ESD and operator fails | 0,343 | 2 252 | 155,05 | 617,40 | 772,5 | |||
| Medium | ESD works | 8,580 | 33 | 155,05 | 128,70 | 283,8 | ||
| ESD fails but operator intervenes | 8,580 | 138 | 155,05 | 1 029,60 | 1 184,7 | |||
| ESD and operator fails | 8,580 | 1 818 | 155,05 | 15 444,00 | 15 599,1 | |||
| Large – FBR | ESD works | 75,000 | 17 | 155,05 | 1 125,00 | 1 280,1 | ||
| ESD fails but operator intervenes | 75,000 | 122 | 155,05 | 9 000,00 | 9 155,1 | |||
| ESD and operator fails | 75,000 | 1 802 | 155,05 | 135 000,00 | 135 155,1 | |||
| Vapor return line | Damage/Rupture | Small | ESD works | 0,011 | 133 | 0,14 | 1,31 | 1,5 |
| ESD fails but operator intervenes | 0,011 | 133 | 0,14 | 1,31 | 1,5 | |||
| ESD and operator fails | 0,011 | 1 813 | 0,14 | 19,71 | 19,8 | |||
| Medium | ESD works | 0,273 | 16 | 0,14 | 4,10 | 4,2 | ||
| ESD fails but operator intervenes | 0,273 | 121 | 0,14 | 32,76 | 32,9 | |||
| ESD and operator fails | 0,273 | 1 801 | 0,14 | 491,40 | 491,5 | |||
| Large – FBR | ESD works | 10,170 | 15 | 0,14 | 152,55 | 152,7 | ||
| ESD fails but operator intervenes | 10,170 | 120 | 0,14 | 1 220,40 | 1 220,5 | |||
| ESD and operator fails | 10,170 | 1 800 | 0,14 | 18 306,00 | 18 306,1 | |||
| TANKS | |||||
|---|---|---|---|---|---|
| Leak scenario description | Frequency [1/operation] | Hole sizes [mm] | Isolation time [s] | ||
| Tank Discharging | Damage/Rupture | FBR | 1,15E-09 | 250 | NA |
| Tank Receiving 1 | Damage/Rupture | FBR | 2,30E-10 | 250 | NA |
| Tank Receiving 2 | Damage/Rupture | FBR | 2,30E-10 | 250 | NA |
| For the tanks the whole inventory will be released if a rupture first takes place. | |||||
| Tanks will be considered full for when rupture takes place. | |||||
| No isolation time and no dynamic inventories | |||||
| NA – non applicable | |||||
| TANKS | Phast | Inventory | |||||
|---|---|---|---|---|---|---|---|
| Leak scenario description | Release rate [kg/h] | Release duration [s] | Static [kg] | Dynamic [kg] | Total [kg] | ||
| Tank Discharging | Damage/Rupture | FBR | NA | NA | 85 000 | NA | 85 000 |
| Tank Receiving 1 | Damage/Rupture | FBR | NA | NA | 85 000 | NA | 85 000 |
| Tank Receiving 2 | Damage/Rupture | FBR | NA | NA | 85 000 | NA | 85 000 |
Inventory
When it comes to the PHAST inputs, some values are identified and others, like the inventory, need to be calculated. The inventory is the total mass released [kg] in the event of any risk scenario. The inventory consists of static and dynamic inventory.
- Static inventory is the LNG/NG volume that a specific process section can hold. The volume depends on the dimensions of the hose, piping or tank within the defined process section.
- Dynamic inventory is what can be released if the system is not shut down immediately and LNG/NG is still “pushed” through the system. The volume size of the dynamic inventory also depends on dimensions, but it additionally depends on pump rate, pressure, time to stop (isolation time) etc.
For smaller leaks, the inventory is limited by the release rate during the time before ESD plus the content of the hose. For larger leaks, with a release rate higher than the pump flow, the inventory is assumed to be equal to 120 % of the pump flow (see discharge rate below) multiplied by the time to ESD plus the hose content.
Inventory Calculations
Static Inventory (SI):
Dynamic Inventory (DI):
Total inventory (TI):
Release rate (RR) is a PHAST output. This means that DI and TI will not be fully calculated until the model has had a run through with SI data. RR is dependent on the hole size for damaged/ruptured scenarios, and is dependent on pump rate times the discharge rate for the leak in full bore rupture (FBR) scenario.
Discharge Rate
The pump discharge rate should be set between 120-150 % of the nominal pump flow, to account for the sudden pressure loss downstream and the subsequent reaction of a centrifugal pump upstream of the rupture. The lower value can be used if there is a single hose and the loading line is short and across level ground. The latter value is used, if there are several loading arms, the loading line is long and the tanks are elevated. In this base case, there is one hose and relatively short loading lines, and only a slight elevation in the process system. The most realistic and reasonable assumption is therefore estimated to be 120 %.
Assumptions for PHAST Modeling
- Parameters not mentioned are set at default value by the software, as used by DNV.
- Release type: constant rate.
- Release direction: horizontal.
- Dispersions parameter: spill will take place on water as surface.
- Pool vaporization: bund surface is water.
- Release height: 1 m above ground.
- Calculation parameters: flash fire vulnerability is set to 1, all other set to 0 (i. e. jet/pool/fire/explosion).
- Dispersion height measured as 0,5 m form the ground (see section PHAST results).
Raster Image – STS Bunker Configuration
The bunker arrangement and size that will be used for the “raster image” in PHAST will be based on the image provided on Ship to Ship Bunkering Operations of the Liquefied Natural Gasthis figure. Passing vessels and other vulnerable object will not be included in the image as these are site-specific details. The scope of this report has been to evaluate a generic LNG bunkering arrangement, and not to look at site-specific issues. Additionally, the main objective is to evaluate the risks for passengers on board during bunkering. This means that the relevant consequence contours for this report, relate to how much of the LNG fuelled vessel (receiving unit) is within the various risk criteria’s (i. e. 10-6 per bunkering operation), and not surrounding elements.
Assumptions for PHASTRisk Modeling
- Wind rose is set to have equal distribution of winds in all directions.
- The software differentiates between day and night time operations, but for this study we will not differentiate between the two.
- The dispersions are measured at 0,5 m height from the ground.
- Exported (output) data considers: flammable dispersion, for LFL faction, at 0,5 m effect height and at maximum concentration.
- Modeling: To calculate the required outcome correctly, the flash fire vulnerability should be set to 1, and all other vulnerabilities to flammable effects should be set to 0 (jet/pool fire/ explosions etc.) The event tree is modified in such a way that delayed ignitions will only result in flash fires and not explosions.
- Ignition made is set to default.
- Ignition probability is set to 100%. This means that there will always be fire when there is a leak (highly conservative).
PHAST Working Procedure
A Build the system tree according to the scenarios defined in the excel sheets:
- Folder for each process section and the event group scenarios.
- Bottom events added as “vessel or pipe source”.
B Add the data for each source:
- Material inputs: substance type (methane), temp value, pressure value and a temporary input for inventory (the correct values will be provided after the first simulation).
- Scenario inputs: leak type, outdoor (in or out), phase is automatically generates based on temp an pressure, hole diameters (S, M, L).
- Location inputs: set elevation height.
C Run the model.
D Access the results and gather release rates for all hole sizes, the LNG and vapor return line (total of six release rates):
- Maximum release rate for large leaks needs to be modified to what is actually possible based on the inventory and discharge calculations, initial result from PHAST is not correct.
- Based on this information the inventory calculations can be completed.
E Add completed inventory calculations results and correct release rates to the PHAST software.
F Re-run the model to produce correct dispersion values:
- Maximum dispersion values for the main LNG line for 1/2 LFL at 0,5 m registration height can be seen on images below.


PHASTRisk Working Procedure
A The system tree now needs to be converted to PHASTRisk:
- Make sure the data is transferred properly.
- Add the respective frequencies to each scenario (part of the system tree inputs).
B Adding the image of the bunkering layout:
- Set the scales, dimensions and origin (also known as failure points, dots on the raster image). This is where the process section failure case scenarios are rooted.
- Register the coordinates for the different process sections: hose, discharging line, receiving line and tanks.
C Add weather information according to specification. Weather was discussed in article Ship to Ship Bunkering Operations of the Liquefied Natural GasWeather.
D Data/parameter changes:
- Add metrological data (wind rose).
- Set to flash fire.
- Day/night time distribution.
E Run model to obtain contours.
Risk Evaluation
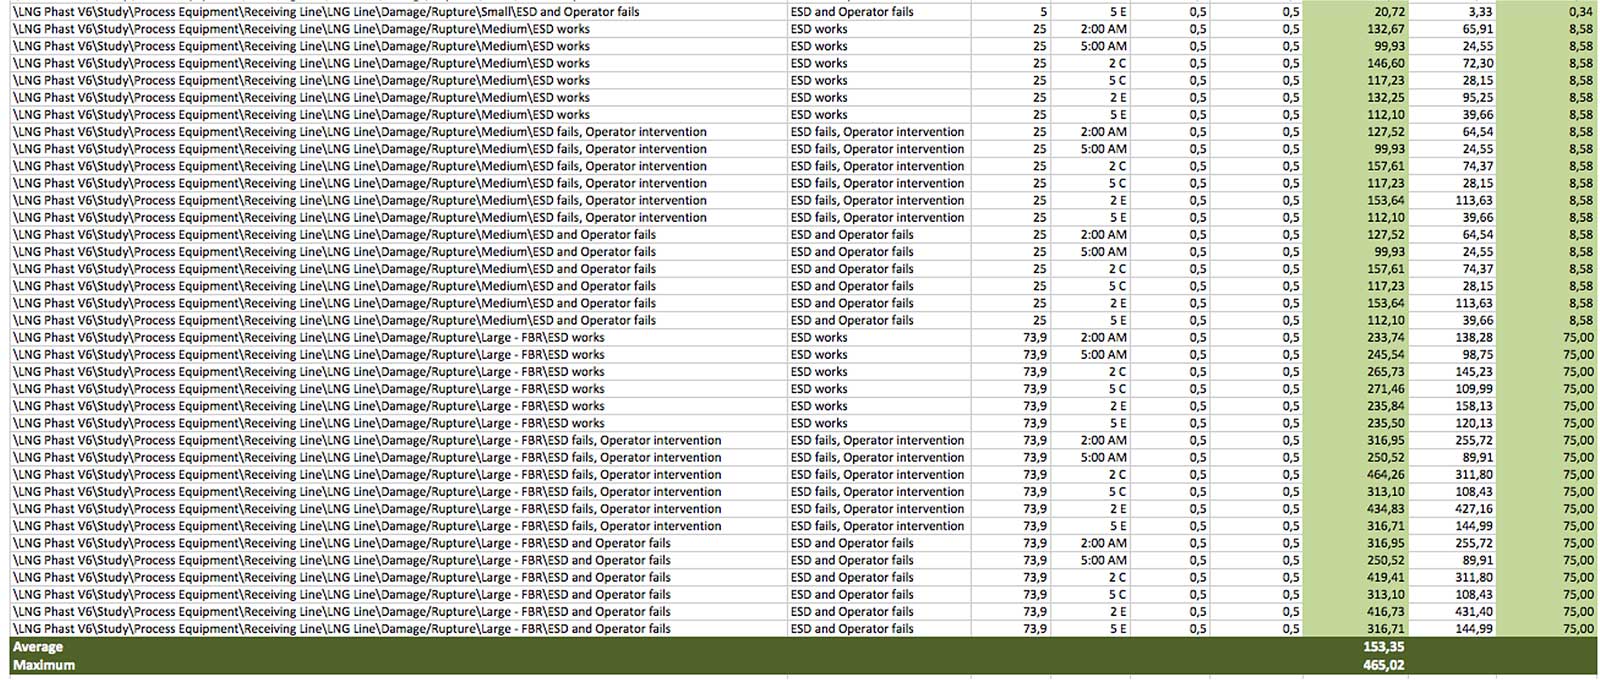
PHAST Results
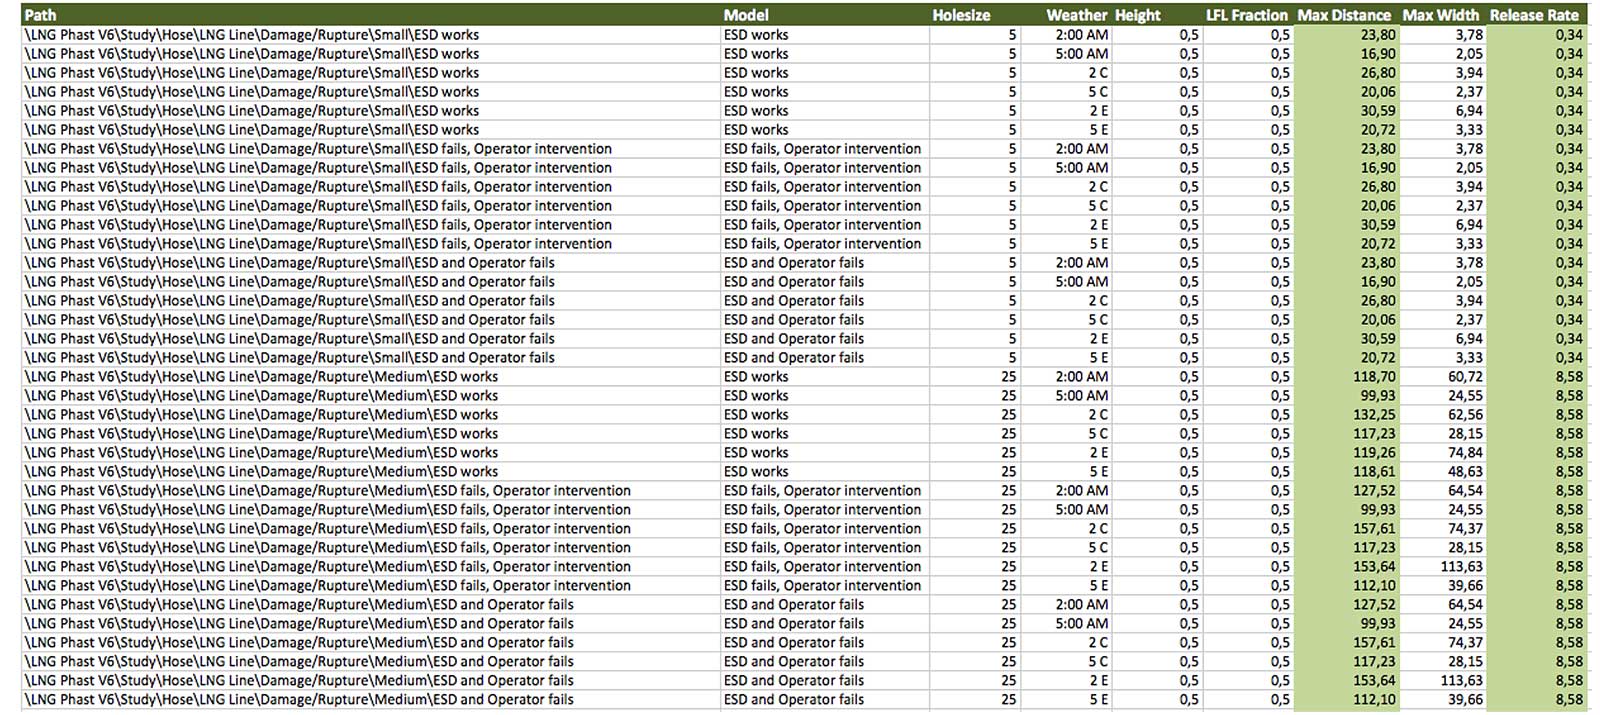
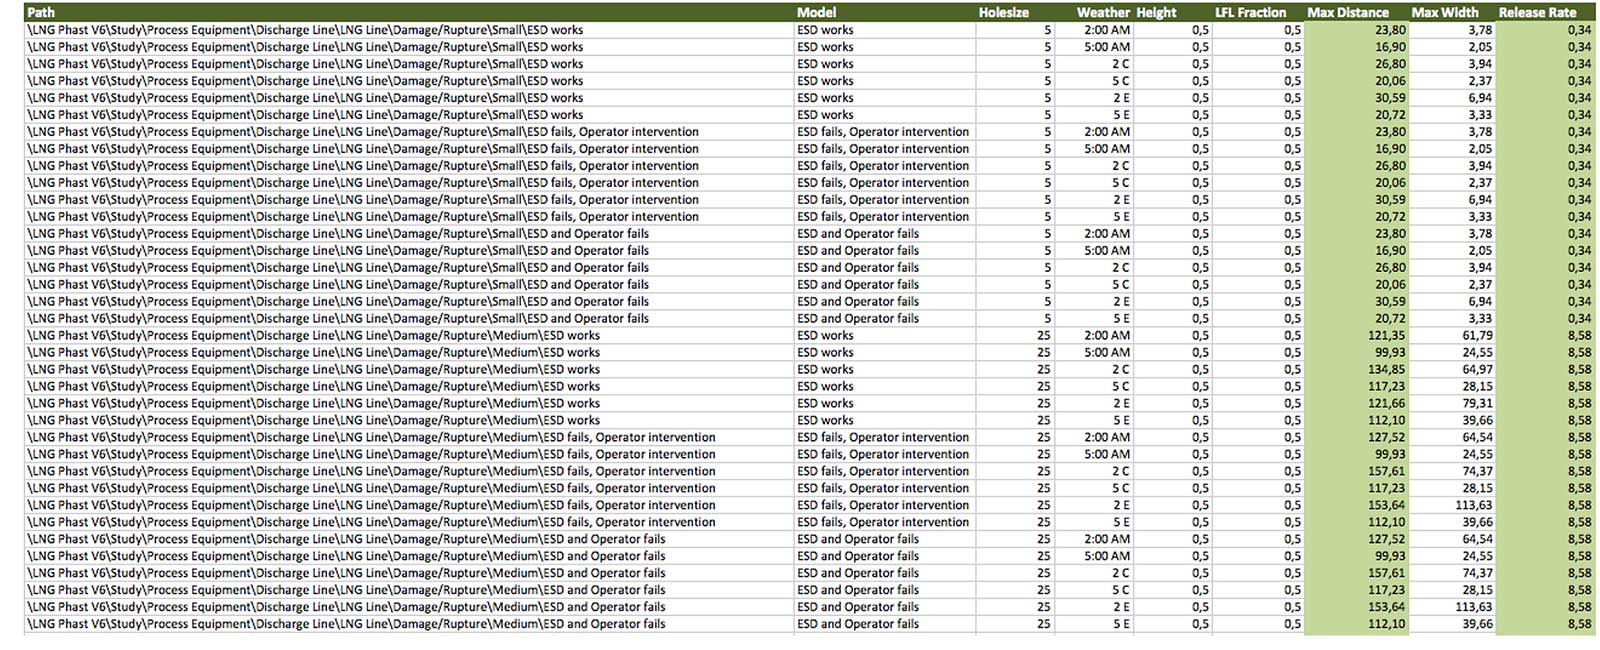
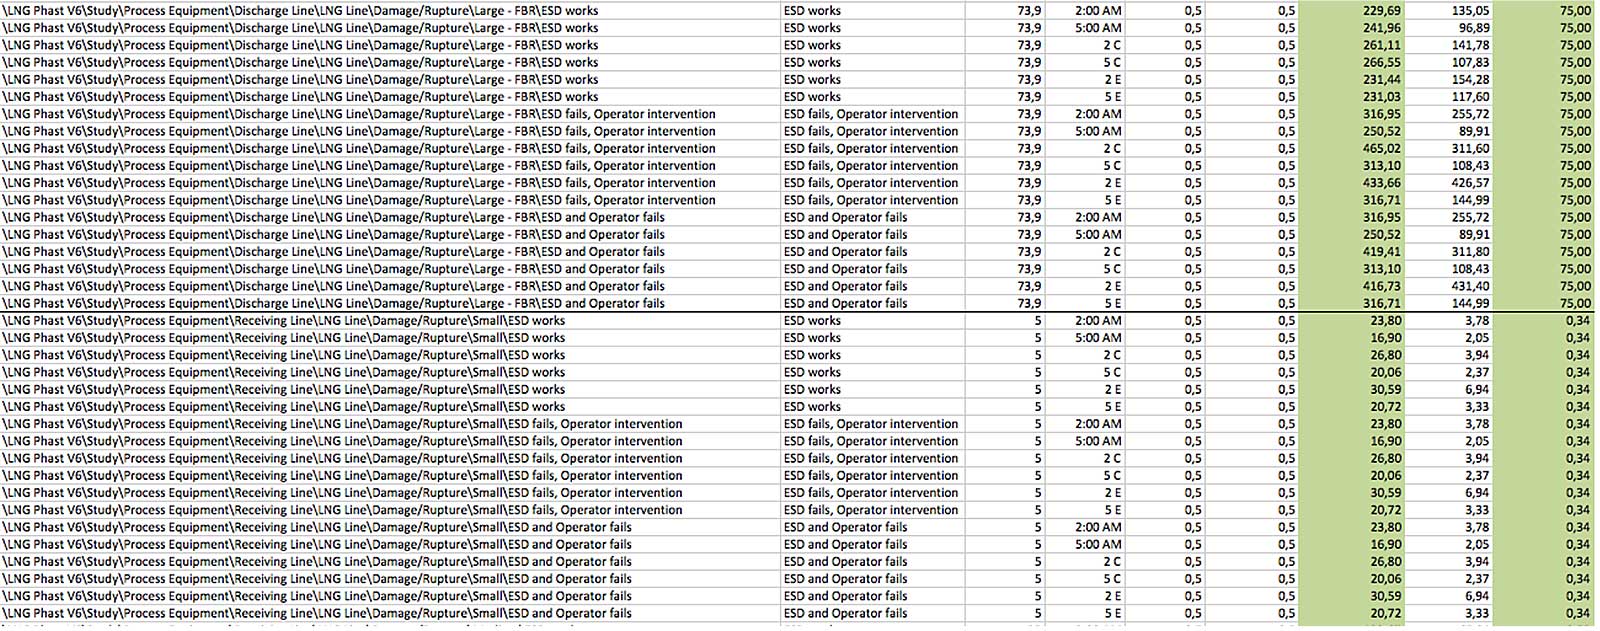
PHAST produce results for maximum dispersion distances for all LOC scenarios. The results below are summarized distances for 1/2 LFL measured at 0,5 m above ground for the main LNG line. Complete list of distances can be seen on image below:
| 1/2 LFL results | Max Distance [m] | Average Distance [m] |
|---|---|---|
| Transfer Hose | 465 | 192 |
| Process Equipment | 465 | 153 |
| Tanks | 1 195 | 664 |
As defined in the assumptions, leak is set to take place 1 m above ground throughout the bunkering system. Dispersion distances are measured at 0,5 m above ground, as this is the height, which gave the largest dispersion lengths, compared to ground level and 1 m measurements. For small leaks, 1m above ground, LNG would evaporate due to heat transfer with air before it reached the ground, but it would not necessarily remain at a height of 1 m either, as an initial drop due to gravitational effects will be experienced before evaporation takes place.
Vapor Return Line
Vapor return line only account for 10 % of the released amounts in the LNG line in the same process section. The vapor return line has not been assessed in terms of its dispersion effects, and it could have been excluded from the study as a whole. It is however included in the overall risk picture, but not in terms of dispersion effects. The longest dispersion distance recorded for vapor return line was 32 m.
LNG Line
Transfer Hose
The main factor affecting dispersion is the size of the hole in the hose. The table below provides minimum and maximum dispersion distances for each size of hole. Further discussions on dispersion distances will be based on dispersion versus hole size distribution.
Factors that will be discussed include:
- Wind speed 2 m/s or 5 m/s.
- Pasquil stability: A (unstable), C (moderate) and E (stable).
- Isolation times: ESD works (fast), ESD fails with operator intervention (moderate) and ESD and operator failure (slow).
A hypothesis for gas dispersion is that for small leaks turbulent winds and high velocities, it can be beneficial to “eliminate” the gas cloud quickly. Then for larger leaks (FBR) the amounts could be so large and the density very high, such that winds only maximizes the dispersion distance. Wind will mix air and gas. Whether the mixture reaches LFL depends on the amount of gas released, the wind and the wind mixing action. Isolation time (i. e. release duration) is a key factor for release distances: the longer the release the larger the volume released.
| Hole size distribution | Min Distance [m] | Max Distance [m] |
|---|---|---|
| Small | 17 | 31 |
| Medium | 100 | 158 |
| Large (FBR) | 229 | 465 |
The small hole size has a low release rate of 0,34 m3/s LNG at point of release. Under these conditions evaporated LNG (i. e. NG) will dilute quickly to below LFL levels due to dispersion effects. Weather type 5A result in the smallest dispersion distance. This is the highest wind speed and turbulence factor combined.
The following distances from low to high are:
- 5C,
- 5E,
- 2A,
- 2C and 2E.
This means that high wind speed and unstable conditions is the most effective in diluting the LNG concentrations for small sizes and that wind speed is the most important factor to stability. In terms of the failure modes, which provide different isolation times, this is irrelevant to the dispersion distance for small hole size.
Medium hole size has a release rate of 8,58 m3/s. The dispersion results for this hole size has less tendencies than for small. When wind speed is at 5 m/s, 5A is still the weather factor with the smallest distances, but in this case it is followed by 5E first and then 5C. This means that for these release amounts, unstable conditions are not having the same dilution effect.
The reason that the same dilution effects are not experienced, is possibly because the concentrations are too high to be diluted effectively, and that instability makes the dispersed area larger. For a wind speed of 2m/s, there are even less clear trends to what generates the long dispersion distances. The isolation time seem to have some influence on the results. “ESD works” provide better results than the two other failure modes, but there is not much difference between “operator intervention” and “complete failure” modes. In terms of wind stability, it is mixed, but stability factor A is overall providing short distances than C.
Large hole size has a considerably large release rate of 75 m3/s. This makes the results even more scattered depending on the various factors affecting dispersion. Isolation time is increasingly relevant and fast isolation response time produce the lower half of the dispersion results. When it comes to weather parameters there is no clear trends. The smallest distance is now 2A with “ESD works” failure mode.
The largest distance is 2C with ESD failure and operator intervention. Operator intervention does not give the longest isolation time. At first glance it is counter intuitive how this can be the highest when ESD and operator failure is much longer. To understand this result, the width of the spread also has to be considered. For moderate isolation time the distance is longer but narrower, for slow isolation time it is wider. Width is less of an issue in terms of dispersion and for defining zones, as the distances measured are considered as a radius and not as a distance in a specific direction. Large hole size gives the same results for both rupture and disconnection.
Process Equipment
Process equipment has the same hole sizes and release rates. Although there are more modeled scenarios for process equipment; discharging and receiving sides are equal and they both reflect the modeled scenarios for transfer hose rupture. This means that all hole size distributions are the same and is why the maximum release is the same in both cases as indicated in the first table in this section. The only reason why transfer hose has a higher average is because it involves more large leak scenarios, as it considers disconnection failures too.
The dispersion results coincide with parts of the hypothesis. Isolation time is relevant but only for larger hole sizes. Weather induced turbulence was important in dispersion of smaller leaks, but provided varying results for larger leaks.
Tanks
Tanks are not considered for isolation times but discussed in terms of weather parameters.
Sequence of dispersion lengths (low to high):
- 5A,
- 2A,
- 5C,
- 2C,
- 5E and 2E.
The dispersion distances are systematic with changes in weather. The released volume is the same in all scenarios, making weather the sensitivity to consider. Unstable weather and high wind speeds provide the shortest dispersion length of 266 m. This means that turbulent weathers is more beneficial in a large release scenario, as it dilutes LNG with air quicker to a concentrations below 2,5 % methane (1/2 LFL).
Security Zones
As discussed in section Ship to Ship Bunkering Operations of the Liquefied Natural GasNautical Activity, security zone can be established based on the dispersion results. When assessing the system for dispersion results vapor line is excluded as it produces only a small fraction of the main LNG line dispersion ranges. Additionally, tank rupture is considered very unlikely and safety zones have not been based on tank rupture up to now. Process equipment and transfer hose have equal maximum dispersion results.
Their averages differentiate, as transfer hose failures include additional cases of large leak failure scenarios through its disconnection failures. The average is most telling for the typical situations rather than considering the maximum, as it represents an extreme case with dispersion lengths more than twice the average. All scenarios have low likelihood of taking place and especially the large releases, which contribute to the longest dispersion distances.
In the port of Rotterdam STS, safety distances for passing ships (security zones) were calculated based on LFL dispersion distances (not 1/2 LFL). The STS case studied in this report had two bunker hoses and the leak scenario considered was simultaneous disconnection of both hoses.
The study concluded with assuming 235 m safety distance. The STS base case for this study has only one transfer hose, with this in mind the average dispersion distance results for transfers hose leakage would be a good security zone estimate. A definite security zone will not be expressed in this section as it would in either case require more location specific information, but hopefully this gives an understanding of the method and process.
LFL Results
ISO Guidelines for LNG bunkering requires that 1/2 LFL is used for risk assessment. Still, LFL results are enclosed to demonstrate the difference between considering LFL, which is the actual risk level, compared to 1/2 LFL, which is conservative.
| LFL results | Max distance [m] | Average Distance [m] |
|---|---|---|
| Transfer Hose | 360 | 148 |
| Process Equipment | 360 | 79 |
| Tanks | 630 | 406 |
The results for LFL are considerably reduced and illustrate the conservative nature of considering 1/2 LFL to LFL. The below table show the percentage reduction
| 1/2 LFL vs. LFL results | Max distance [m] | Average Distance [m] |
|---|---|---|
| Transfer Hose | -23 % | -23 % |
| Process Equipment | -23 % | -48 % |
| Tanks | -47 % | -39 % |
PHASTRisk Results
PHASTRisk produce contour results through aggregation of risk (i.e. the flammable effects) on grid cells. The software produces 1/2 LFL distances (and LFL), exclusively based on leak taking place.
PHAST produced long dispersion distances. These results modeled with worst case scenarios would be considered in a deterministic approach for safety zones. In a probabilistic approach they are only considered for security zone purposes. Dispersion distances could provide severe consequences, but combined with the frequency, the risk is significantly reduced. PHASTRisk provides a complete risk picture overview by being able to combine frequency with consequences.
The data has been added and risk levels have been set to provide contours. Contours will be set from 10-5 to 10-11 , depending on relevance and contours provided. Risk contour results will be considered for nautical activity levels, LFL level, and process section.
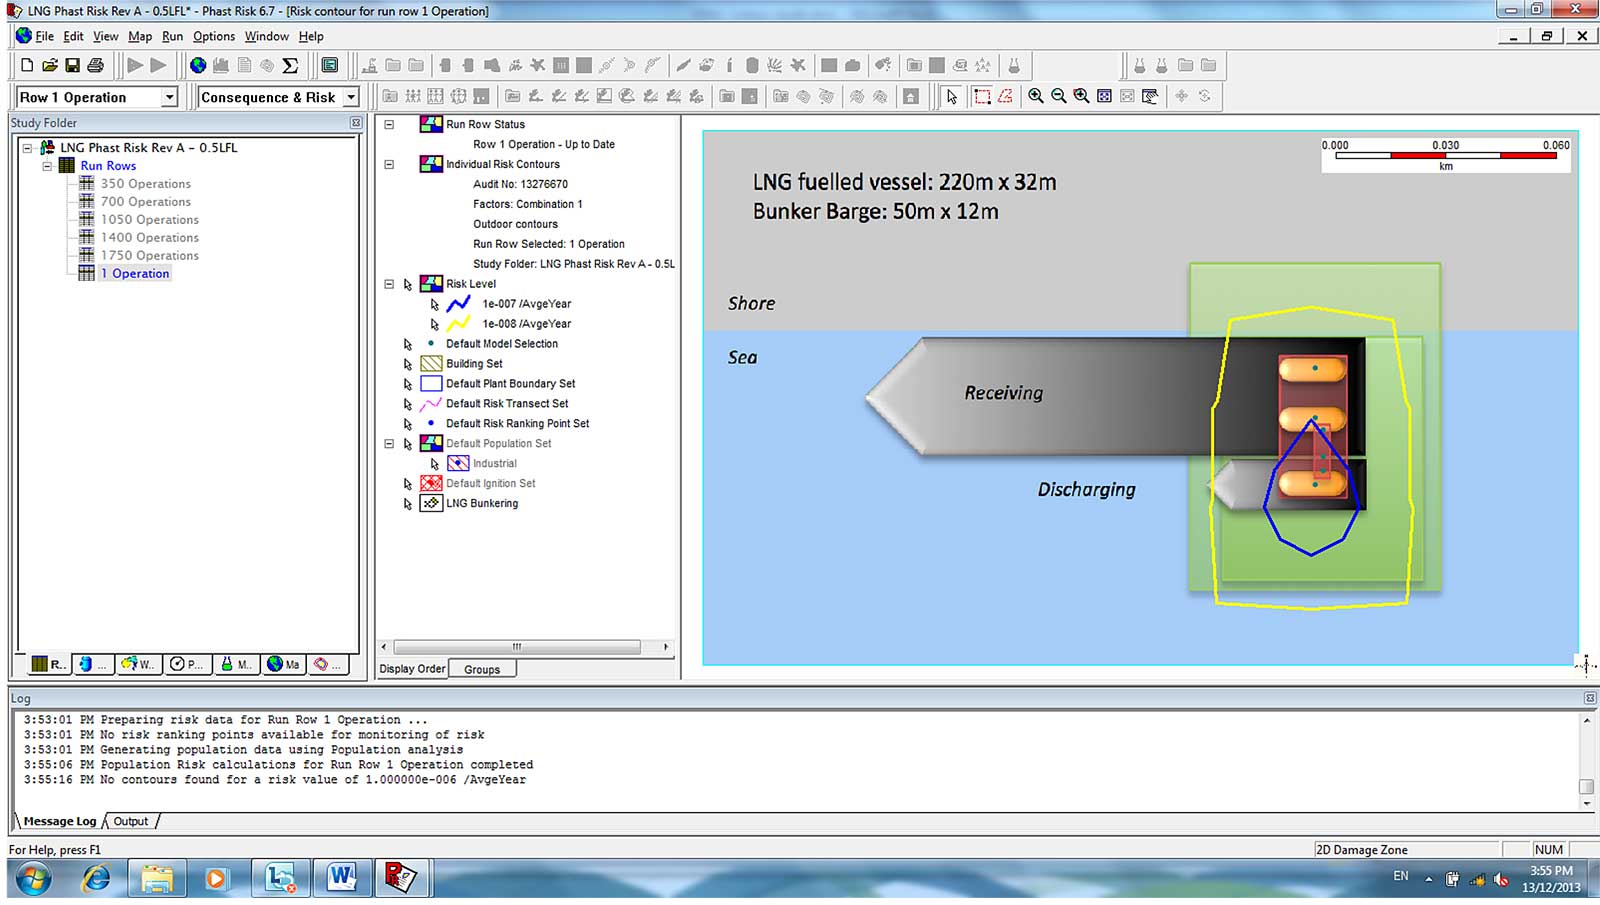
Total Contour Results for 1/2 LFL
The figure below includes the total results for 1/2 LFL, produced by all the input parameters discussed in this study.
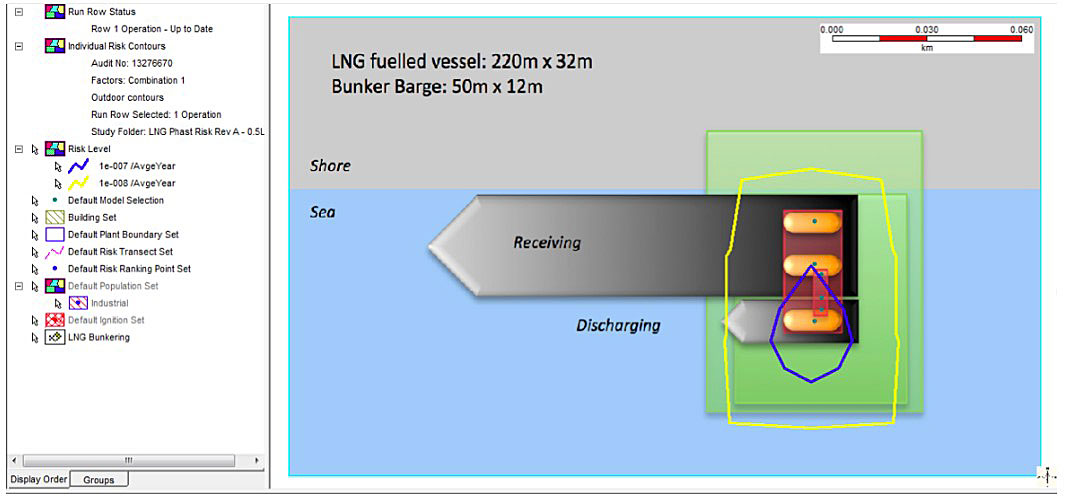
The immediate point of interest is that contour 10-8 (yellow line) obtains a similar shape to the safety zone boundaries used today of “25 m distances from process equipment”. However, as is evident, there is no 10-6 contour to be discussed. The 10-7 contour (blue line) is exclusively within the bunkering process section on the receiving unit (ferry). The bunker barge will only have first party personnel involvement (operators). The water area within the contour should under no circumstances be occupied while bunkering is taking place, as advised and regulated by guidelines and standards for bunkering.
Increased Nautical Activity Contour Results
The traffic level is said to have great influence on risk levels. For process equipment, calculated in LEAK, varying specific types of initial failures is not possible as LEAK produces total failure frequency for a process component. In the frequency analysis, nautical activity is described as the SIMOPS Offshore failure frequency, and it is used for hose failure frequency and tanks. The initial SIMOPS Offshore frequency considered was 2,30E-08. This is the frequency provided by ACDS data and therefore the only frequency used today if site-specific information is not considered in detail. For tanks, the frequency accounted for was even lower considering the likelihood that a collision would lead to additional failures.
The SIMOPS Offshore failure frequency for the transfer hose can be altered to be more significant by multiplying the frequency by a factor of 100 (100 times as many collisions will occur per operation than what is currently assumed). The resulting frequency was 2,30E-06. Introducing this as part of the hose failure frequency produced the following contour results.
Overall the differences between the two levels of nautical activity produced small differences to the contours and either way the levels are well within the limits of 10-6 per bunkering operation.
LFL Contour Results
Although 1/2 LFL is considered the correct level for evaluating degree of dispersion, LFL was also tested for low nautical activity. Figure 10 shows the results obtained.
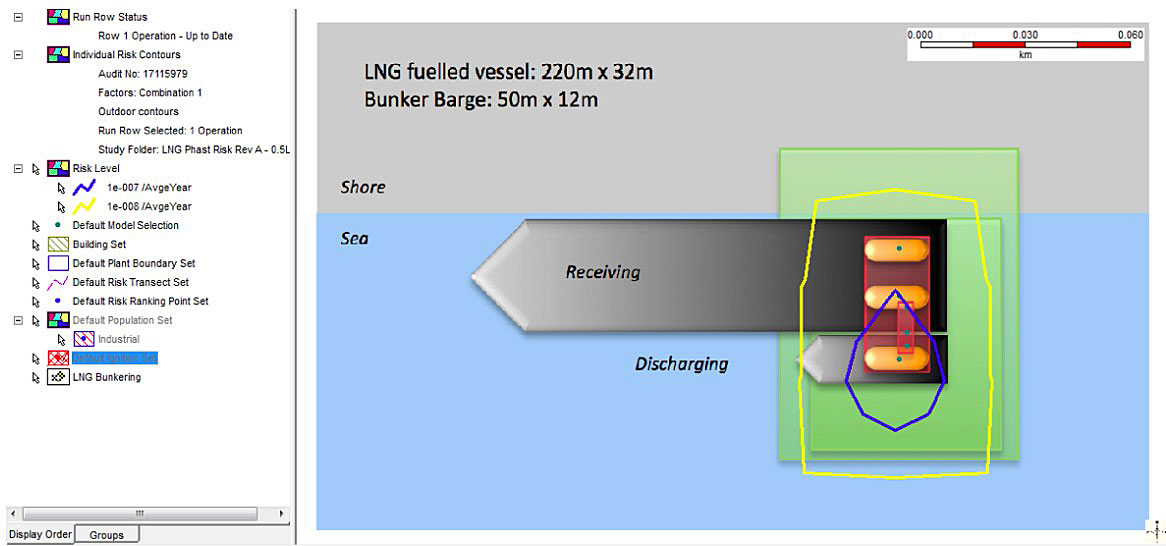
As expected, the contour ranges are slightly reduced, and the 10-8 contour is now well within the 25 m zone of the critical process equipment (i. e. where the transfer hose and most of the process piping is situated).
Process Section Contour Results
The following images provide contour results for leak from one process section at the time. They are all based on the parameters defined (i. e. regular nautical activity and 1/2 LFL).
Transfer Hose
The industry has often expressed the hose as the most hazardous process section of the LNG process system. This belief seems to agree with the results (see figure 11).

Luckily the industry has made attempts towards hose improvements, and from recent tests it is proved that the critical process equipment related to the bunkering process section on either side, will experiences problems well before any hose damage or rupture.

It should be kept in mind that the hose is the only equipment analyzed with different tools and calculations than the rest of the process equipment. It could hence be argued that the analysis has been overly conservative. As this is the process section of the analysis, with the greatest amounts of assumptions required, it proves that the study has not undermined the effects of the hose (which was the aim, to be realistic but conservative).
Process Equipment
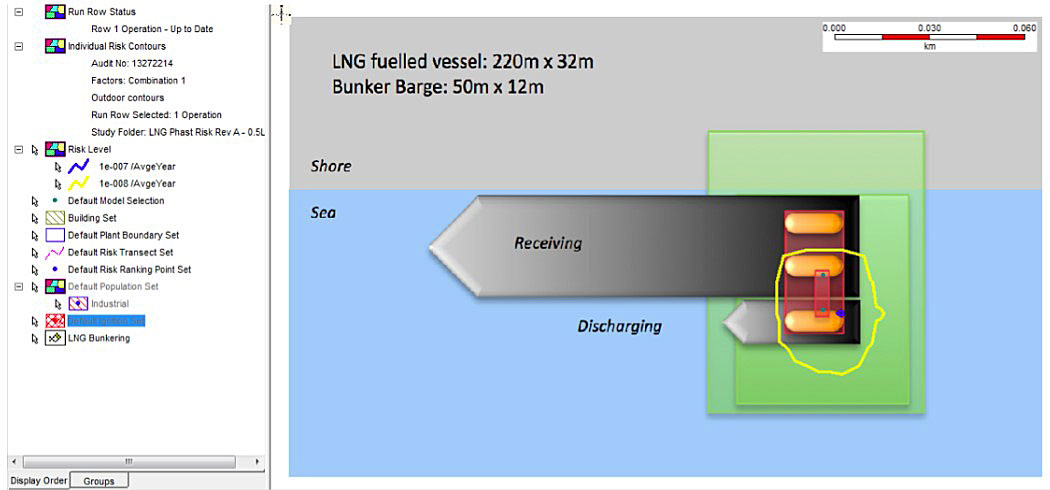
Tanks
For the tanks, the risk level had to be set to 10-11 as no other risk level would give contour results.
According to QRA methods, low frequencies (<10-8) could have been excluded from consequence modeling. If they had been excluded, tanks would not have provided any contour results.
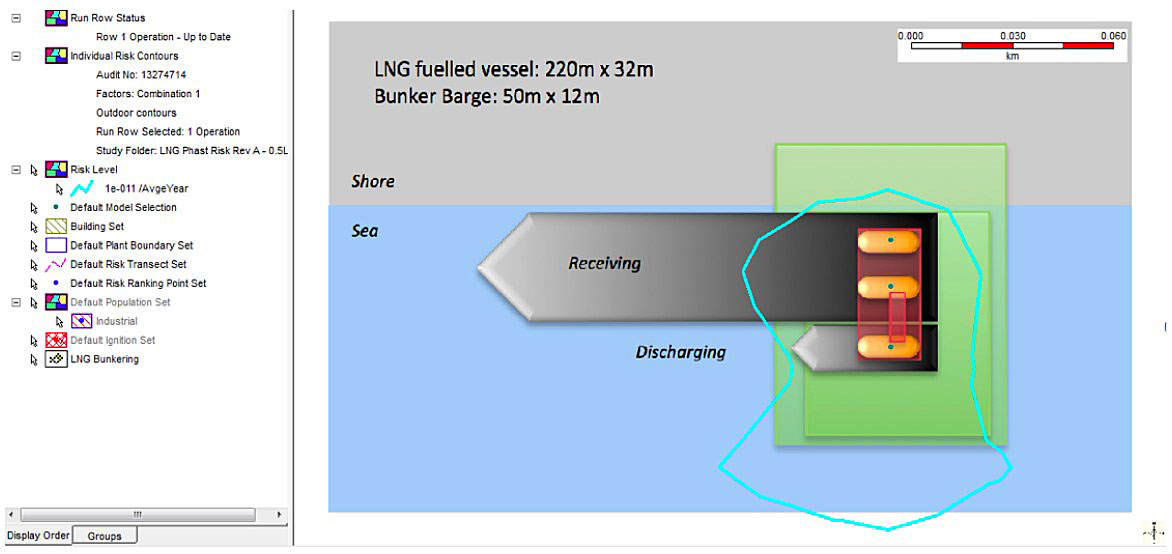
Technology Advancements
System specifics in this study have been conservative and especially when considering that technical advancements will take place in the future. Frequencies used today are based on historical data, which of course also reflects failures in earlier versions of the equipment.
Several studies characterize the hose or loading arm as the critical process section in bunkering processes. Naturally, as it is the interface between the two units and it is very exposed compared to the rest of the process equipment. The perceived fears for the bunker hose has caused the industry to focus their efforts on making the most endurable hoses with specific qualities such as strength and flexibility, and the ability to withstand cryogenic temperatures. The structure, material and design chosen are today so advanced that the industry considers the hoses extremely reliable.
One of the main strengths of the hose is ERC (breakaway coupling). ERC is so effective, and the hose structure is so much stronger, to the extent that any tension will result in ERC activation rather than rupture. ERC would have to fail, which is actually yet to be seen. A triggered ERC in any event is a “safe” reaction.
To demonstrate the high level of security of a cryogenic transfer hose, Gasnor reports on site experiences using cryogenic transfer hoses has been included.
Gasnor Experiences
Hose failure in flexible loading and unloading hoses
In the period from May 2003 to December 2010, approximately 42 000 loading, unloading and bunkering operations have been carried out without detection or indication of any hose failures. Hose rupture is often the dimensioning case when accounting for risk assessments related to the location of LNG terminals and in relation to licenses to carry out loading and unloading operations with LNG.
On the basis of this Gasnor AS has completed a review of these types of operations. Some of the results are presented here:
- No hose failure recorded.
- No drip leaks detected.
- Minor gas leaks/“sweating” from snake recorded. (Total five cases, mainly between onshore facilities and vessels).
- Leaks from the couplings are registered:
- Production Error: spray leak from the hole in the coupling.
- Drip leakage due to contraction when cooling takes place. By retighten the connection the leak stopped.
- Leakage in the breakaway coupling (twice).
Operation and maintenance programmes includes daily inspections of the hose and
transmission preparations (purging and inerting). In the study period, Gasnor has replaced approximately 20 hoses due to sweating. Additionally some hoses have been replaced due to visual wear and tear, without any indication of leak.
The report concluded with:
“Review shows there is not registered any hose failure due to normal operation. Nor revealed situations where a hose rupture have been imminent. Inspection, maintenance and choice of high quality hoses will continue to be important to prevent hose failure in the future”.
Conclusion
The environmental and economical advantages of using LNG as a marine fuel are already recognized. The industry has responded and are now preparing for fuel conversion, with the ferry market as the biggest consumer. High risks are assumed when it comes to vulnerable objects (third parties in the vicinity of the operation) during bunkering. Ferries have thus far been instructed not to allow passenger presence during bunkering. The functionality and strengths of LNG are quickly reduced and this restriction in particular is proving problematic for ferry companies, which have passengers onboard at all times.
In response to the perceived risks associated with LNG bunkering operations, this study has focused on outlining the risks, and quantifying them to provide a detailed risk picture. The purpose of this study was to create probabilistic safety distances for LNG bunkering. The justification in doing this was to evaluate the level of safety for passengers onboard LNG fueled vessels during bunkering. The evaluation has been based on achieving the accepted ISO standard requirement of a probability of flammable gas outside the safety zone being less than 10-6 per bunkering operation as a criterion.
Based on the results provided by PHASTRisk in article Risk Evaluation, it clearly demonstrates that passenger safety can be maintained during bunkering operations. The results of this study conclude that there is no unreasonable risk associated with allowing passenger presence during bunkering. Passenger safety issues should as such not limit the application of LNG as fuel for ferries. The areas onboard withed vessels are at the most inside a 10-8 risk level. This is the lowest level of risk considered by any industry. The only expense and concern of the industry at this moment should consequently be on economically establishing sustainable infrastructure for small-scale bunkering.
The assessment made here is generic, and even though it could be adjusted for individual bunkering cases, it is not expected that significant variations in risk contours will be experienced from typical system variations to this base case. The variations in results have more scope for site-specific issues like weather and traffic density in the port area. Weather cannot be controlled, but should be evaluated before choosing a specific bunkering location. Based on the PHAST dispersion results, unstable weather and high winds resulted in shorter distances for all hole sizes. The remaining element left to consider is nautical activity and the SIMOPS failures high activity introduce. There are several zones that can be established to control the risk of this category, which means that if exclusion zones or security zones are properly defined then safety zones for passengers will not be an issue.
Treatment of Residual Risk
For studies of risk there is large number of sensitivities that can be analyzed, and further studies should be made. This study has focused on the sensitivities, which are believed to have a significant effect with respect to calculations of the safety zone. This includes weather sensitivities, hole size distributions and some variations in the SIMOPS Offshore frequency to account for varying nautical activity.
As discussed, risks associated with LNG bunkering can be divided into risks inherent to the process equipment (system specific) and risks specific to the bunkering location (site-specific). The site-specific sensitivities can have an affect on the risk level prior, such as port traffic and some have an effect when an accident involving a leak has taken place, like weather. Weather sensitivities are considered in the study and to some extent port traffic, but any safety zone implemented needs to be carefully evaluated against specific site details.
LNG bunkering systems can have some variations in design, but the basic principles will for practical purposes be the same. Several of the process parameters and functions are set by the physics of LNG and the guidelines and standards. The system specific solutions that were not analyzed for sensitivity in this study were set to be the most conservative to avoid underestimating the risk. In this study a single loading hose was assumed, instead of two or three that could be used in shore to ship applications. The reason for this is that one loading hose is more relevant for the costal applications that have been the main focus of this study.
Regulatory requirements limit extensive system variations, and set a number of standard that must be met even before the security zone comes into question. If regulatory requirements are followed this would mean that risk contours would not be larger than the presented even if there were changes to the system or operating parameters. Following, is a discussion on sensitivities that could be considered in future risk assessments for LNG bunkering.
Operating Conditions
In this study, constant cargo temperature was assumed for both the main LNG line and the vapor return line. This means that the discharging unit (the bunker barge) has to deliver the same cargo temperatures for every operation. Realistically, this is not the case, and cargo temperatures are expected to vary between -140 to -162 °C on arrival to the bunkering site.
Temperature variations could also lead to variations in density and pressure, which will have an effect on the transfer operation and how the varying density will influence the development of the gas leak. Sensitivity analysis on varying temperatures could have been performed, but was considered outside the scope of this study. This study has chosen the temperature assumption that is the most conservative, which are the coldest temperatures and consequently the highest density. This makes the evaporation slowest in the situation of an LNG release.
Constant pressure throughout the piping system is not a reality during bunkering operations, as the flowing system will see the pressure drop through its equipment and pipe configurations. Pressure changes and pressure variations could have been calculated using Bernoulli. This would have required more specific data on the system such as; process equipment, specific lengths of pipes, piping configurations, etc., with the associated friction factors within the pipes and hoses. Including this in the calculations would have made the model more advanced. The highest allowed pressure was assumed in all parts of the system for the purpose of determining probabilistic safety zones. It would have given lower calculated consequences of a leak than the outcome of this study and the recommendations made.
Another DNV report did study the effect of pressure variations, and this was the concluding remark:
“When staying in a reasonable range of pressure around the base case, the operating pressure has little influence on the final result. The variation of operating pressure has a greater impact at low pressure (i. e. 1-2 bar (g)), than for higher pressures. Lower pressures usually result in shorter safety distances, except for large leak in windy weather conditions.”
Hose Dimensions
Transfer hoses are produced with varying dimensions, and both length and diameter could have been analyzed as sensitivity. Another DNV study looked at the effect of varying dimensions. Overall it proved that hose length had little effect, while hose diameter was significant in the case of full bore rupture. The variation in hose length mainly impacts the static inventory that would be released as a consequence of a hose rupture.
Emergency Release Couplers
In this report we assumed that the hoses would be equipped with breakaway couplings (or ERC). This is recommended and seems already to have become a standard practice in the industry. Breakaway couplings will ensure that the weak point of the hose is at the coupling. The cryogenic transfer hose has a breaking strength, which will exceed the strength of the breakaway coupling leading to activation of the emergency function of the breakaway coupling. When activated, the breakaway coupling will close in less than a second by the mechanical closing system (valve).
The quick closure significantly reduces any released volumes. Based on bunkering guidelines and recommendation from authorities, which stress the use of ERC, it has been assumed that this is present and the use is best practice, but nevertheless sensitivities could also have been performed.
Isolation Times
Isolation times depend on the system used and there can be many variations. The values chosen in the study are conservative as there are many studies operating with shorter isolation times. One such example is the Skangas report on LNG bunkering in Risavika, Stavanger, which shows that ESD reaction time is considered to be 90 seconds; 60 seconds for detection and reaction, and 30 seconds to close it down.
In this study it was decided to use the longer (more conservative) closing times published in technical guidelines. The effects of reduced isolation times would probably be similar to the results this study prescribes, and for smaller leaks isolation time is practically irrelevant, but for larger leaks it is a great contributing factor. The Skangas report concluded that the contour lines and safety zones are increasingly reduced with shorter closing times.
Release Parameters
Rate, direction and height of release are all factors that can and should be analyzed in further studies. Height and direction can both give substantial differences in the formation of a liquid pool. Especially for small and medium hole sizes this could affect the difference of instant evaporation versus pool formation and prolonged evaporation. The release rate depends on pump flow rates, and will naturally have a large effect on the released amount. Nevertheless, since the value chosen in this study was based on maximum rates advised by authorities, the resulting safety zone should not have become any larger.
Probability of Fire
The probability of flammable effect was set to 100 % probability, to correlate with current QRA practice in the industry. This assumption does not represent real life events, as ignition sources are limited. The effect of varying flammable probabilities could have been an interesting assessment, as the likelihood is considered very low.
Amazing Information.