This article contains information about Ship to Ship (STS) bunkering operations: bunkering system, configurations, hazards of LNG leakage/release etc.
Overall this article provides a detailed overview of the study and present assumptions made with respect to the chosen base case.
STS Bunkering System
“The definition of LNG bunkering is the small-scale transfer of LNG to vessels requiring LNG as a fuel for use within gas or dual fuelled engines. LNG bunkering takes place within ports or other sheltered locations.”
Bunkering should not be considered in the same context as large scale, commercial transfer of cargo between ocean-going LNG carriers, with volume transfers typically above 100 000 m3.
To correctly assess and quantify the risks of LNG bunkering it is essential to define the system that will be analyzed. This article of the report will present bunkering configurations, describe the selected bunkering configuration for this study, and establish the base case including relevant process parameters and assumptions made.
LNG Bunkering Configurations
The industry differentiates between three types of bunkering configurations:
- Truck-to-Ship (TTS): micro bunkering, discharging unit is a LNG road tanker with size of approximately 50-100 m3.
- Ship-to-Ship transfer (STS): discharging unit is a bunker vessel or barge with size 200-10 000 m3.
- Terminal (Pipeline)-to-Ship (PTS): satellite terminal bunkering serves as the discharging unit. Supply sizes are approximately 100-10 000 m3.
PTS and TTS are the most established bunkering configurations as of today, and they are both classified as onshore supply. STS will also take place while the receiving unit is at dock or in a port environment, but both units involved in the transfer are seaborne and the transfer is therefore classified as offshore. Use of STS makes the bunkering location more flexible than PTS, and it can supply higher volumes than TTS. Developments within this configuration are the most feasible and are therefore essential in making LNG competitive against other marine fuels, especially for larger ships. Each configuration has specific risks depending on arrangement and equipment used. The most important equipment difference is whether the system uses hose or loading arm for the transfer.
STS Bunkering – Base Case
STS with flexible cryogenic transfer hose is the chosen configuration for this study. The base case defined will make generic assumptions for STS bunkering and will not represent a specific real life case. A simplified bunkering arrangement has been made and can be seen in figure: Illustration of two-phase release of LNG (source DNV RP). The illustration, although simplified, is proportionally drawn to scale and will be used for modelling purposes later in the study.
The LNG fuelled vessel is a passenger ferry and will be referred to, as the receiving unit while the bunker vessel/barge is the discharging unit. The receiving vessel is moored to shore and the discharging is moored to the receiving. The red boxes mark the process sections; the small box is the bunker process section including transfer hose, while the larger process sections include all process equipment for bunkering. The green boxes mark the 25 m safety zone around the two process sections respectively. The 25 m safety zone is the current industry standard.
Personnel and Individual Involvement
The discharging side will only include operators involved in the Basic Information about Liquefied Natural Gas Bunkering OperationsLNG transfer specifically. For the receiving side the ferry will include; operators, ferry crew and ferry passengers. The passengers are the main concern, making the receiving ship the focus in this risk assessment.
System Regulations
The bunker barge is designed and built according to the IGC Code and the LNG fuelled vessel is designed and built according to the MSC285(86) (see project report chapter 5: Regulations). Process equipment used in the transfer process is according to national regulations, regulations equivalent to EN 1474 or NFPA 59 (see project report section 4.4: Equipment).
System Limitations
Considerable efforts have been made to make reasonable assumptions. In an attempt to not underestimate any of the risks related to LNG bunkering, the “conservative best-estimate” has been chosen for areas where case choices were required. Efforts have been made to make the assessment as detailed and realistic as possible. Nonetheless, the report does not cover a specific real life bunkering case. Consequently, parameters have been chosen broadly from representative data aiming at describing a typical existing STS bunkering arrangement. Additionally, as technology advances, future real life bunkering configurations might have different characteristics. Any results presented should therefore be interpreted with care.
System Boundaries
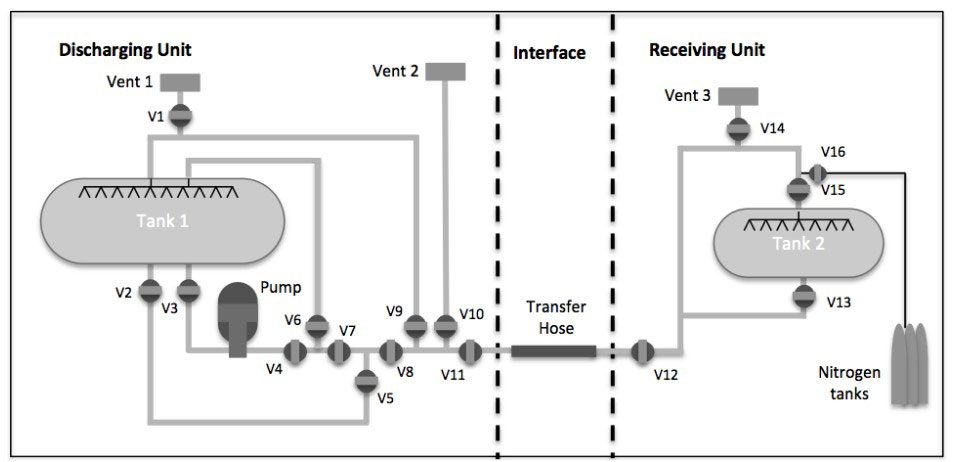
In this study the entire transfer system will be included in the calculation of the safety distances. This includes process equipment (pump, piping, valves, flanges etc.) and tanks for both units and the hose. The system is additionally equipped with a vapor return line, which runs in parallel with the main LNG line. The failure scenarios accounted for are linked to LNG leakage. All potential release scenarios within these system boundaries will be accounted for.
Figure 1, represent a simplified LNG bunkering system. Although simplified, it marks the transfer system boundaries for this study, defines the process sections that will be considered, and provides a bunker layout overview. This model is, conversely to the previous, not drawn to scale. A real life transfer system is much more complex as it includes additional process equipment that need to be considered for frequency calculations. In section 4.2.3: Risk Assessment in the Liquefied Natural Gas Bunkering Operations, Hazard IdentificationProcess Equipment Failure Frequency, a full process equipment count is presented for the two units.

STS Bunkering Procedure
A full step-by-step description of the bunkering procedure is provided in the project report article Risk Assessment in the Liquefied Natural Gas Bunkering Operations, Hazard IdentificationLNG Bunkering Procedure.
The main steps in a STS bunkering procedure are:
- Arrival and mooring.
- Cool down system.
- Grounding and connection of bunker hose.
- Inerting and purging of filling lines.
- Transfer (top and bottom).
- Stripping, inerting and purging of filling lines.
- Disconnection of bunker hose.
- Unmooring and departure.
The main step of interest is step 5, the transfer sequence. This is the part of the procedure where all considered process sections are filled with LNG/NG.
Operational Data
Bunkering for vessels of this size is estimated to take about one hour, however, bunkering time often increase as top filling has to be used more than what accounted for, so a conservative assumptions is to consider two hours for bunkering time per operation. All frequencies and scenarios will be considered on a per operation basis.
Transfer Properties
The actual bunkering arrangement is not available, and the exact process characteristics vary from case to case. The transfer properties selected are therefore conservative, based on regulatory requirements or values obtained from a representative case.
Read also: Ship/Shore Interface in Gas trading
Flow velocity will be set to 10 m/s as this is the maximum velocity for the hoses typically used by the industry.36 Bunker barges/vessels of this size have filling capacities from 180-3 000 m3/hour. The flow rates will vary from one bunkering activity to another, depending on filling method (top or bottom) and bunker parameters (i. e. temperature and pressure of the liquid). The flow rate will not be evaluated for sensitivities and will therefore be set as a constant parameter, assumed to be 500 m3/h for this study.
LNG properties:
- Methane is the defined material/working fluid, with 5-15 % (LEL-UEL) and ignition temperature of 500 °C.
LNG line – process equipment and hose:
- Operating pressure is set to 10 bar (g). This is the maximum operating pressure for LNG process equipment according to European design standard EN1472-2.
- Operating temperature is set to -162 °C to keep the inventory in liquefied state. The bunker vessel (discharging unit) is assumed to be able to maintain this constant temperature during the transportation to site.
- Density depends on temperature and pressure. Based on the defined process parameters the density is 425 kg/m3
Vapor return line (NG) – process equipment and hose:
- Pressure is set to 2 bar (g) as it will be reduced compared to LNG line.
- Temperature is set to -100 °C. The liquid has been warmed and is now in a vapor state.
- Density 4,3 kg/m3.
Tanks:
- The pressure in the tanks is set to 2 bar (g). The Swedish Marine Technology Forum, together with DNV and others, have stated that the barge can operate with a pressure of up to 3 bar (g) at -163 °C. The typical operating pressure will however be closer to 2 bar (g).
Equipment Dimensions
Hose:
- One LNG and one NG (vapor return line) for the system.
- LNG: 6 inch (152 mm) diameter.
- NG (vapour return): 2 inch (51 mm) diameter.
- 10 m length (correct length depends on the vessels freeboard changes and movements).
Piping
- 6-inch diameter (same as hose).
- 10 m length on discharging and 20m length on receiving. The lengths are based on assumptions with regards to vessels size (discharging is smaller than receiving).
Tanks
- Discharging Unit: 200 m3 tanks.
- Receiving Unit: 200 m3 x 2 tanks.
- Tanks are considered in the analysis, as they are considered to be located externally (i. e. not in a confined space). LNG fuel and storage tanks are often external due to LNG tank size (in case of an LNG fuel conversion). The tanks will often have to be placed in an unenclosed area on the vessel, meaning that the conservative approach is to include tanks.
LNG
This section will describe the characteristics and hazards associated with an LNG leakage/release, and define the relevant groups of outflow scenarios.
LNG Characteristics
LNG is NG cooled to about -162 °C (-260 °F) at atmospheric pressure. It is a condensed mixture of methane (CH4), approximately 85-96 mol %, and a small percentage of heavier hydrocarbons. LNG is clear, colorless, odorless, non-corrosive and non-toxic. In liquid form it is approximately 45 % the density of water, and as vapor it is approximately 50 % density of air and will rise under normal atmospheric conditions. LNG is called a cryogenic liquid-defined as substances that liquefies at a temperature below -73 °C (-100 °F) at atmospheric pressure. The process of liquefaction reduces the volume to 1/600 th of its original volume, providing efficient storage and transport.
LNG Safety Issues
In its liquid form, LNG cannot explode and it is not flammable. Hazards arise when LNG returns to its gaseous state through an uncontrolled release. The release can for instance be caused by a tank rupture due to external impact, leaks from flanges in the pipework, or a pipe break etc.
The hazards can be divided into two categories:
- Cryogenic effects from LNG.
Exposure to a liquid at -163 °C will cause humans to freeze and steel equipment to become brittle. Brittle steel can break and cause additional secondary failures. - Fire and explosion.
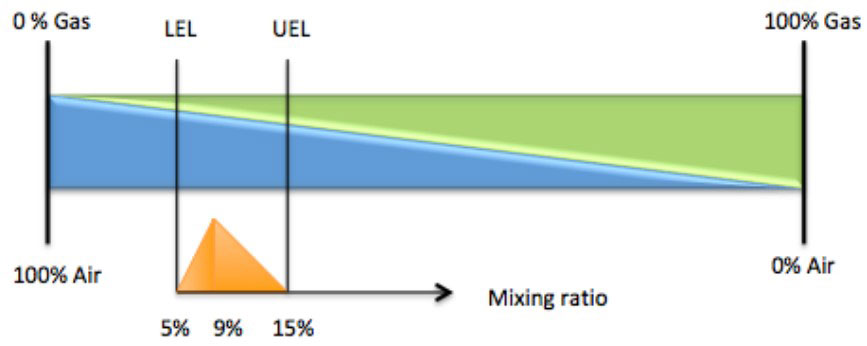
Once the LNG has leaked, it will form a pool of liquid LNG. This pool will start to evaporate and form a cloud of gas, primarily consisting of methane. This gas will start mixing with air (with a 20,9 % oxygen ratio), and once it reaches a mixture between 5-15 % gas, it is ignitable. Outside the critical level, an explosion or fire will not occur. Below the lower explosion level (LEL) there is insufficient amount of methane. Similarly, above the upper explosion level (UEL) there is insufficient amount of oxygen present. The critical flammability and explosion level is a 9 % ratio of NG to air, see figure 2.
Without an ignition source, the gas will continue to evaporate, disperse at ground level while cold, start to warm and rise to the sky (as methane is lighter than air), and thereafter drift away until the entire liquid pool is gone. LNG evaporates quickly, and disperses, leaving no residue. There is no environmental clean-up needed for LNG spills on water or land. If an ignition source is present, the gas cloud could ignite, but only at the edges where the methane concentration is within the aforementioned range. There will be an initial flash, not very violent, as the gas cloud ignites, and it will continue to burn back to the pool as a flash fire. The gas will continue to burn as it evaporates until the pool of LNG is gone.
For an explosion to take place the gas typically needs to be in a confined space (such as inside a building or vessel), reach the right mixture with oxygen and have the presence of an ignition source. In this event, there could be an explosion causing overpressure, drag loads and potential damage to life and property.
Outflow Scenarios
Tanks spills – non-pressurized LNG
LNG stored in tanks will be at atmospheric pressure (i. e. non-pressurized). Pressure relief valves are implemented and fixed to only allow small levels of net positive pressure and any boil-off gas is collected. A release of non-pressurized LNG will not include pressure flashing from liquid to gas. The phase change occurs due to rapid heat transfer and boil-off. Depending on the leak size and height of release, LNG can either evaporate immediately or form pools, as described earlier.
Pipe-/process equipment spills – pressurized LNG
LNG process equipment for transfers will have some degree of pressure to allow for the transfer to take place. Pressure in the process equipment can range from 0-10 bar (g), as described in section Transfer Properties. Typical operating pressure is 3 bar (g). Outflow scenarios in these process sections will depend on the pressure in addition to the static head. Due to the pressure, liquid sprays and jet scan can take place and be significant to the outflow form. Formation of liquid pools will be equivalent to non-pressurized releases.
Dispersion
Due to condensation of atmospheric moisture and the initial very cold temperature of the liquid, the methane and other present heavy hydrocarbons will form a dense gas when evaporating from the pool. These clouds will disperse with the wind and mix with the air. Gravitational effects caused by density relations, atmospheric turbulence (Pasquil stability) and heat transfer with the air creates the blend. Further details on this will be presented below in the Weather Conditions.
Flash Fire
Flash fire is when the methane cloud has caught fire in its cloud edges, where the concentration level of methane is within the LFL-UFL range due to dispersion effects. If a cloud catches fire it will “flash back” across all its flammable mass (i. e. mass within the flammable range), followed by burning at the UFL boundary until everything is dispersed and consumed. Pool fires are ignited and formed when the flash fire reaches the evaporating pool of LNG. The fire will burn above the pool in the evaporated gas in combustible gas-air concentrations.
Other types of fires and explosions can also take place after an LNG leak, such as fireball, BLEVE, vapor cloud explosion and jet fire. These types of fires and explosions are however less likely to take place. Explosions will not take place as the entire transfer system for STS is exterior (i. e. not in a confined space), and if fires takes place they will in most cases lead to flash fires. A flash fire is considered to have the maximal hazardous effects on a LOC scenario. Therefore the additional reactions will not be discussed in this section nor included in the analysis.
Flammability/Explosion Limits
LEL and LFL (same goes for UEL and UFL) is the same unit and are used interchangeably in the industry. This is because the explosion (LEL) and flammability (LFL) ranges are the same.
Ignition leading to flash fire (or explosions) can occur as far out (/away from the leak) as the Lower Flammable Limit (LFL). The distance effect shall be calculated using ½ LFL (2,5 % methane). The fraction of the LFL is included to account for uncertainties in the dispersion and effects of imperfect mixing. This factor will be included in the analysis and modelling.
Nautical Activity
The risks associated with LNG bunkering can be split into risks inherent to the process equipment and risks specific to the bunkering location. Scenarios related to location can in many cases be dominant for the overall risk picture. Consequently it is important to highlight location requirements identified by authorities.
A part of the location details is already defined within the definition of bunkering; it should be located within ports or sheltered locations. Additionally we know that both units will be seaborne for STS. With basis in this, the following assumptions are made with respect to the bunkering location and nautical activity:
- The area is overall qualified as very low in terms of nautical activity/traffic density.
- Other ships/vessels in immediate presence are berthed while the bunkering takes place.
- Any moving vessel will have a velocity of 5 knots or less (typical port speed limit). This will ensure limited impact energy in case of collision.
Location characteristics are often split into onshore or offshore simultaneous operations (SIMOPS). Further details on this will be explained in article Risk Assessment in the Liquefied Natural Gas Bunkering Operations, Hazard IdentificationFrequency Analysis.
Security Zone
In the DNV RP a security zone is recommended. A security zone is the safety distance to other passing vessels. This zone is established as a first layer of defense in reducing the frequency of LNG LOC scenarios. The purpose of the security zone is to reduce the likelihood of LNG release caused by external impacts. Reduction is achieved by monitoring activities and traffic within the zone.
The security zone is not an exclusion zone, which is another well-used zone in the industry that marks specific boundaries for all other forms of operation. Distance between the bunkering area to other passing vessels or other simultaneous operations is currently not universally defined, as this distance will depend on bunkering configuration, system and process parameters. The term “immediate presence” is therefore currently used in the RP. The security zone will be discussed based on the findings from the risk assessment. Maximum discharge lengths in the event of a LOC are the key parameters for establishing the zones. This will be discussed further in section Risk Assessment in the Liquefied Natural Gas Bunkering Operations, Hazard IdentificationSecurity zones.
Weather Conditions
The consequence of the releases of flammable and toxic materials into the atmosphere depends strongly upon the rate at which the released material is diluted and dispersed to safe concentrations. The rate of dispersion depends upon the meteorological conditions prevailing at the time of release. Meteorological parameters such as the wind speed, direction and turbulence factors are of importance.
Weather conditions will be considered in the sensitivity analysis. Six representative weather scenarios with various conditions have been established. The conditions vary between two types of wind speeds and three types of stability factors. The other factors (temperature, humidity and solar radiation flux) remain constant.
| Weather data | |||||||
|---|---|---|---|---|---|---|---|
| Wind speed | m/s | 2 | 5 | 2 | 5 | 2 | 5 |
| Pasquil stability | A | A | C | C | E | E | |
| Atm. Temp | C | 20 | 20 | 20 | 20 | 20 | 20 |
| Relative Humidity | 0,5 | 0,5 | 0,5 | 0,5 | 0,5 | 0,5 | |
| Solar radiation flux | kW/m2 | 0,5 | 0,5 | 0,5 | 0,5 | 0,5 | 0,5 |
| Surface type | Open water (spill over water)/Default (spill over land) | ||||||
Pasquil Stability
This describes the amount of turbulence in the atmosphere. The stability depends on several conditions such as time of day, solar radiation and wind speed. See Table A, for an example of stability factors.
| Table A. Pasquil Stability Factors | |||||||
|---|---|---|---|---|---|---|---|
| Windspeed | Day: Solar Radiation | Night: Cloud Cover | |||||
| (m/s) | (mph) | Strong | Moderate | Slight | Thin <40 % | Moderate | Overcast >80 % |
| <2 | <5 | A | A-B | B | – | – | D |
| 2-3 | 5-7 | A-B | B | C | E | F | D |
| 3-5 | 7-11 | B | B-C | C | D | E | D |
| 5-6 | 11-13 | C | C-D | D | D | D | D |
| >6 | >13 | C | D | D | D | D | D |
- A: very unstable – sunny, light winds.
- C: neutral – little sun and high wind or overcast/windy night.
- E: moderately stable – less overcast and less windy night.
Wind Rose
The influence of any specific weather category and direction will vary for each and every release. The dispersion and consequences associated with LNG (and other dense gas releases) are relatively sensitive to assumptions affecting the heat transfer to the cloud. Hence, the above values are relatively conservative representative conditions, but will not necessarily correspond to the worst-case dispersion conditions that may occur. Overall, the resulting influence of any changes in the metrological assumptions will have negligible influence on the risk results.
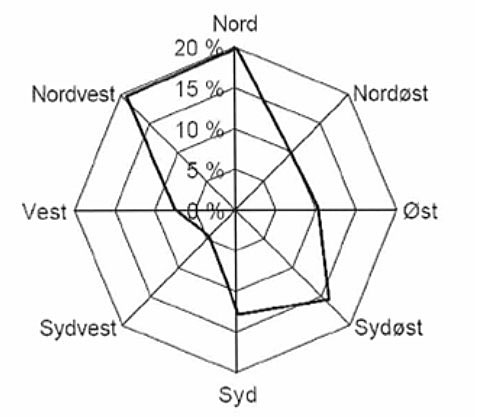
The wind directions in a specific location are included in the analysis through the wind rose inputs in PHASTRisk. Typical wind rose degrees for any location can be found in public domains. For a wind rose example, see figure 3 of LNG plant in Sola, Stavanger.
In this report, location is not defined specifically, thus generic and equal distribution over all angles is assumed.
Implemented Safeguards
There are various repressive systems (safeguards) present within the establishment. These systems can reduce the outflow duration in the case of a failure scenario, limiting the leak/loss of containment. The outflow duration (time it takes from scenario initiation to stop) is known as isolation time. The present section provides an overview over the repressive systems, defines the relevant isolation time (which will be included in the QRA) and their probabilities of failure.
Automatic Isolation
Control and Monitoring Systems
Control and Monitoring Systems need to comply with the IMO document MSC 285(86). All installations need to be equipped with control monitoring and safety systems. The most essential monitoring system is gas detection. The process sections that are critical for supervision are sections where unintended release of gas can occur such as around manifolds, double walled pipes and enclosed areas containing pipe work associated with the bunkering operation.
The control and monitoring system should be directly linked to the Emergency Shutdown System (ESD). The individual shutdown initiators will vary for each installation. Minimum control and monitoring requirements, on both distributing and receiving units, are:
- Position (open/closed) and high-pressure detector in all bunker manifold valves.
- Operation of any manual emergency stop push button.
- “Out of range” sensing on the fixed loading arm.
- Gas detection (above 40 % LEL).
- Fire detection.
- High-pressure and high-level detectors in receiving LNG tank.
- High/low-pressure and high-level detectors in distributing LNG storage tank.
Emergency Shutdown System (ESD)
ESD is the main component in the automatic blocking.
“The primary function of the ESD system is to stop liquid and vapor transfer in the event of an unsafe condition and bring the LNG transfer system to a safe, static condition.”
In the STS bunkering arrangement, only the discharging unit will have an ESD. This is based on the class rules for bunkering arrangement, which states that it is not mandatory for the receiving unit to have an ESD valve (see figure 4). The conservative assumption is therefore that it is not present.
Emergency Release Couplers (ERC)
Emergency Release Couplers (ERC) or breakaway couplers are to be fitted on both units, between the flexible cryogenic transfer hose and the flange connection. The ERC is to incorporate integral automatic valves that will close when separated, either by nature of its design or by remote motorized operation. Its function is to prevent release of liquid or vapor to the surroundings through rapid closure.
Under excessive tension (i. e. in a rupture event) it serves as a weak link providing automated release to avoid the hose from breaking. It allows for quick connection and disconnection. ERC manufacturers report that closure of the outflow area is mechanically driven and takes less than a second to react. This immediate response in the ERC makes it a very effective tool for substantially reducing LOC in the case of a threatening scenario.
Operator Intervention
A trained operator should be available on site to supervise and intervene in any unsafe situations that might arise, throughout the process. Operator intervention will take place if the automatic system fails.
Isolation Times
Isolation times will vary for each scenario and mitigating measure. Keeping the intervention time low is significant in limiting the amount of substance released during LOC. Several bunkering guidelines and past studies provide various reaction times for the system contributing to the overall isolation time.
After considering several options depending on effectiveness, and considering that isolation time is a parameter which will improve as technology advances, the following times in seconds are defined:
- Small leak, ESD works: 120 s.
- Medium and large leak, ESD works: 15 s (quicker detection).
- S, M and L, ESD fails but operator intervenes: 120 s (operators are at all times managing the bunkering process and wearing gas measuring equipment).
- S, M and L, ESD and operator fails: 1 800 s (maximum outflow time).
Probabilities of Failure
The mitigating actions need to be defined for their probabilities of failure. Reference sources distinguish between three types of operated valves. The ESD is considered connected to a computerized system and is therefore classified as automatic with a 0,001 probability of failure per operation. Operator interactions have a 0,1 probability to fail.
In the event of hose disconnection the ERC (break-away) system is involved. Probability of failure data has been difficult to obtain, but is considered highly reliable. Nevertheless, for this study a 0,1 probability of failure is assumed.