Full-scale sea trials of the ship maneuvering (“MF Landegode”) were carried out in Beiarfjorden outside Bodø, Norway from Thursday 29th of August to Saturday 31st of August 2013. The sea trials were part of the MAROFF project for the promotion of innovation and environmental value creation in the maritime industries. The main focus was the investigation of speed and manoeuvring performance, and obtaining well documented full-scale results of the manoeuvres.
By obtaining well documented full-scale trials, the results can be compared with results from manoeuvring simulations and model tests. Processing the full-scale results and making a comparison between the full-scale results and manoeuvring simulations are further treated.
During the three days in Bodø, different manoeuvre tests were carried out. The tests included:
- Zig-zag tests;
- Stopping tests;
- Spiral tests;
- Thruster turning tests with ahead, astern and zero speed;
- Low speed manoeuvre tests;
- Accelerating turn tests, and;
- Turning circle tests followed by pull-out tests.
The different manoeuvres investigated are the zig-zag manoeuvres, stopping tests, turning circle manoeuvres and low speed manoeuvres with main focus on thruster turning tests and accelerating turn tests.
In the following, a presentation of the instrumentation and data acquisition, an analysis of the manoeuvring trials and the results from the different manoeuvres will be addressed.
The data of the full-scale trials and Matlab scripts used to process the results along with plots from the trials are provided on an additional storage device.
Gauges and data acquisition
During the sea trials, MF Landegode was equipped with Kongsperg Seapath 330. This equipment was used to record the data during the sea trials.
Analysis of trials
The data obtained from the full-scale measurements are post-processed and tuned in Matlab to gather necessary and desirable information on the specific manoeuvres. This article will review the data, location, test conditions and influencing parameters during the full-scale trials. Finally, a review of the post-processed specific manoeuvres and the final results are presented.
Data sets
1 Data set 1:
29th of August 2013 from 12:22 to 15:15 GMT. The tests carried out this day were Test: 1001-1016 containing thruster tests at zero speed and ahead speed, as well as three zig-zag tests (1014, 1015 and 1016), where test 1015 was a failed test.
2 Data set 2:
30th of August 2013 from 09:47 to 14:45 GMT. The tests carried out this day were Test: 3001-3029 containing turning circle tests, spiral tests, zig-zag tests, thruster turning tests at zero speed and accelerating turn tests.
3 Data set 3:
31st of August 2013 from 09:47 to 14:00 GMT. The tests carried out this day were Test: 5001-5021 containing acceleration tests, speed trials, stopping test and thruster turning tests with astern, zero and ahead speed.
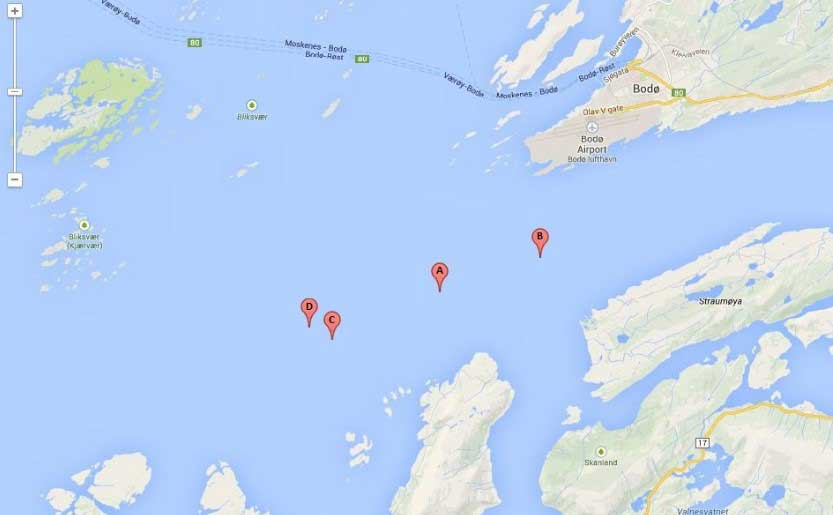
Position
Seapath gives the position of MF Landegode in longitude and latitude, both in [m], [km] and [deg], where [m] is the parameter used. Both [m] and [deg] is given as geographic-coordinates. The heading is recorded in [deg]. A picture depicting the position of different manoeuvres is shown in Picture 1.
Test conditions
Table 1 lists the weather statistics for the three respective days of the sea trials.
| Table 1. Test conditions for the respective days | |||
|---|---|---|---|
| Date | 29/08/2013 | 30/08/2013 | 31/08/2013 |
| Cloud cover | Partly clouded | Clouded-partly clouded | Sunny-partly clouded |
| Temperature [°C] | 11,20 | 11,95 | 17,22 |
| Wind [m/s, direction] | 9,8 from west-southwest | 2,6 from east-southeast | 5,0 from east-southeast |
| Wave height, Hm0 [m] | 0,32338 | 0,4351 | 0,24144 |
| Current speed [m/s] | 0,2521 | 0,0480 | 0,1027 |
Non-specific weather observations, i. e. the cloud cover, temperature and wind direction, as well as speed are gathered from the meteorological institute of Norway. The current velocity is calculated using the model described below and the wave height is gathered from the wave buoy used during the trials.
To calculate the wind generated current velocity, the following procedure has been used.
Note! The calculations in the model is based upon [cm] and not [m].
where:
- τ = the wind stress exerted on the water surface by the wind;
- ρair = the density of air (0,001225 [g/cm3]);
- W = sustained wind speed in cm/s at 10 m elevation above the water surface.
The model predicts wind generated currents in shallow waters. If the shallow water region is approximated to 10 m < depth < 300 m, this model can be applied for the trial area depicted in Picture 1, which have depths of approximately 240-300 m.
Nomenclature for all the formulas you can see here: Nomenclature and Greek Symbols
A relation between the wind shear stress acting on the water surface and the water shear stress acting on the sea bed can be expressed as follows.
- τbed = shear stress exerted on the seabed by the water flow near the seabed;
- k ≈ 0,2 and;
- τsurface = shear stress exerted on the water surface by the wind.
If depth-averaged current velocity is assumed the velocity profile can be expressed as:
where:
- v = horizontal velocity as a function of the vertical coordinate positive in the direction of the wind shear stress;
- u* =
- ln = natural logarithm (log to the base e);
- z = the vertical coordinate with the origin at the seabed;
- k = relative seabed roughness (relative to the sediment grain size, D50), and;
- D50 = median grain size.
If equation (3) is integrated over the water depth, y0, the equation can be written:
where:
- V = depth averaged velocity, and;
- y0 = water depth;
- ρwater = the density of water (1,0[g/cm3]).
By substituting the expression for shear stress exerted on the sea bed in equation (2) into equation (4), the equation can be expressed as:
A median grain size is assumed to be D50 ≈ 1 mm.
Error sources
As Table 1 suggest, the trial conditions were more or less stable. No extreme weather changes was experienced and the different manoeuvring tests had more or less the same point of reference in conjunction to the weather. The different results gathered from the same manoeuvre, e. g. a turning circle, proposes a valid basis for repeatability. There was knowledge of little current in the trial area, as the calculations suggests. The affect of present current is taken into account when analysing the turning circle manoeuvre. The effect was found be present, but of small significance.
Other interfering sources may be:
- The measuring gauge, e. g. the calibrations, frequency of data acquisition;
- The time of command given to execute ship manoeuvres;
- Play (offset) in the rudder or steering mechanism;
- Effective water velocity at the rudder;
- Effect of shallow waters;
- The effect of draft and trim conditions;
- Actual propeller and engine efficiency;
- Initial approach speed.
Turning circle manoeuvre
Turning circles were performed on Friday the 30th of August. Both port and starboard turning circles were 360° circles with a 35° rudder angle. The trials were conducted with maximum continuous revolutions (MCR) at 85 %.
Post-processing
The data recovered from the trial manoeuvre was post-processed in Matlab. The Matlab scripts are provided on an additional storage device. The parameters that have been evaluated are the north and east position [m], the vessel velocity [m/s] and the rudder angle [deg].
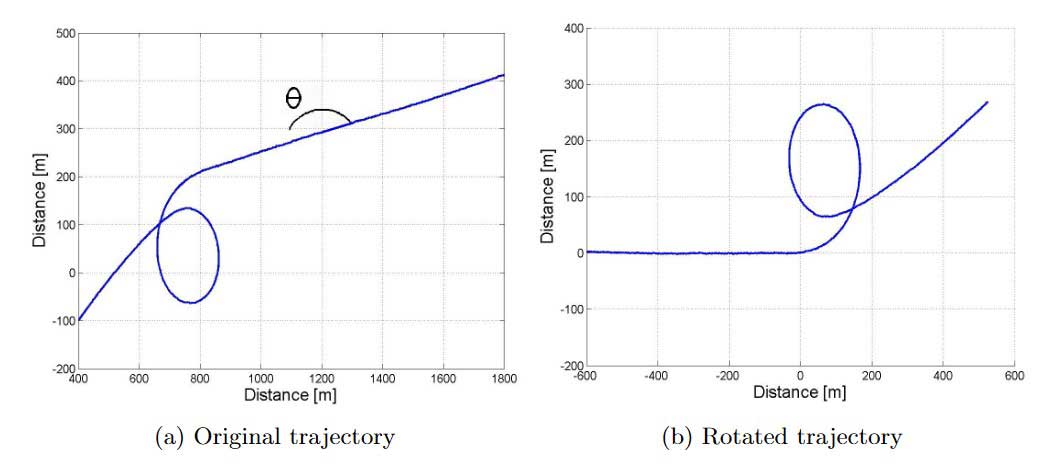
When evaluating the turning circle, the initial plot has been altered to give a more representable plot than originally. First, the approach trajectory was rotated so that the vessel’s approach course was set along the x-axis. The rotation was performed utilizing a transformation matrix which rotates the trajectory by an angle θ, counter-clockwise about the origin, expressed as:
where:
- x and y are the original positions and;
- and are the rotated coordinates.
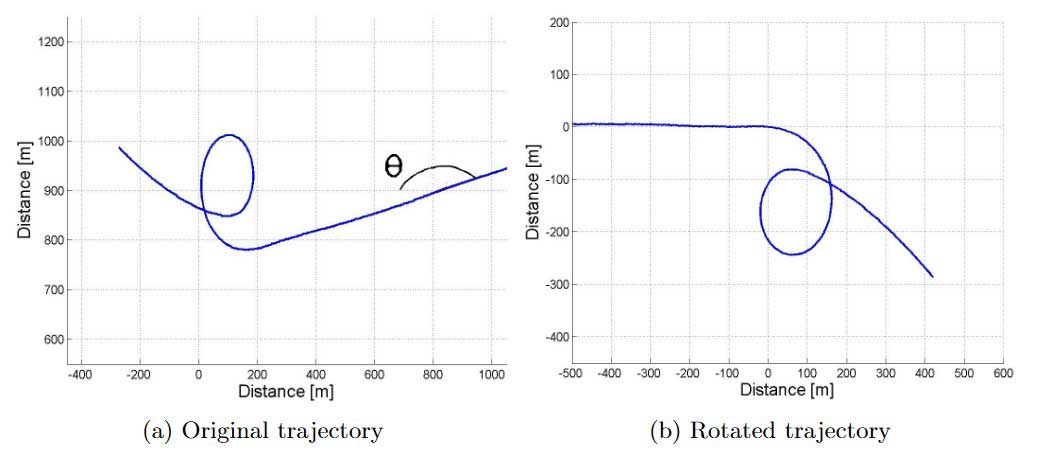
Picture 2 and 3 depicts the original and rotated trajectory for both the port and starboard turning circle.
Environmental conditions have an affect on the manoeuvrability and resistance of the vessel. It is therefore preferable for the vessel to conduct the full-scale trials in calm and stable weather conditions. The turning circle manoeuvres were carried out Friday 30th of August when the wind was at its lowest of the three days and the wave height was at its highest, at 0,4351 m as listed in Table 1. To account for the effect of current, IMO’s prediction guidance has provided an empirical model to correct for these influences. Because the correction model demands a turning test of 720°, (which is not carried out for MF Landegode), some of the early steps in determining the current velocity has been disregarded. The current velocity was alternatively calculated, using equation (5).
The trajectory is corrected with the relation:
where:
- and are measured x- and y-position vectors;
- and are the corrected position vectors;
- and are the current velocity in x and y direction, respectively, and t is the time in seconds.
A corrected trajectory is shown in Picture 4.
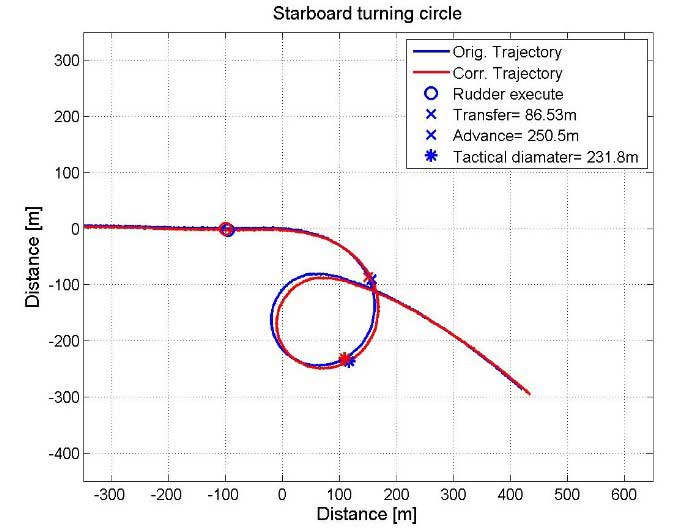
It should be mentioned that the correction of influencing current has been performed before turning the plot as illustrated in Picture 2 and 3. Hence, Picture 4 will present a misleading illustration of the current direction, given the direction of the wind, with regard to the corrected trajectory. Picture 4 is used to give a more visually representable plot. Picture 5 however, illustrates the initial corrected trajectory prior to the transformation.
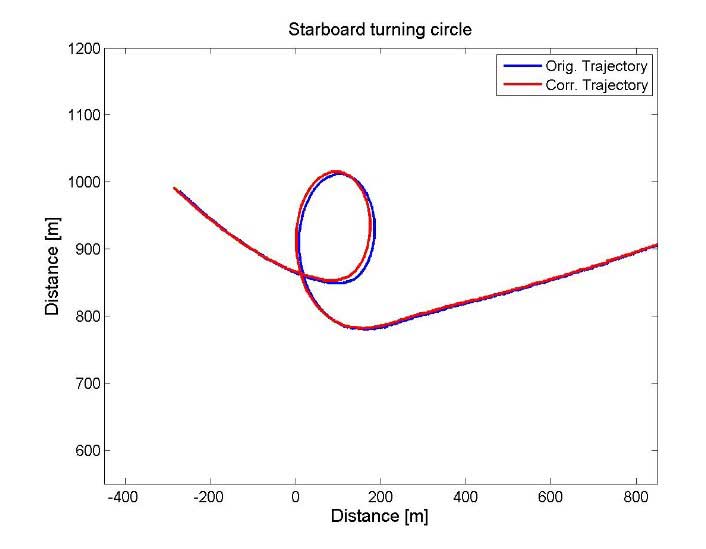
Transfer and advance is measured at the point where the vessel has changed the heading by 90°, after the rudder execute. Tactical diameter is measured at a 180° change of heading. A plot of the turning circle with marked advance, tactical diameter and transfer is presented in Picture 4.
Results
Both the port (run 3006) and the starboard (run 3005) turning circles have been processed, and the results are further presented. The manoeuvres should ideally be identical under similar conditions. As Table 2 and 3 presents, this is not the case. Both the tactical diameter and the advance is larger in the port manoeuvre. Different sources influencing the manoeuvre can be the reason for the deviation. The fact that the two tests were conducted in the same direction, given the effect of wind, current and waves, a boost and a braking force can occur for either of the trials.
I. e. the port manoeuvre can experience a braking force in the diameter and the starboard manoeuvre can experience a boost effect, resulting in a smaller and bigger diameter, respectively. This can be observed from the corrected results of the two tests in Table 2 and 3, respectively. There is about 4 % difference between the two trials which indicates that there is agreement between the two. But the fact that the port manoeuvre, turning into the wind, has a larger turning diameter than the starboard manoeuvre, turning with the wind, indicates that there is an influencing error source as the results are contradictory to what would appear to be the obvious outcome. To give a more qualified judgement of the precision-error of the full-scale trials, more turning circle manoeuvres should be conducted.
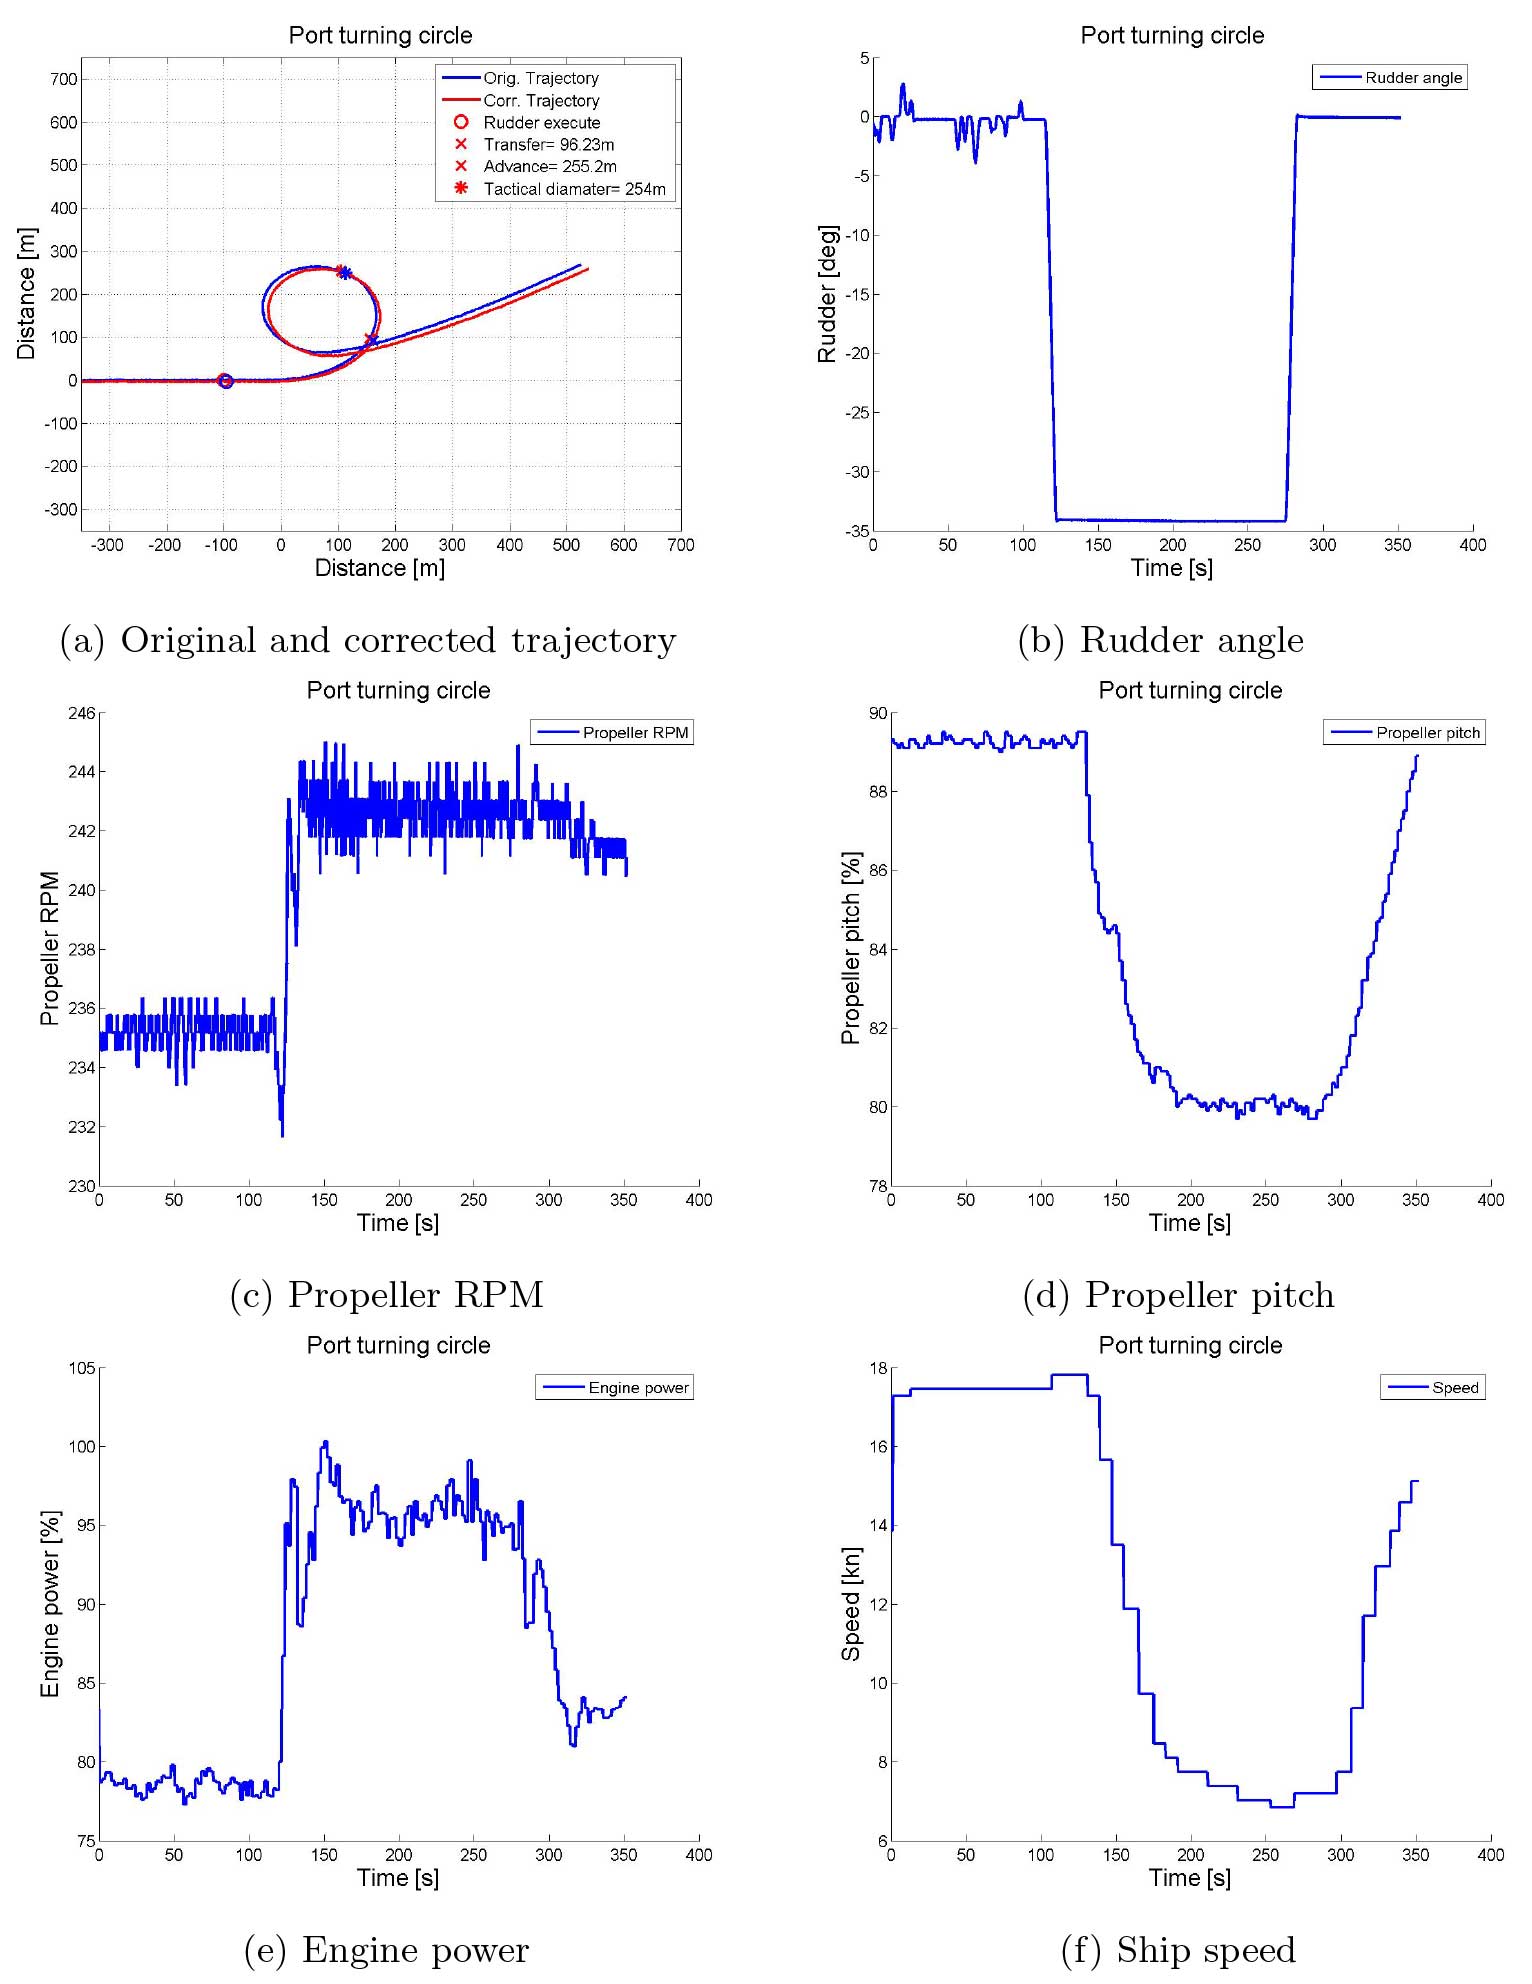
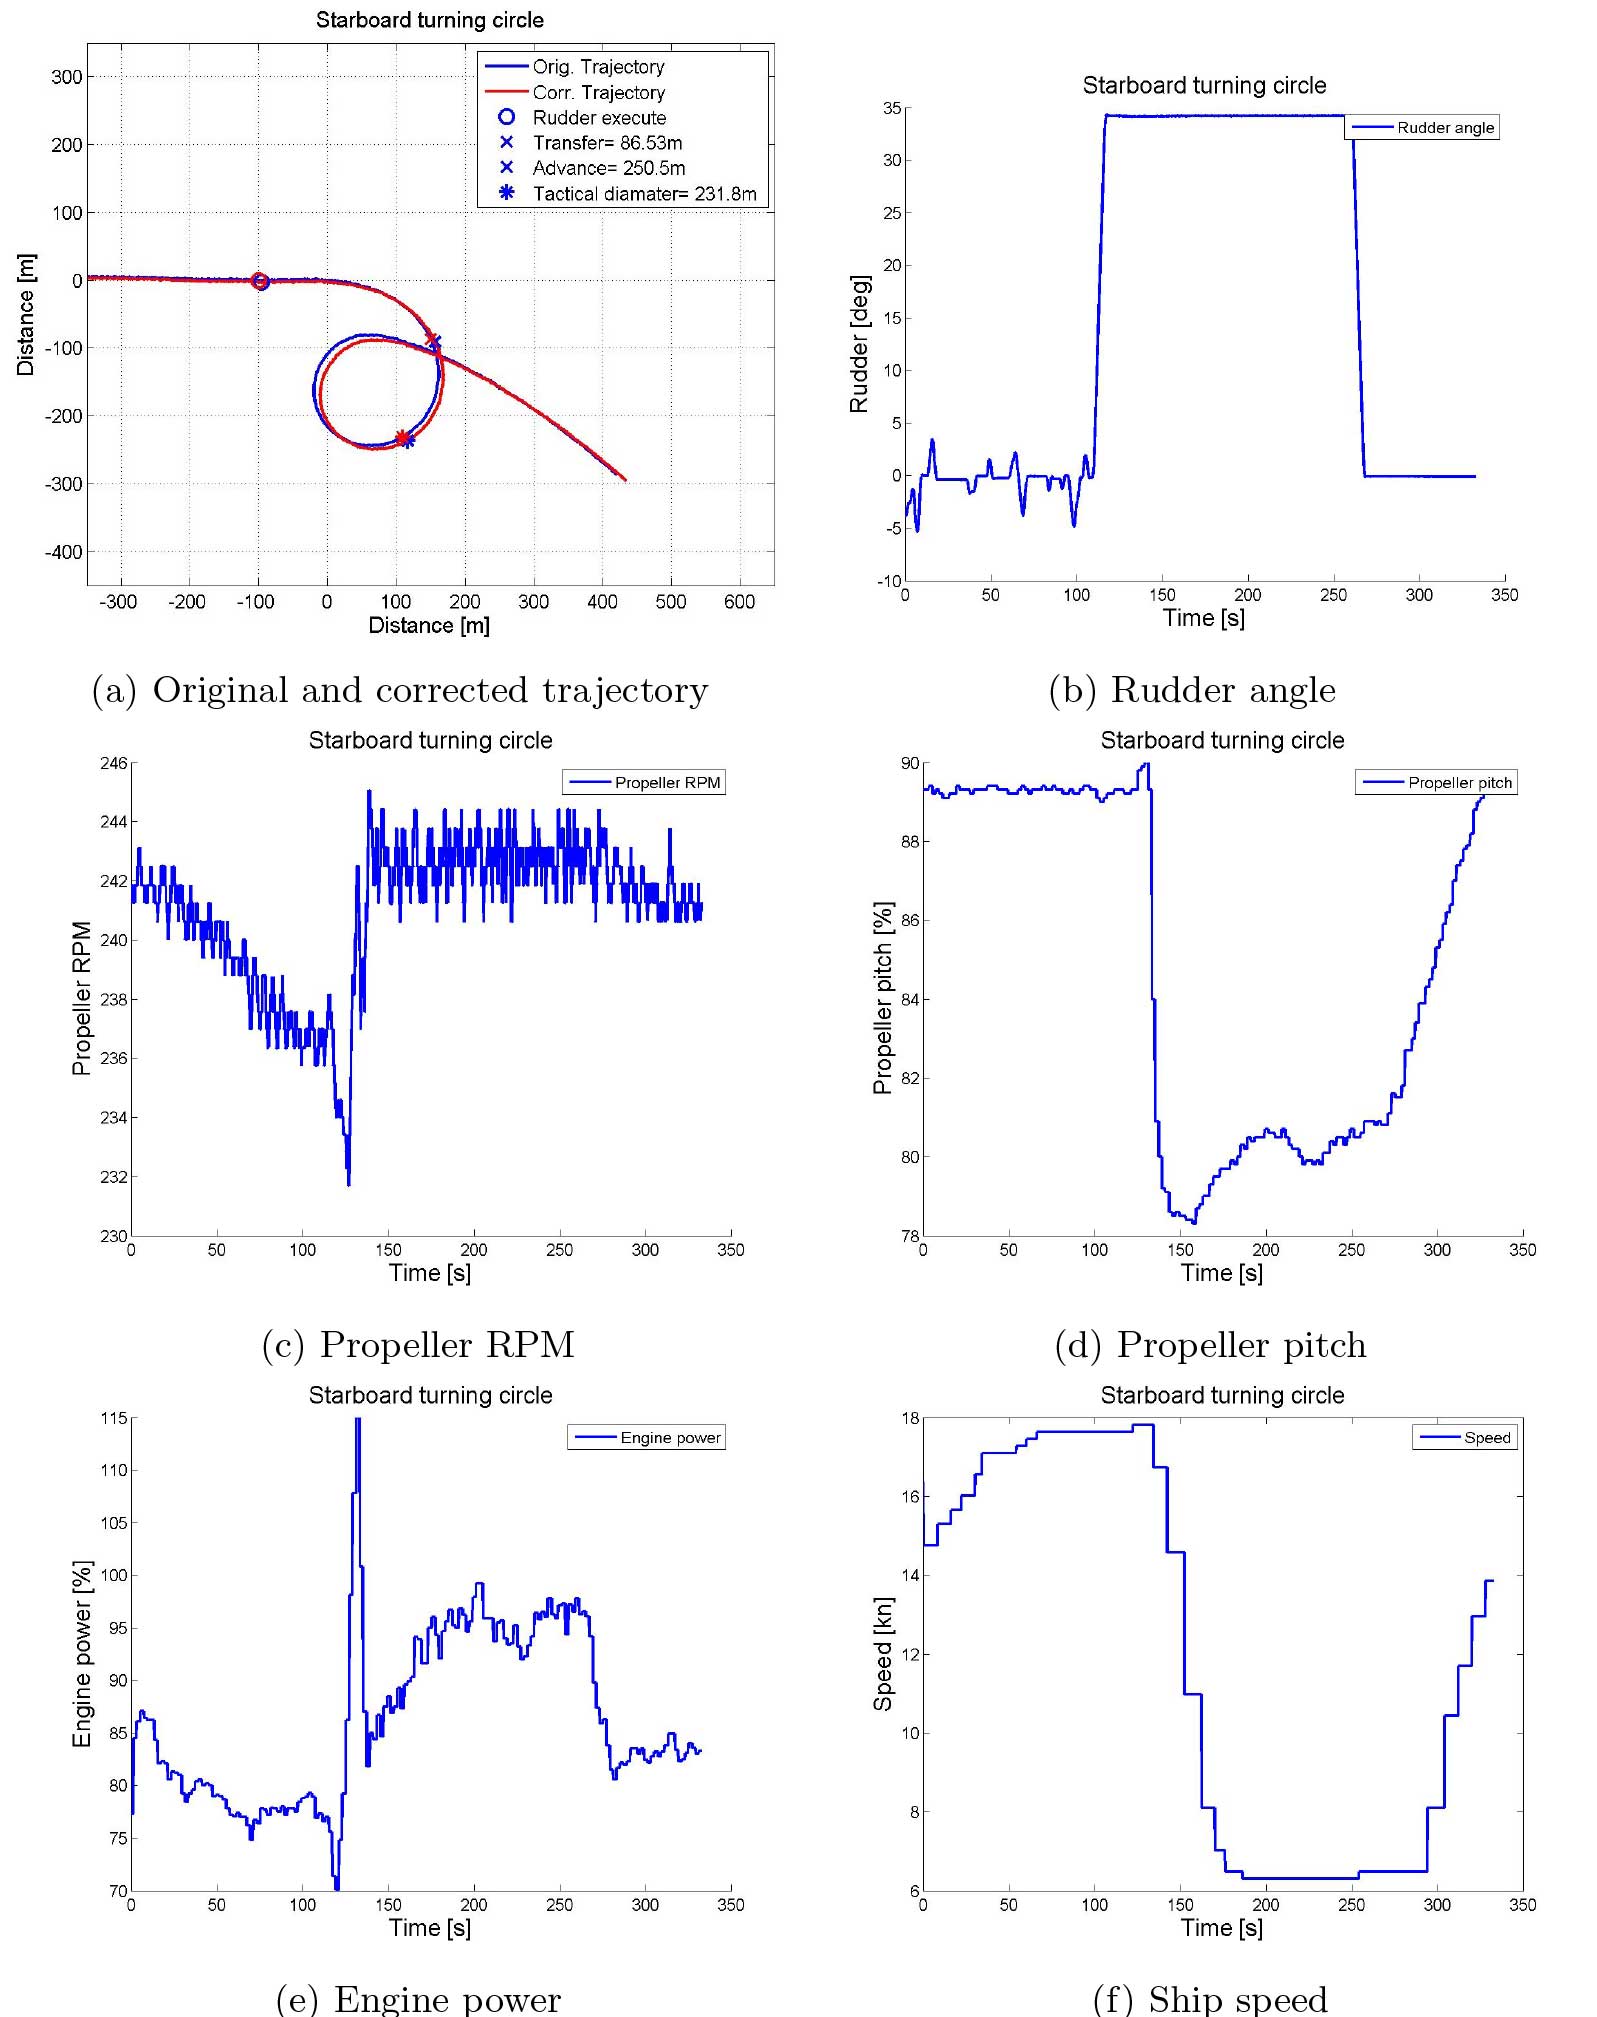
When the turning circle manoeuvre is performed, the propeller pitch and RPM are continuously changed to preserve and minimize engine strain throughout the manoeuvre.
Plots of the different turning circles are given bellow.
Full-scale manoeuvres – Turning circle manoeuvre – Port turning circle
Full-scale manoeuvres – Turning circle manoeuvre – Starboard turning circle
| Table 2. Full-scale port turning circle results | ||||
|---|---|---|---|---|
| Run 3006 | Run 3006 corrected | IMO’s | ||
| Tactical diameter | [m] | 254 | 251,8 | 450 |
| Transfer | [m] | 96,2 | 95,2 | – |
| Advance | [m] | 255,2 | 256,7 | 405 |
| Rudder angle | [°] | 34 | 34 | – |
| Approach speed | [kn] | 17,82 | 17,82 | – |
| Final speed | [kn] | 7,74 | 7,74 | – |
| Table 3. Full-scale starboard turning circle results | ||||
|---|---|---|---|---|
| Run 3005 | Run 3005 corrected | IMO’s | ||
| Tactical diameter | [m] | 231,8 | 233,8 | 450 |
| Transfer | [m] | 86,5 | 87,5 | – |
| Advance | [m] | 250,5 | 252,0 | 405 |
| Rudder angle | [°] | 34 | 34 | – |
| Approach speed | [kn] | 17,7 | 17,7 | – |
| Final speed | [kn] | 6,5 | 6,5 | – |
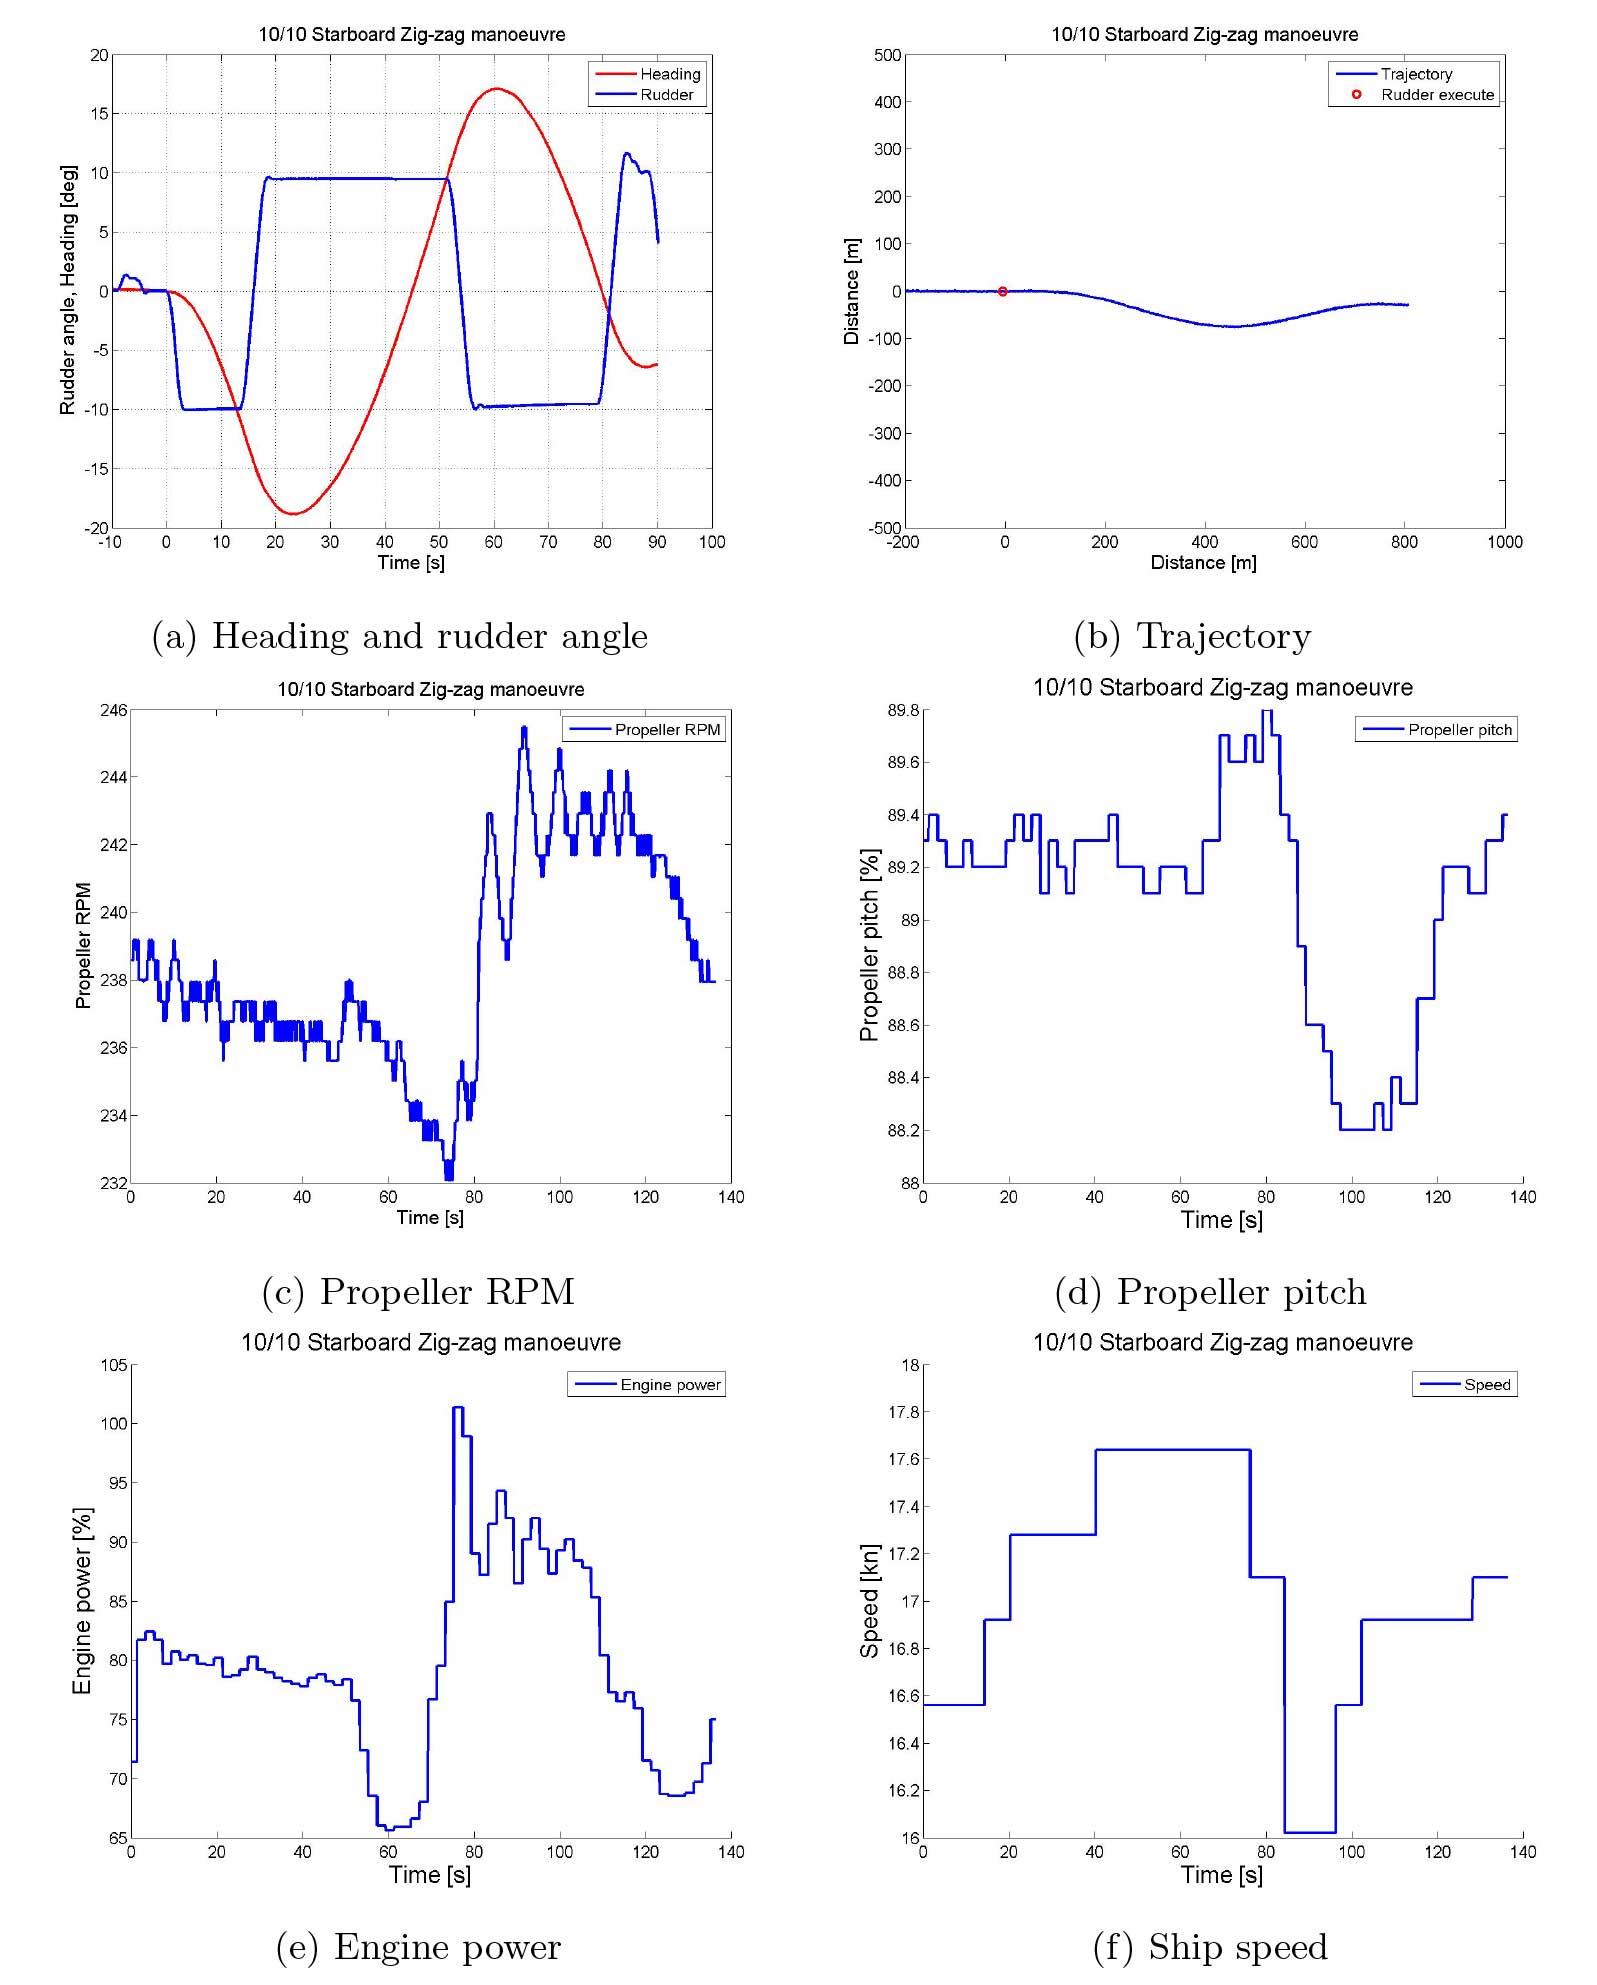
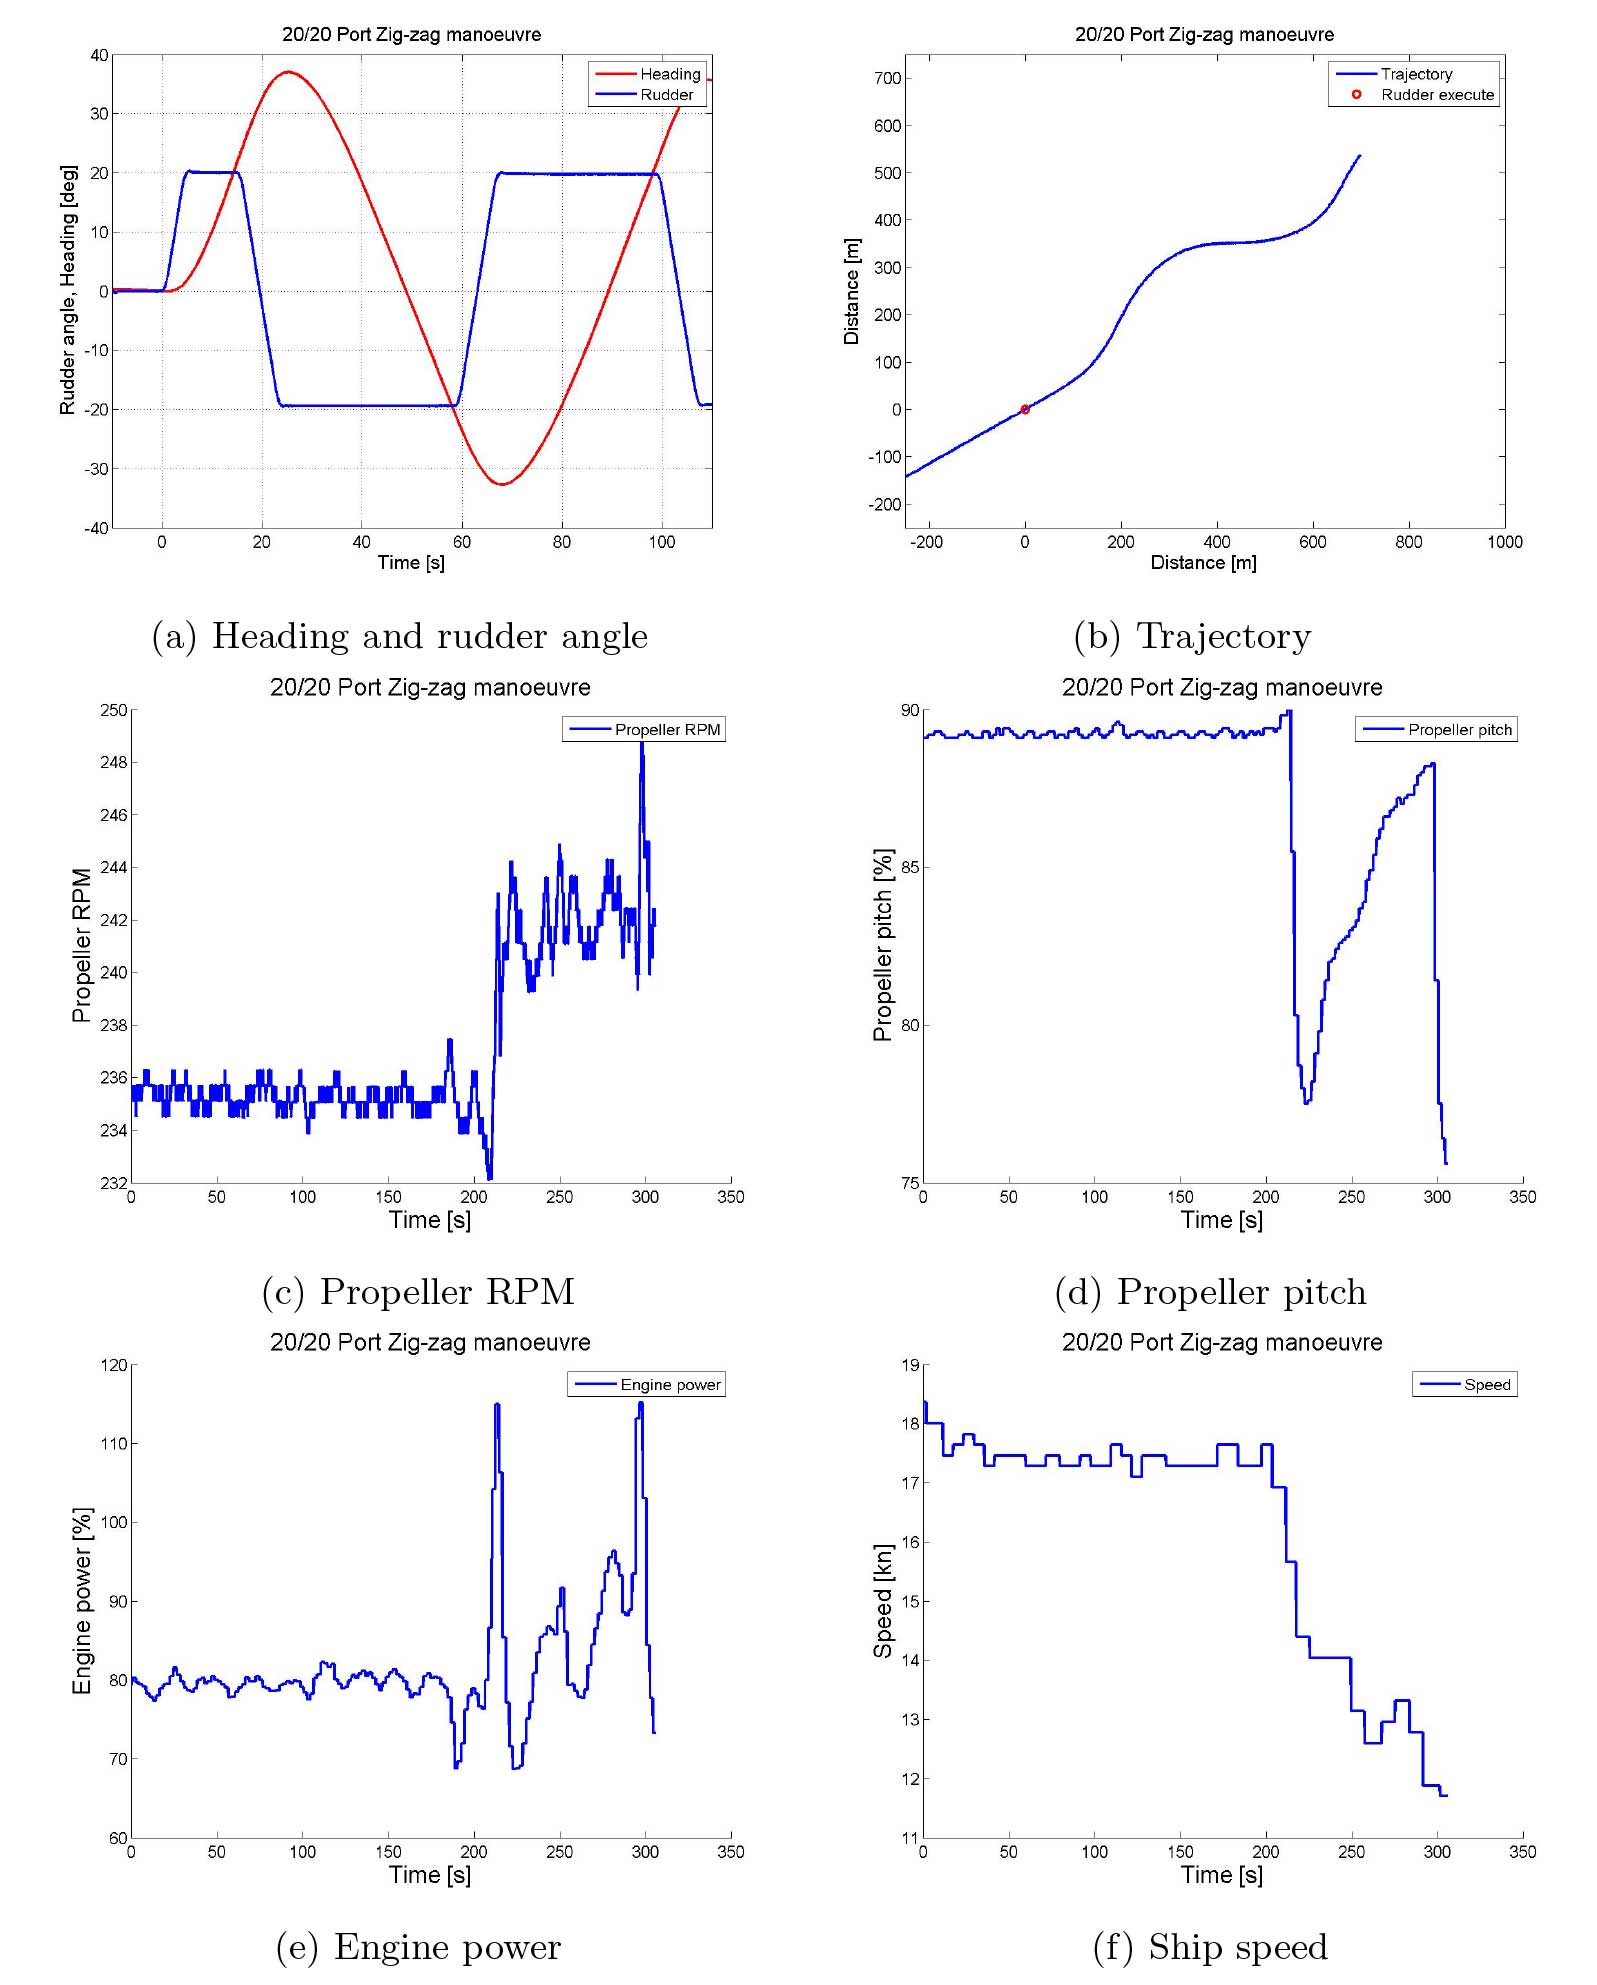
Zig-zag manoeuvre
The zig-zag trials were performed on Thursday 29th of August and on Friday 30th of August. The tests performed on Thursday were test no. 1014 and 1015, a 10/10 and 20/20 test, respectively, and both to starboard. The 20/20 zig-zag manoeuvre became a 20/13 zig-zag manoeuvre due to wrong orders on the bridge. As one of the manoeuvres on Thursday was wrong and the fact that the tests were carried out on two different days, only the trials performed on Friday will be evaluated.
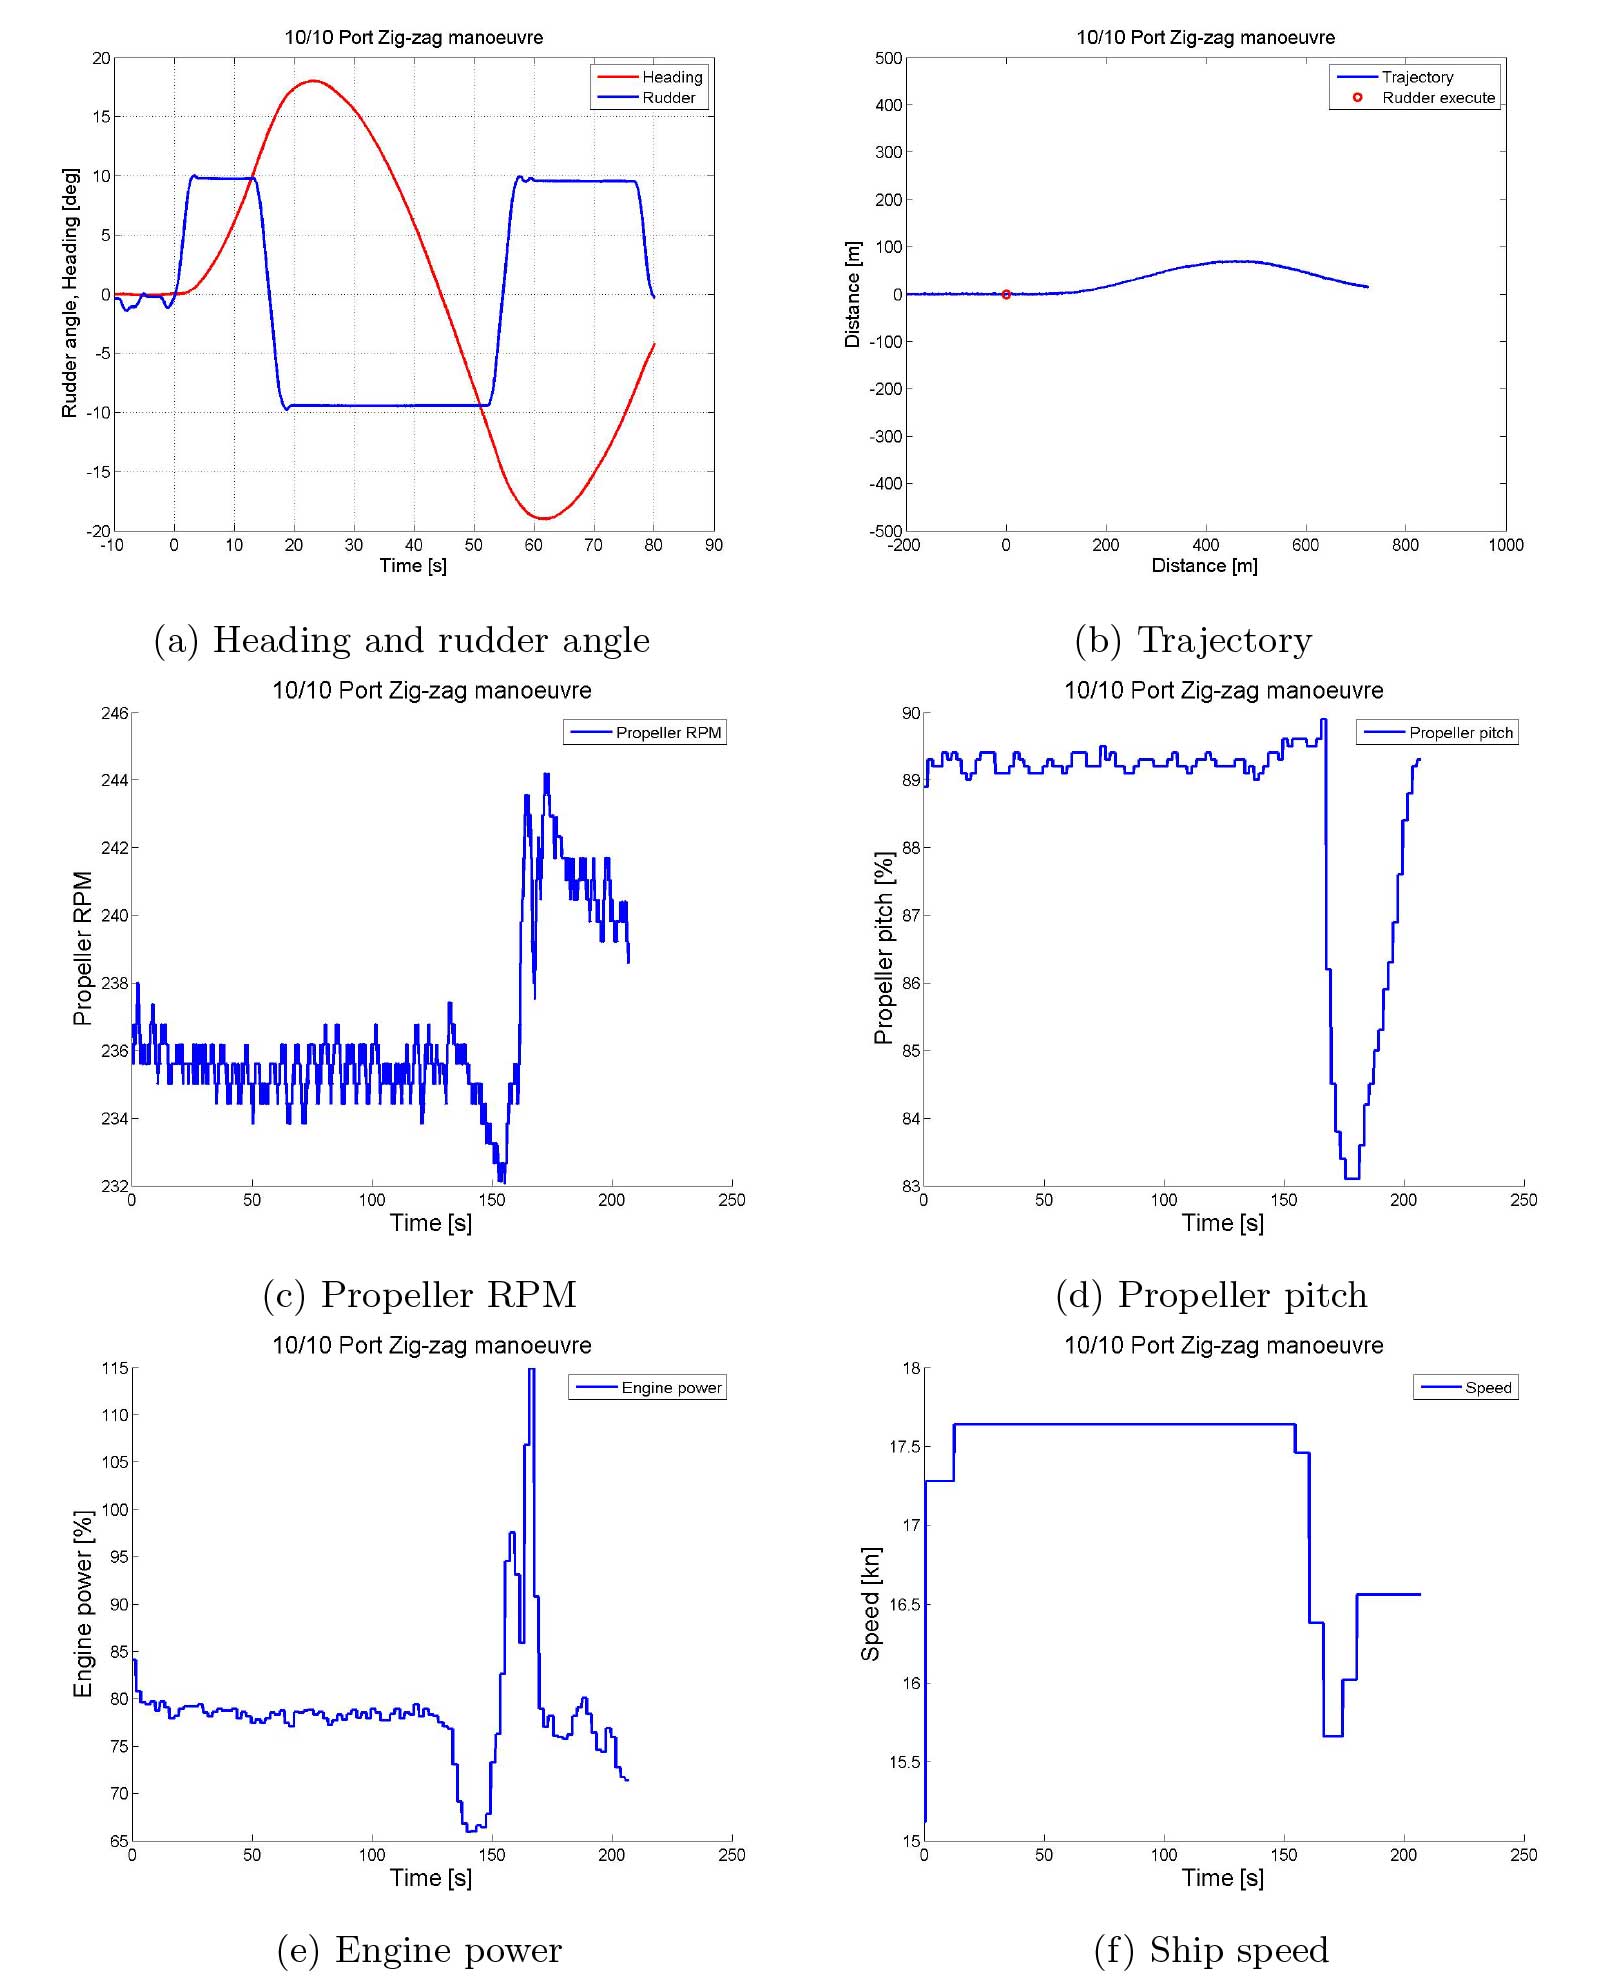
Run 3008 and 3009 gives the starboard zig-zag manoeuvre for the 10/10 and 20/20 test, respectively. Run 3007 and 3012 gives the port 10/10 and 20/20 zig-zag manoeuvre tests, respectively.
Read also: Introduction to the Standard Simulation Tests and Requirements for Naval Hydrodynamics
There has been no correction of influencing environmental conditions when evaluating the results of the zig-zag manoeuvres. The manoeuvre is too complicated to mathematically account for weather conditions and no straight forward correction method can be applied. For complicated manoeuvres such as the zig-zag manoeuvre, Basic Ship Motions and Mathematical Model used in Vessel Simulator (VeSim) Toolsimulation techniques are used.
At the application of the counter rudder, the ship’s continuous turn in the initial direction is measured as the overshoot angle. The first and second overshoot angle is measured as the maximum heading angle reached after the second and third rudder execute, respectively. The time from 1st and 2nd counter rudder to 1st and 2nd overshoot angle is measured correspondingly.
Results
From Table 4, showing the 10/10 and 20/20 zig-zag manoeuvre for both starboard and port, a compliance between the starboard and port tests can be observed.
| Table 4. Full-scale zig-zag results | |||||||
|---|---|---|---|---|---|---|---|
| Starboard | Port | IMO’s | |||||
| 10/10 | 20/20 | 10/10 | 20/20 | 10/10 | 20/20 | ||
| Approach speed | [kn] | 19,0 | 18,8 | 19,1 | 19,1 | – | – |
| Time from 1st counter rudder to 1st overshoot angle | [s] | 9,6 | 10,1 | 9,6 | 10,0 | – | – |
| Time from 2nd counter rudder to 2nd overshoot angle | [s] | 8,8 | 8,8 | 9,1 | 9,0 | – | – |
| 1st overshoot angle | [°] | 7,5 | 15,1 | 7,2 | 14,4 | 10,0 | 25,0 |
| 2nd overshoot angle | [°] | 5,9 | 8,4 | 8,2 | 10,1 | 25,0 | – |
The largest deviation is in the 2nd overshoot angle, between the 10/10 starboard and port manoeuvre, where the difference is about 28%. A difference of about 17 % can be observed in the 20/20 manoeuvre. The rest of the results has a difference of less than 5 %. Given that the tests are carried out in different conditions, e. i. the conditions will not be of 100 % similarity, the compliance between the tests are good. From the IMO’s criteria, it is clear that the vessel is well within the requirements.
Plots of the different zig-zag manoeuvres are presented below.
Zig-zag manoeuvre – Port 10/10 zig-zag manoeuvre
Zig-zag manoeuvre – Starboard 10/10 zig-zag manoeuvre
Zig-zag manoeuvre – Port 20/20 zig-zag manoeuvre
Zig-zag manoeuvre – Starboard 20/20 zig-zag manoeuvre

Stopping test manoeuvre
Thruster turning manoeuvre
Accelerating turn manoeuvre
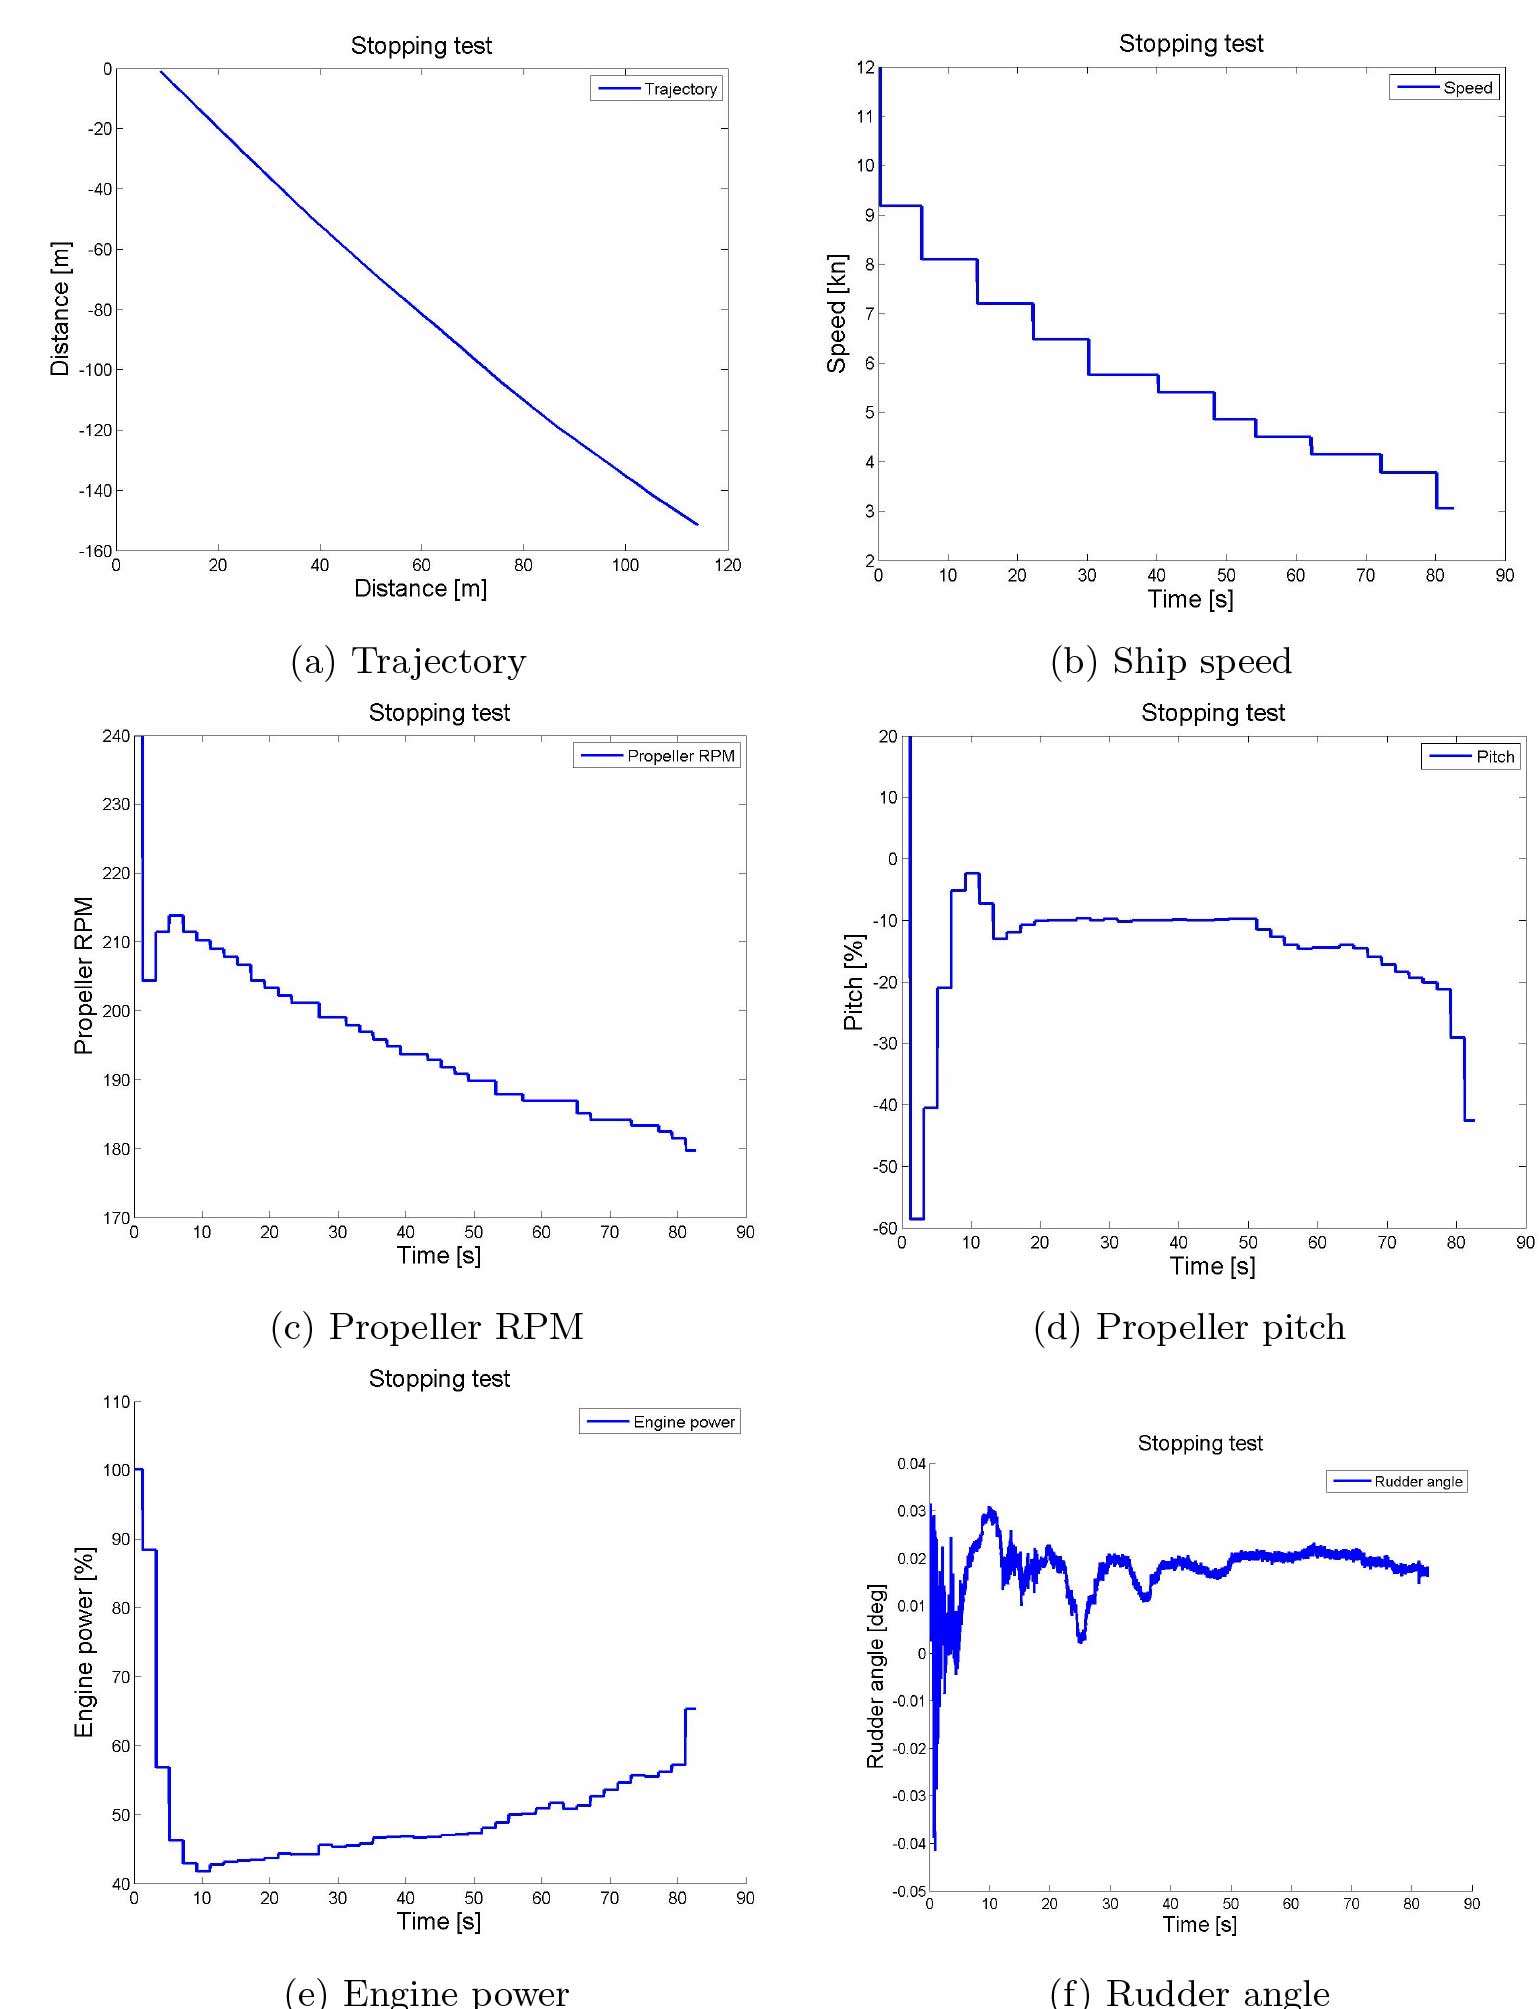
Stopping test
The stopping test was performed on Saturday 31st of August. Run 5020 is the only stopping test performed, and it was not executed as specified in IMO’s MSC/Circ. 1053. The IMO’s requirements states that the ship must be at full ahead speed when the full astern command is given. This can cause great strain on the engine and conducting several tests were hence avoided with this vessel. The vessel is therefore not travelling at full speed during the test. The measured approach speed of the vessel was recorded as approximately 9,2 knots, whereas the top speed of the vessel is stated as approximately 22 knots, see below.
Ship specifications: MF Landegode
| MF Landegode | ||
|---|---|---|
| Owner | Torghatten Nord AS | |
| Designed by | LMG Marine, Norway | |
| Built by | Remontowa Shipyards in Gdansk | |
| Delivery year | 2012 | |
| Port of Registry | Tromso, Norway | |
| Main dimensions | ||
| Draught | T = 3,6 | m |
| Length | Lpp = 90 | m |
| Breadth | B = 16,81 | m |
| Displacement | ▽ = 2 494,634 | m3 |
| Block coefficient | CB = 0,396 | [-] |
| Weight | ∆ = 2 557 | tons |
| Speed | V = 19 | knots |
| Capacity | ||
| Passengers | 390 | |
| Cars | 120 PCU (Personal Car Unit) | |
| Machinery | ||
| Main electroc propulsion | Rolls Royce Bergen, B35:40V12PG with 5 250 kW/750 rpm | |
| Speed at 100 % MCR | 22 knots | |
| Cruise speed | 15-17 knots | |
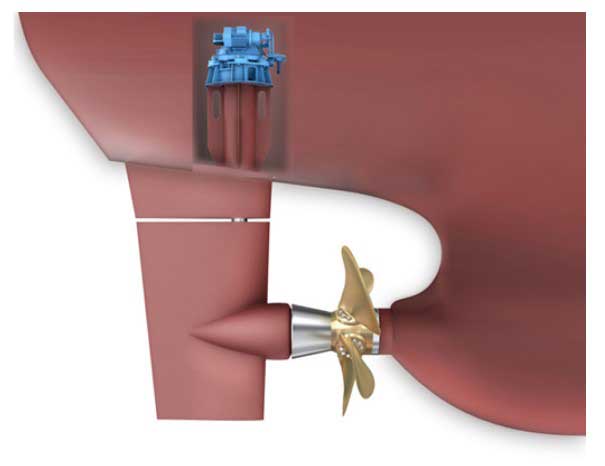
| Main Steering gear and propulsion | Rolls Royce Integrated propeller and rudder system “Promas” | |
This manoeuvre is therefore not evaluated as a standard IMO’s test and will not be compared with the associated Information about Vessel Manoeuvring based on IMO Standardsrequirements of the manoeuvre. When performing the manoeuvre, the speed of the vessel is reduced by reversing the pitch of the propeller instead of setting the machinery in reverse. This will, in addition to tuning the RPM of the engine and the thrust, reduce engine strain.
Results
From Table 5 the full-scale trial results are presented. Picture 6 depicts the trajectory of the vessel and Picture 7 depicts the speed and propeller pitch of the vessel as picture a) and b), respectively.
| Table 5. Full-scale stopping test results | ||
|---|---|---|
| Run 5020 | ||
| Track length | [m] | 183,72 |
| Ship length | [-] | 2,0 |


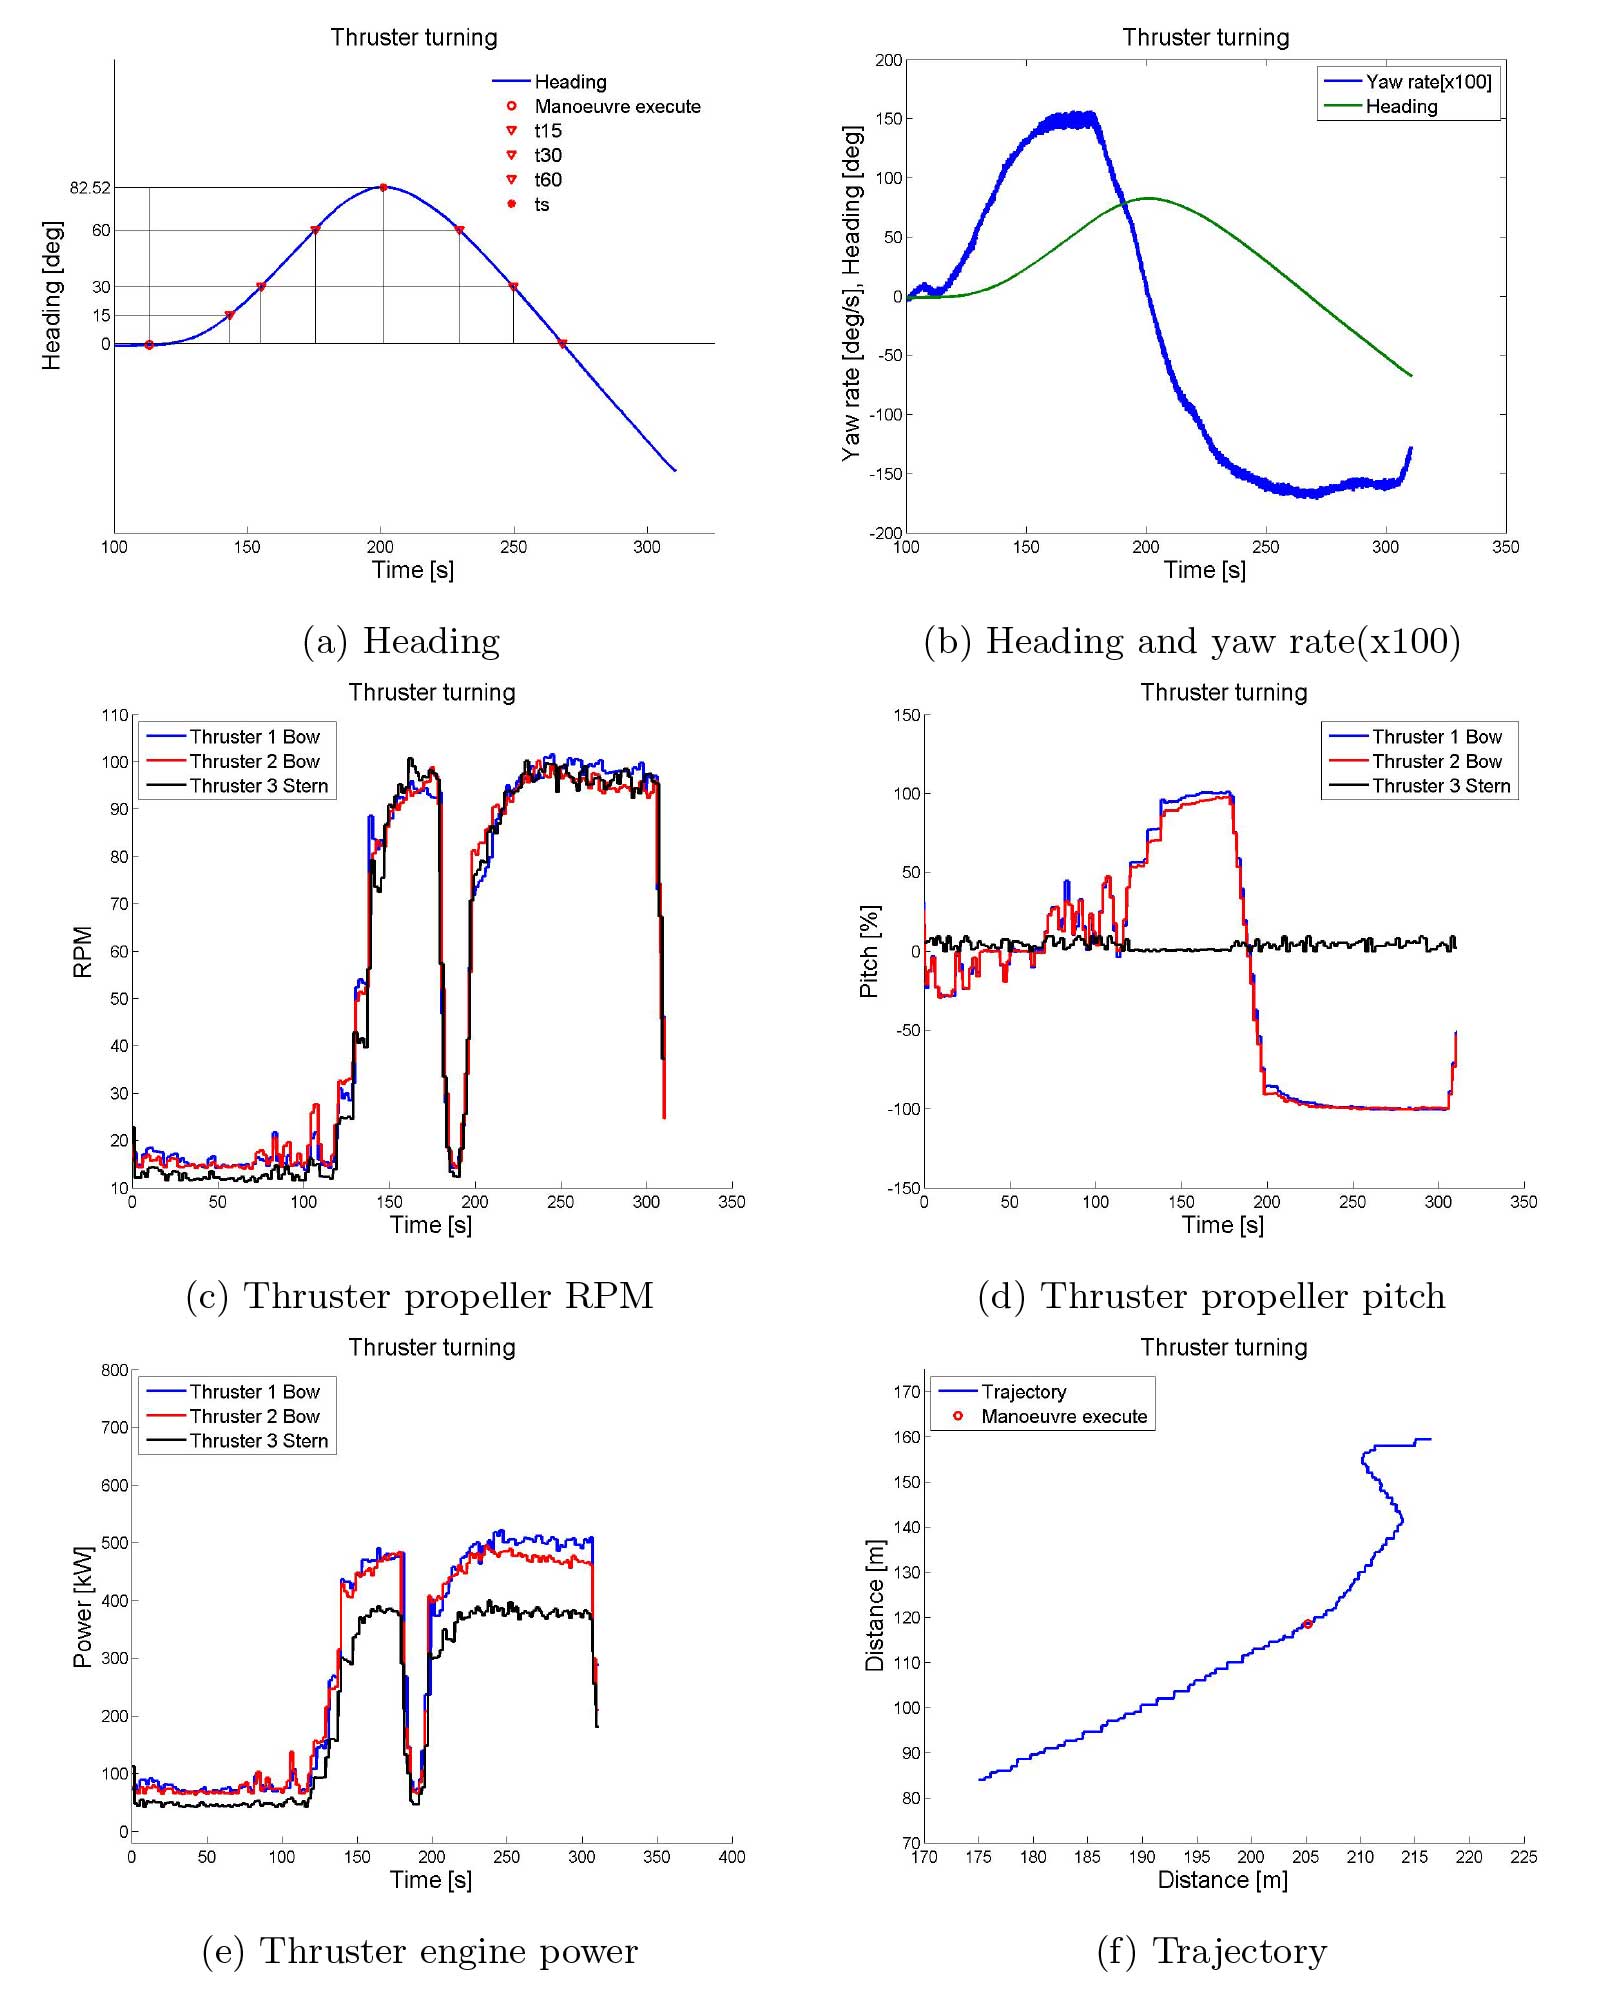
Thruster turning manoeuvre
The thruster turning manoeuvres were performed on Thursday 29th, Friday 30th and Saturday 31st of August. All combinations of thruster 1, 2 and 3 have been performed at zero, forward and astern speed. Only the combination of all three thrusters at zero speed will be evaluated in this article, as this manoeuvre is most likely to be used in the quay area and is thus of highest interest.
Run 1005 was conducted with bow thrusters (numbered 1 and 2) set at 100 % MCR towards starboard and the stern thruster (numbered 3) set at 100 % MCR towards port.
The data to be recovered from the test are as described in Information about Vessel Manoeuvring based on IMO Standards“Additional manoeuvres”.
Results
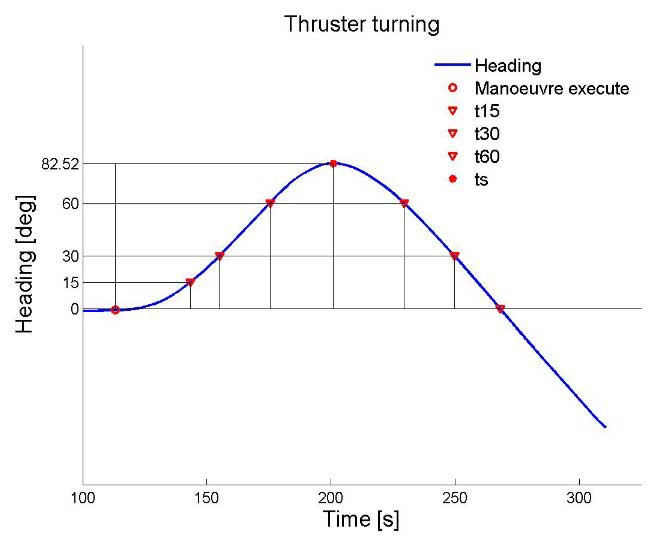
Picture 8 shows the result from the thruster turning test as heading versus time. The manoeuvre execute is given by the red circle and the different time values for heading reaches of 15, 30, 60, return to 60, return to 30 and return to 0 degrees are given by the red triangles. Table 6 lists the measured time and heading angle results depicted in Picture 8.
| Table 6. Full-scale thruster turning results | ||
|---|---|---|
| Run 1005 | ||
| t15 | [s] | 30,3 |
| t30 | [s] | 42 |
| t60 | [s] | 62,4 |
| ts | [s] | 87,9 |
| t60R | [s] | 116,4 |
| t30R | [s] | 136,6 |
| t0R | [s] | 154,9 |
| ∆ts | [s] | 25,5 |
| ψs | [deg] | 82,52 |
| ∆ψs | [deg] | 22,52 |
Accelerating turn manoeuvre
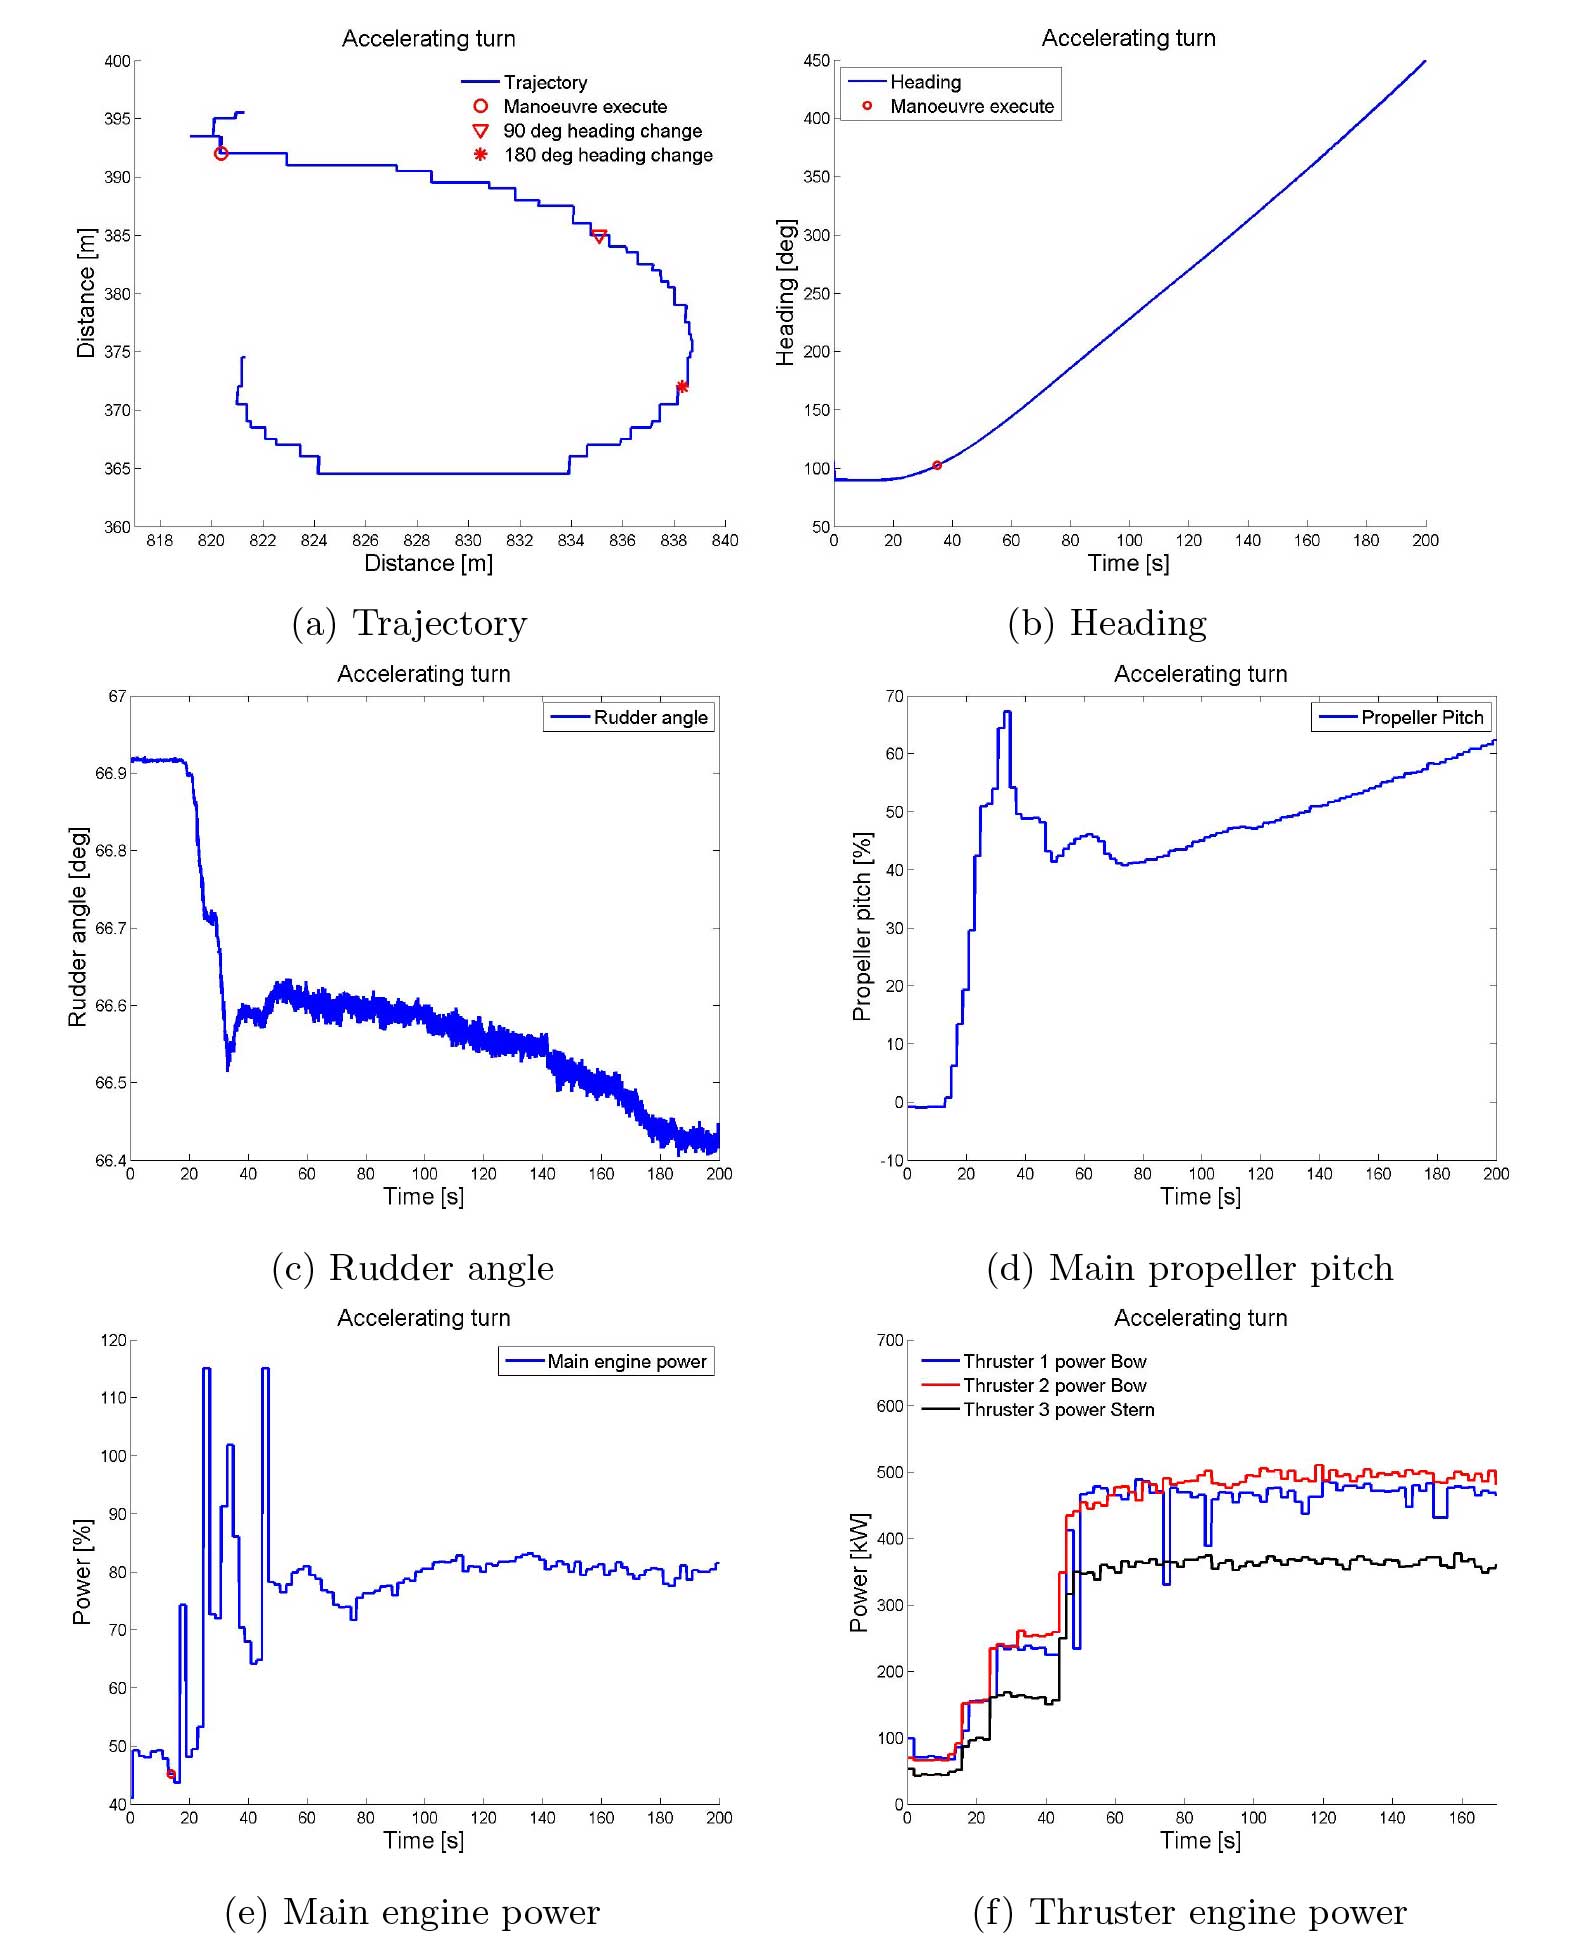
Accelerating turn tests were performed on Friday 30th of August. Combinations in use of thrusters, engine power and rudder angle were conducted. The manoeuvre analysed, run 3020, was conducted with all three thrusters operating at 100 % MCR, with thruster 1 and 2 (bow thrusters) set towards starboard, and thruster 3 (stern thruster) set towards port. The engine was set at 75 % MCR and the rudder was set hard over at 65°, initiating a starboard turn. The propulsion plant settings at the start of the manoeuvre were not altered throughout the test.
The data to be recovered from the test are as described in Information about Vessel Manoeuvring based on IMO Standards“Additional manoeuvres”.
Results
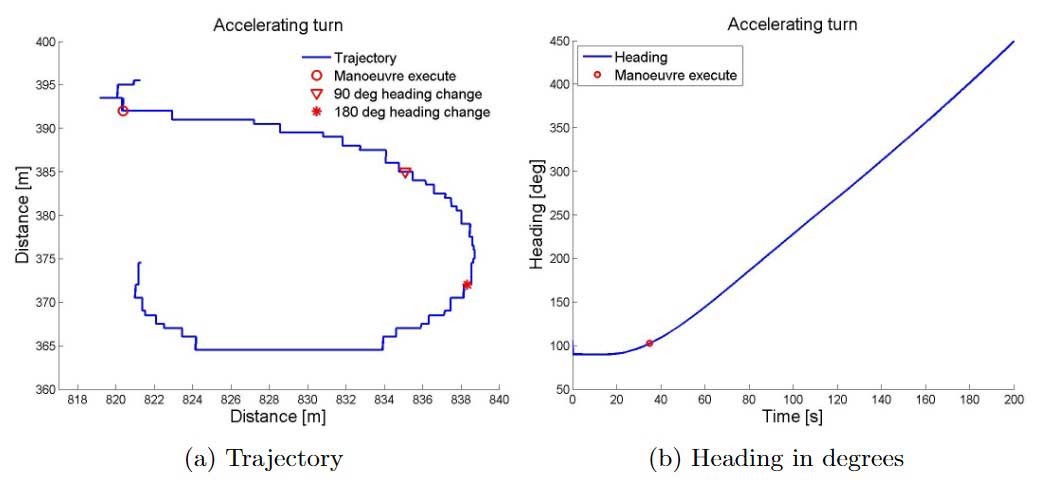
Picture 9 presents the trajectory and the heading reach as Picture a) and b), respectively. In Picture a), showing the trajectory of the test, the manoeuvre execute is given by the red circle, while the red triangle and star gives the reach of 90° and 180◦ heading change, respectively. Table 7 presents the results of the manoeuvre.
| Table 7. Full-scale accelerating turn results | ||
|---|---|---|
| Run 3020 | ||
| Advance | [m] | 14,72 |
| Transfer | [m] | 7,0 |
| Tactical diameter | [m] | 20,0 |
| Time to turn 90° | [s] | 48,27 |
| Time to turn 180° | [s] | 91,23 |
| Speed at 90° change of heading | [kn] | 0,66 |
| Speed at 180° change of heading | [kn] | 0,63 |