The Ship-Safe System by ABS Engineering utilizes advanced diagnostics and real-time monitoring to significantly enhance maritime safety and operational reliability. This comprehensive system ensures optimal vessel performance and safety through continuous assessment and early detection of potential issues.
ABS Engineering has introduced its innovative Ship-Safe System, a cutting-edge solution designed to enhance maritime safety and operational efficiency. This system integrates advanced sensor technology, real-time data analytics, and robust predictive algorithms to monitor vessel integrity and environmental conditions continuously. By providing critical insights and early warning alerts, the Ship-Safe System helps in preventing accidents and minimizing downtime.
Typical Presentation
The following has been taken from typical presentations on ABS experience and capability on advanced analysis for LNGC’s given by the Advanced ABS Engineering Analysis for LNGCABS Engineering and Focus Group members to the ABS clients and potential customers. Of course, depending of the source, the style of the slides will be different.
Presentation
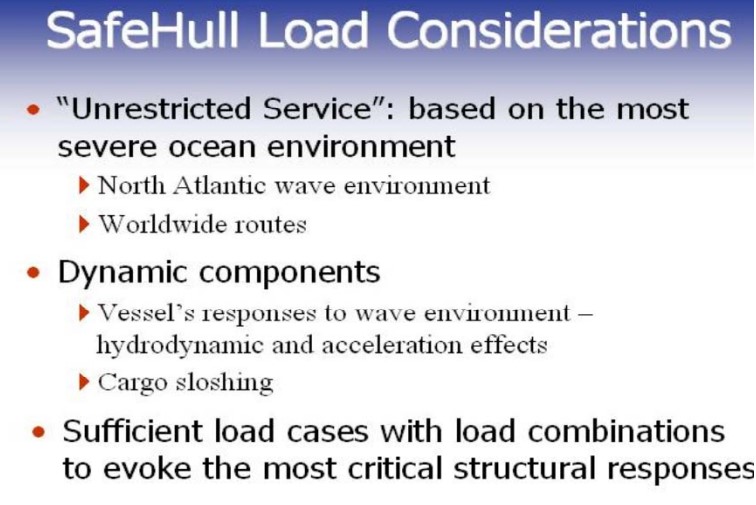
In general the first figures of the presentation show the summary of the presentation that, in general contains all the aspects relative to the refined analysis that may be performed by ABS.
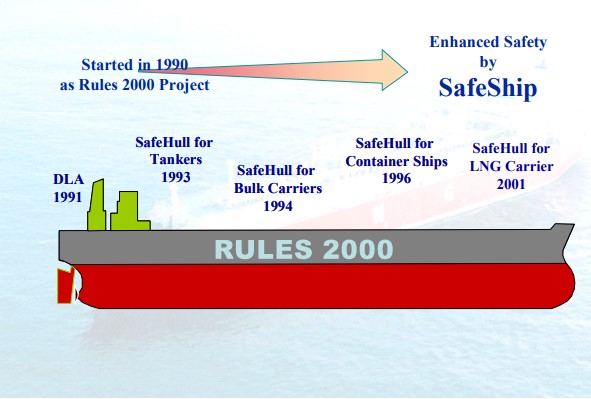
Safehull (safe-ship) Principles and Evolution
Figure 1 summarizes the history of SAFEHULL. SAFEHULL project started on 1990 as a revolutionary approach for the assessment of the scantlings of the ships. As anticipated in Module 5 and Part 1 of this Module, the introduction of SAFEHULL was ending the semi-empirical way to calculate the scantlings by simple formulae based on simple beam theory calibrated on basis of the experience on existing ships replacing it by a more sophisticated computer analysis, which takes into account the actual loads imposed by the sea on ship structures, and then adding, to the simple determination of the scantlings, a preliminary simplified fatigue analysis of the most critical areas.
Moreover, SAFEHULL is designer-friendly, once the geometrical data of the ship have been input, it permit one to find the best arrangement to optimize the distribution of the steel. Once the principles of SAFEHULL were settled, it was necessary to calibrate the program to the various types of ships. SAFEHULL for LNGC’s was introduced on 2001. It is to be noted that SAFEHULL is applicable to membrane LNG carriers.
SAFEHULL consists of two phases. The Phase “A” can be run on any PC and supplies the complete preliminary scantlings of the ships, based on the actual loads imposed by the environment and various loading cases. Basic scantlings of the ship may be assessed based on the Phase “A” results.
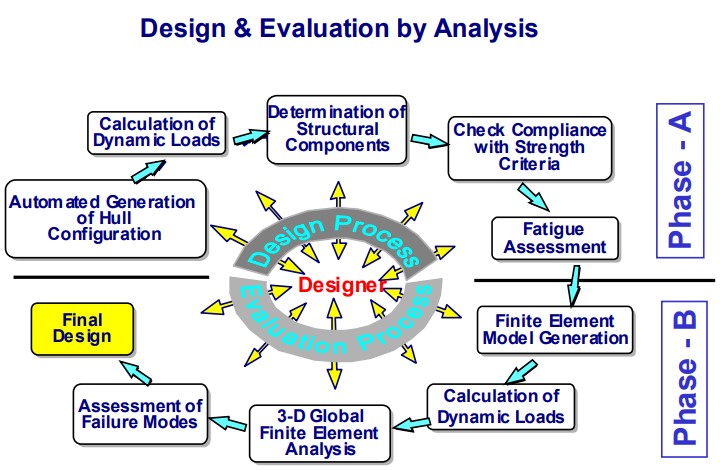
Phase “A” is followed by a more refined analysis, indicated as phase “B“. This is a sophisticated, three dimensional, Finite Element Analysis, which is used to confirm the results of phase “A“, to highlight possible high stressed spots, which would not be highlighted by carrying out the only phase “A“, to further optimize the structure having a more precise evidence of the behavior of the various structures in all the conditions that the ship might encounter during her life. In general the three dimensional model used for Phase B includes a portion of three holds of ship only. For a typical 4 tanks LNG carrier the typical model includes hold N. 4, 3 and 2.
SAFEHULL for LNGC’s has been tailored for membrane ships taking into account the loading patterns, the pressures deriving from the accelerations stated by the The Origins of the IGC CodeIGC Code, and the sloshing loads, supplies the required Hull Girder Section Modulus and assess the structures against Yielding, buckling and fatigue.
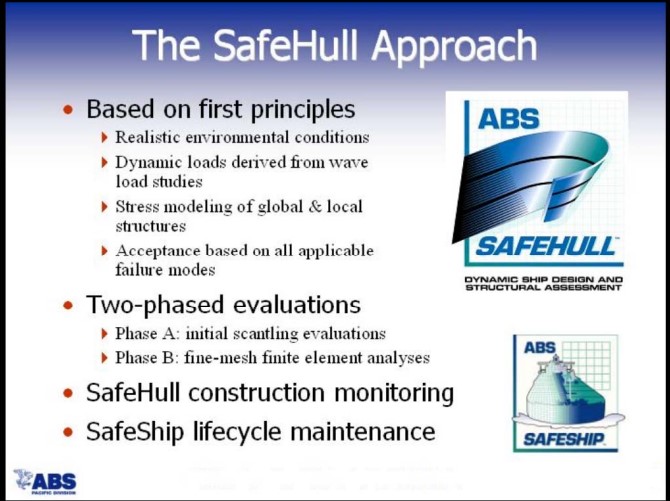
Part of SAFEHULL approach is the SAFEHULL monitoring approach described under Module 5.
The above is summarized in Figures 3 and 4.
SAFEHULL Phase “A”
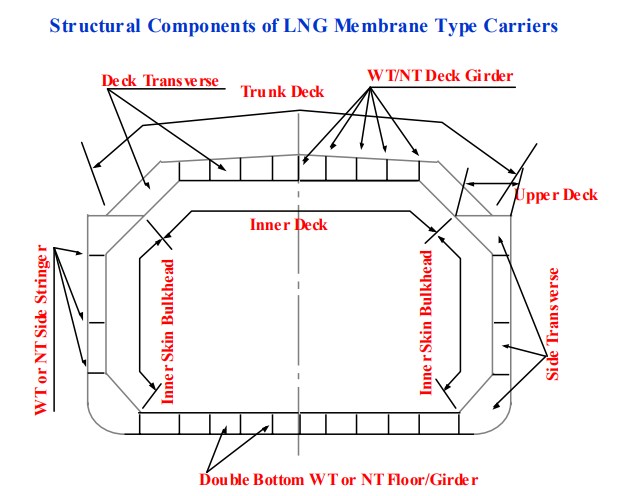
Figure 5 is relative to Phase “A“. It shows a typical midship section of a membrane type LNGC drawn by SAFEHULL. In this slides the scantlings determined by SAFEHULL are not indicated.
SAFEHULL Phase “B”
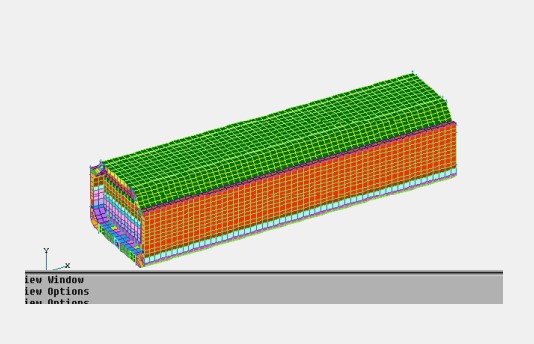
Figure 6 is relative to the SAFEHULL Phase “B” and shows a typical three-dimensional model for the analysis relative to the cargo area.
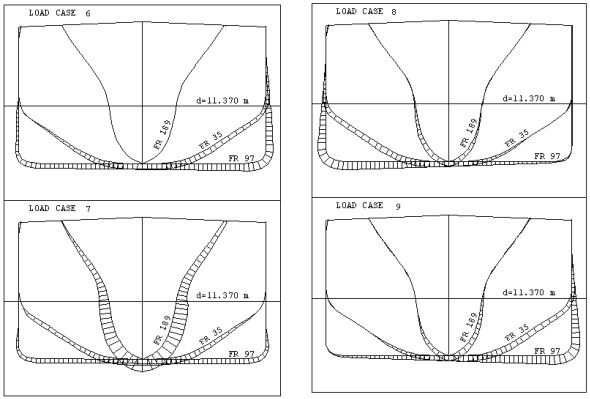
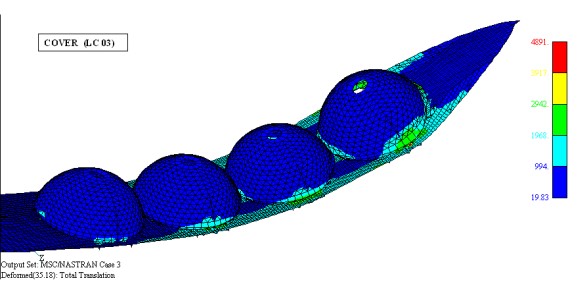
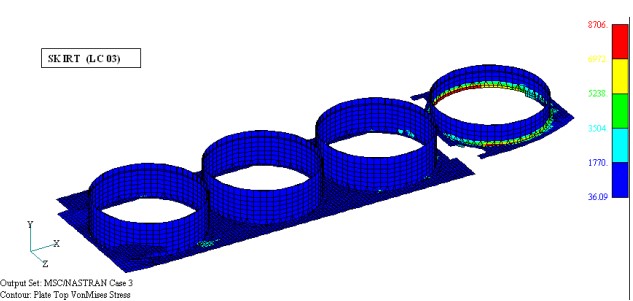
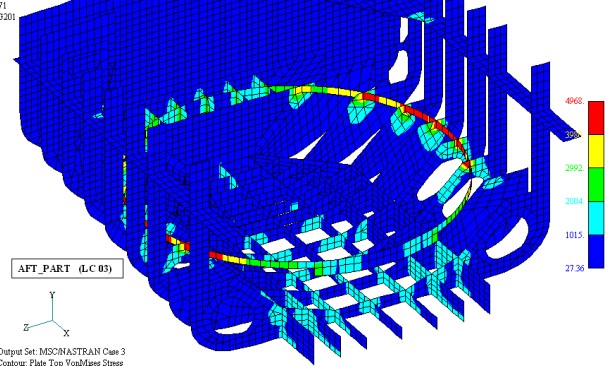
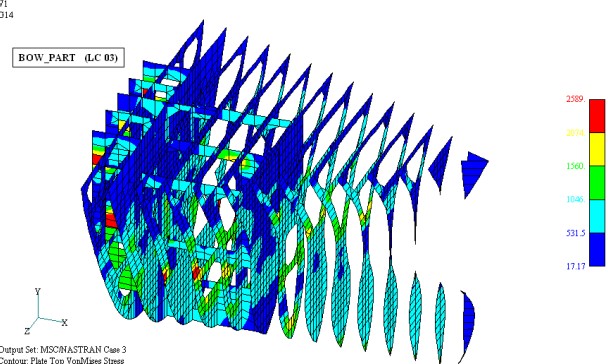
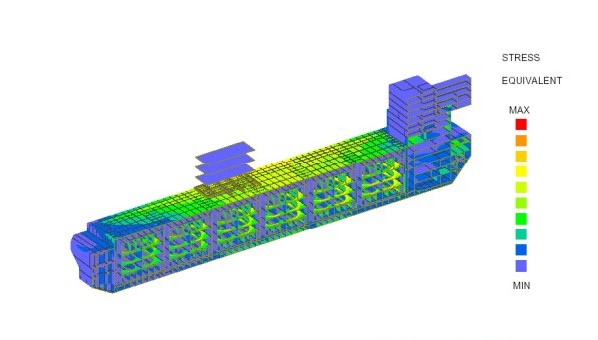
Figures 7 and 8 show the same model after several running of the program for different loading conditions. The deformations of the hull are magnified to give emphasis to the behavior of the structures and the distribution of the stresses along the various structures is given through color codes in order to give an immediate perception of the high stressed areas.
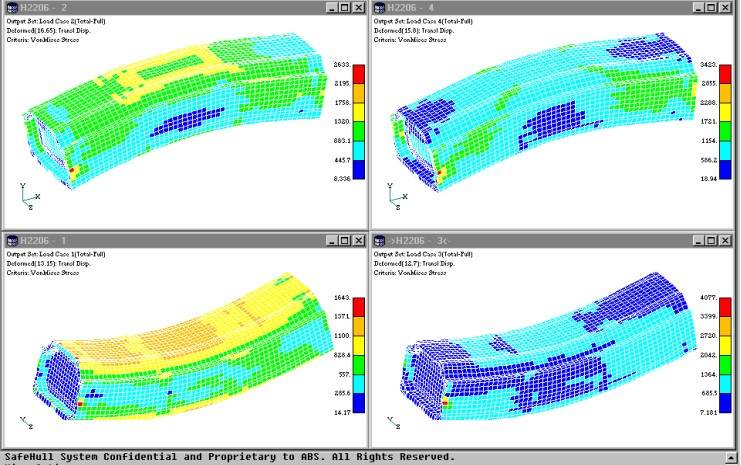
for Safehull Standard Loading Condition (L.C 1 to 4)

for Safehull Standard Loading Condition (L. C 5 to 8)
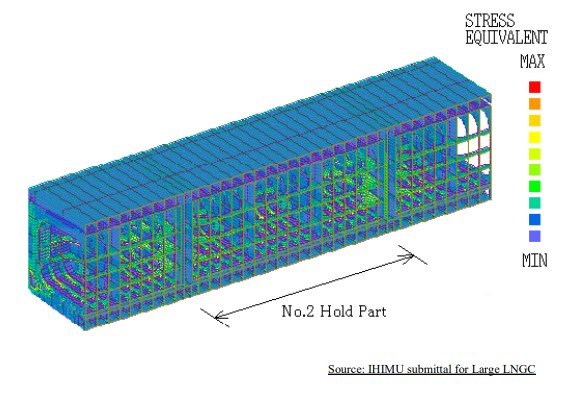
Figures 9, 10 and 11 clearly show the model used for a Phase “B” analysis of a LNG carrier.
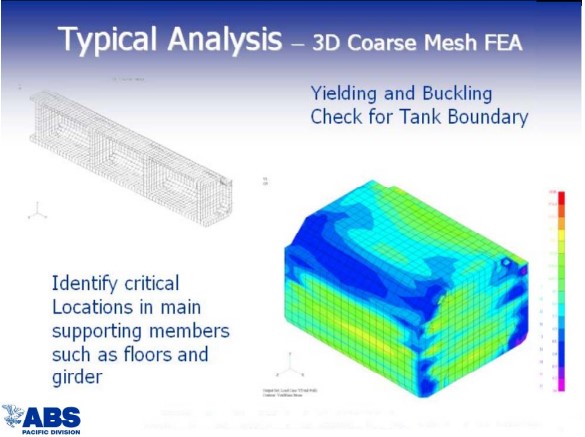
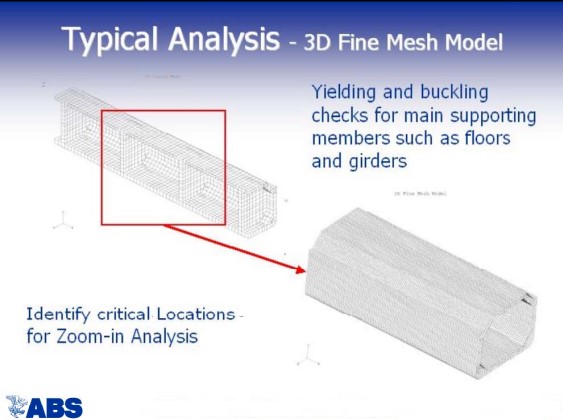
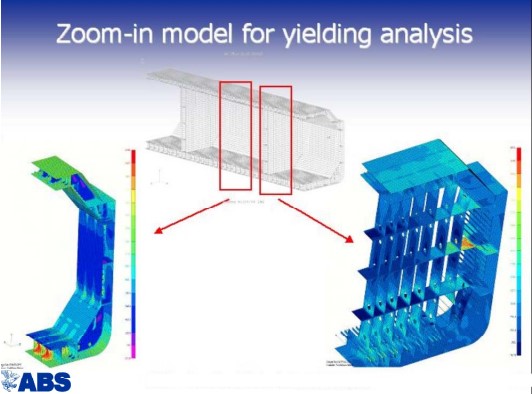
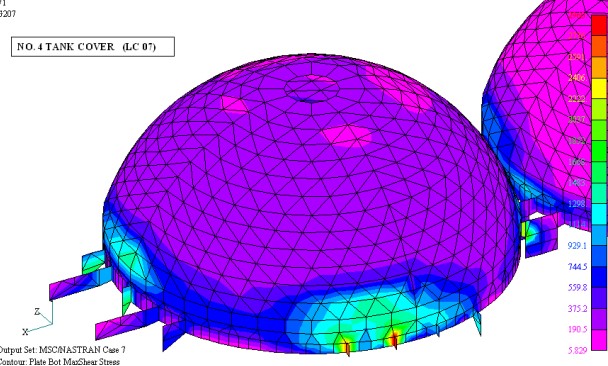
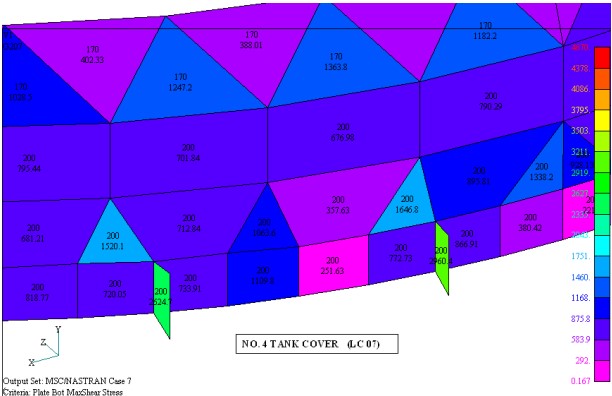
Figures 11 through 20 are relative to the zooming process to analyze the high stressed areas and to assess their fatigue life. The areas, which are indicated subject to high stress in the global coarse model, are examined in detail with fine mesh applying the loads and the stress obtained by in the global model.
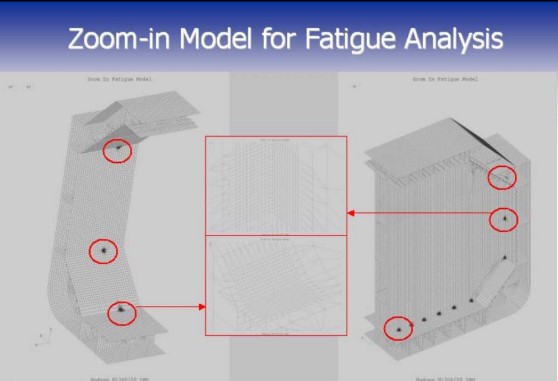
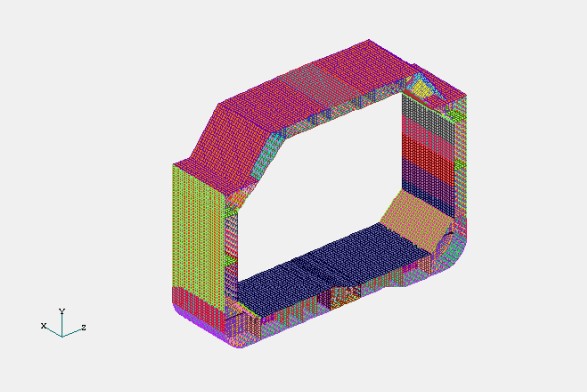
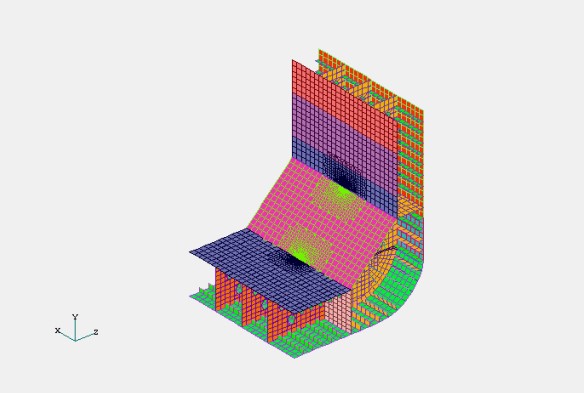
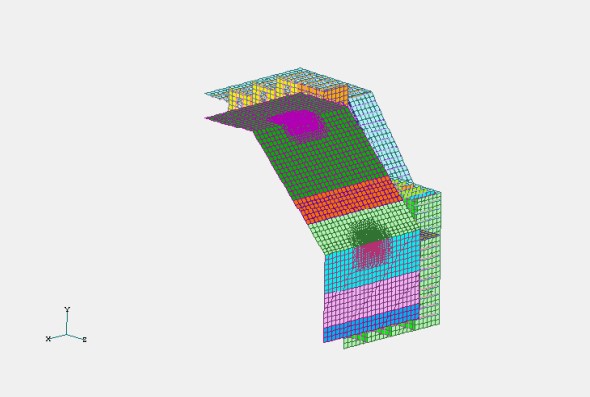
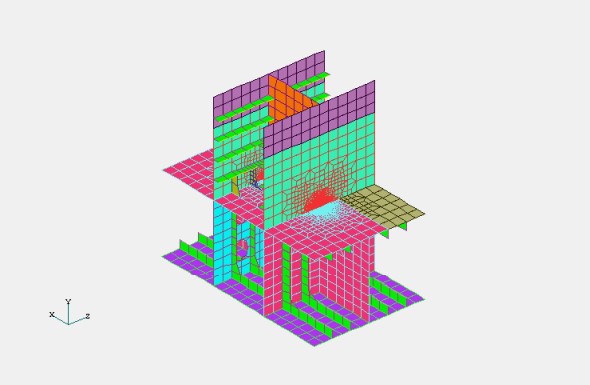

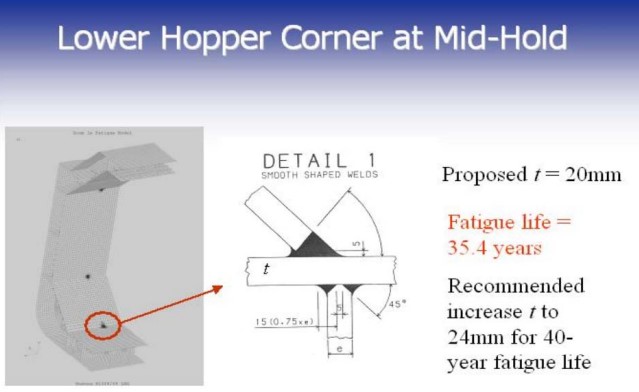
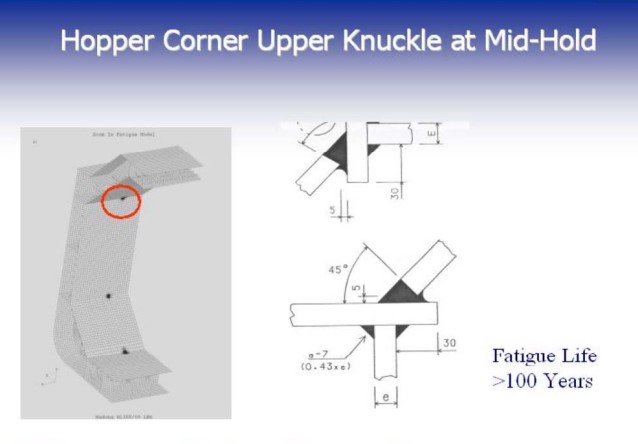
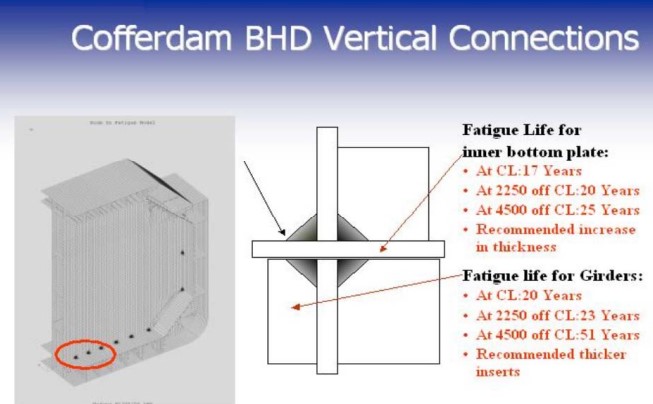
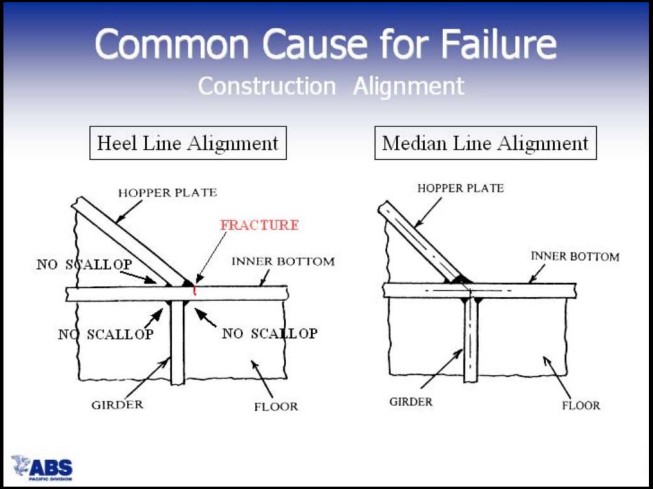
Figure 21 indicates common causes of failure of structural details.
Dynamic Loading Approach (DLA)
Dynamic Loading Analysis (DLA) is a sophisticated structural analysis to be carried out upon specific request of the Owner/Yard. From a certain point of view it may be considering as further step after SAFEHULL Phase “B” towards the accurate representation of the ship behavior. Figure 22 indicates the main steps of the approach.
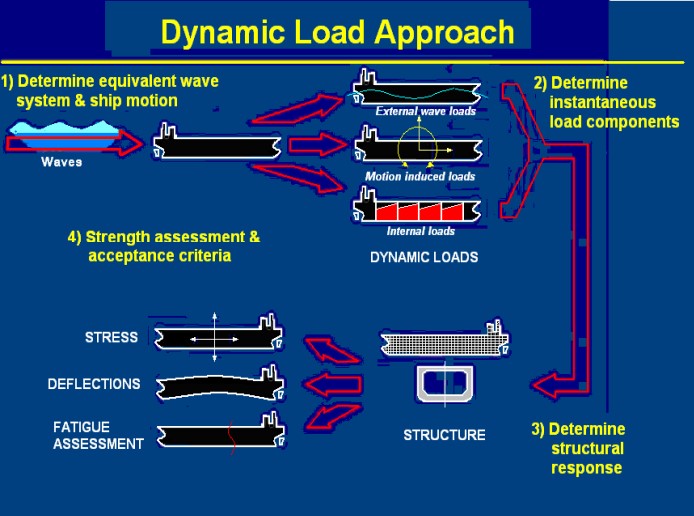
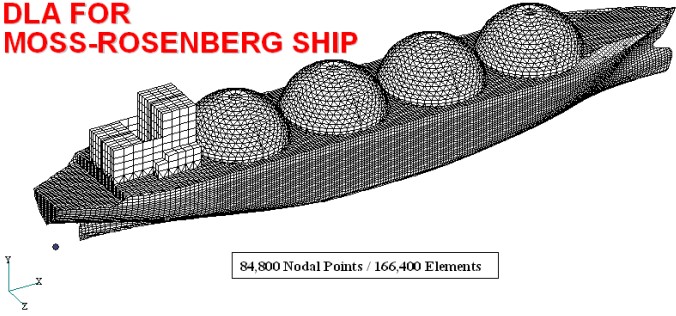
The approach starts from the definition of the actual statistical sea conditions in the routes the ship is likely to navigate during her life. This permits to arrange the model of the ship on a wave equivalent to the worst sea status (from the point of view of the ship’s strength) and to load the structures with the external static loads, the dynamic loads deriving from the movement of the ship and the internal loads due to the cargo, and its movement, if any (for instance slack holds). By imposing these loads on the structures designed in accordance with SAFEHULL, it is possible to determine the actual deflections, stresses, and to assess LNGC Fatigue Assessment and Heating Systemthe fatigue of the ship with a very high approximation. Figure 23 shows the complete model used for DLA.
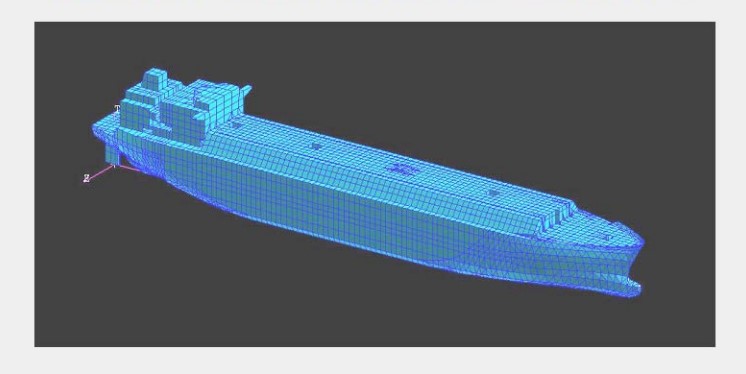
Figure 24 shows the ship model on the selected wave model.
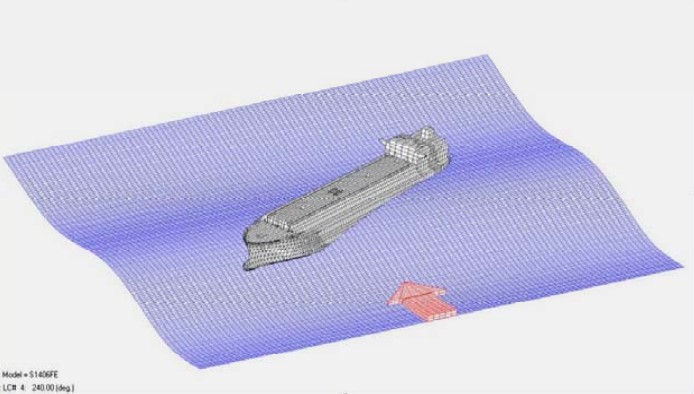
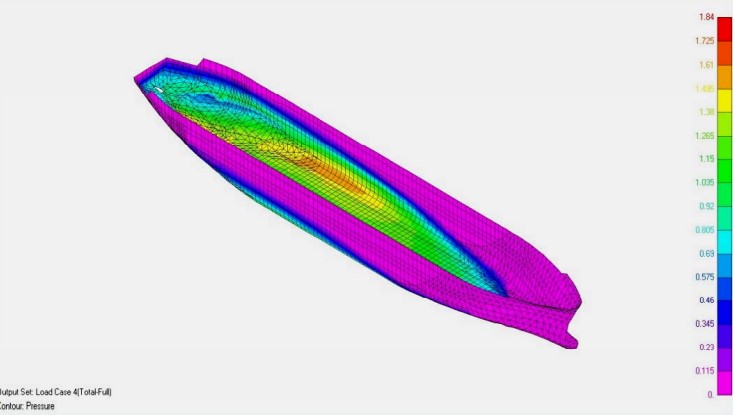
Figure 25 shows the distribution of the wave pressures on the ship.
Finally figure 26 shows the deflections and the stresses of the hull.
Spectral Fatigue Analysis (SFA)
As the DLA, the Spectral Fatigue Analysis (SFA) is a more refined analysis of fatigue, which, when performed, makes the ship eligible to the SFA class notation. Figures 27 and 28 are self-explanatory and delineate the SFA procedure.
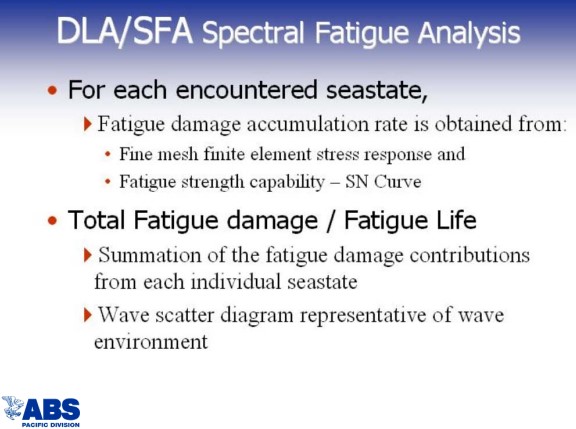
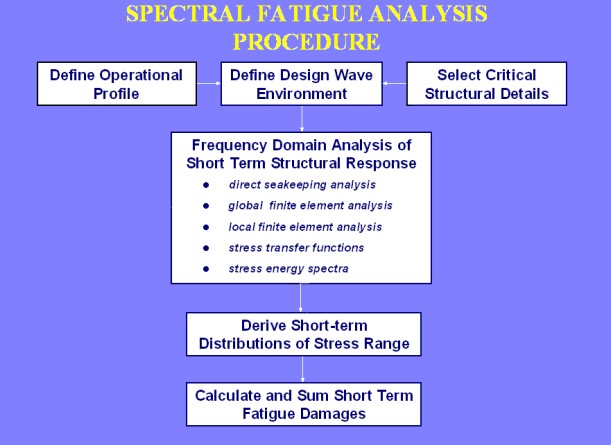
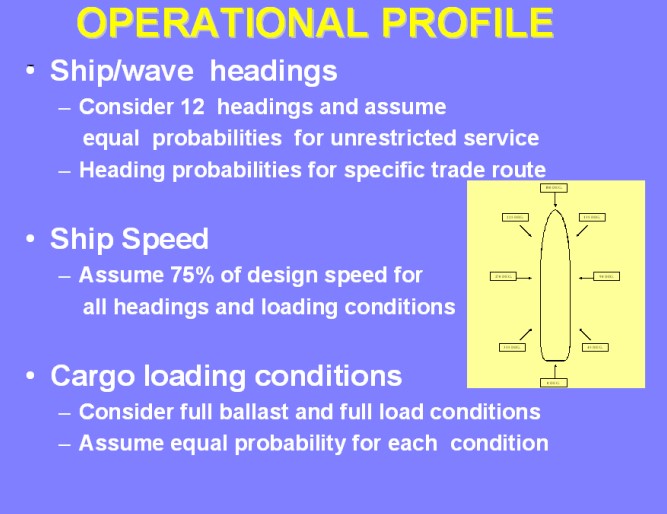
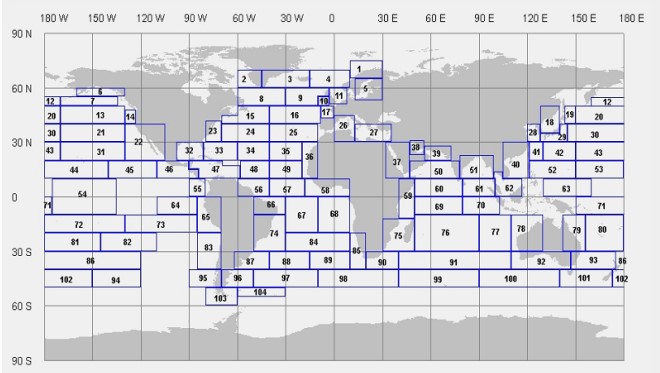
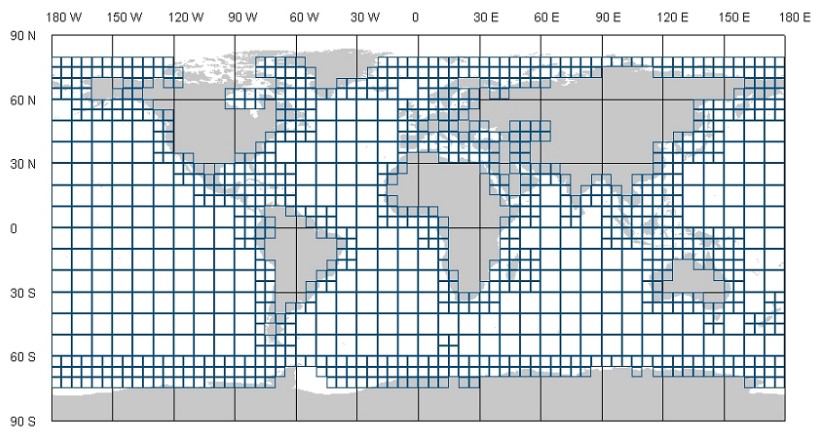
Figure 28 defines the environmental and cargo loading conditions, while slides 29 and 30 indicate the typical wave grid data used for the evaluation versus the typical wave data grid used by ABS.
The difference between the criteria used for fatigue assessment with SAFEHULL and SFA analysis are indicated in Figure 31.
Figures from 32 through 41 show the screening and zooming process for the assessment of the fatigue life of the selected details.
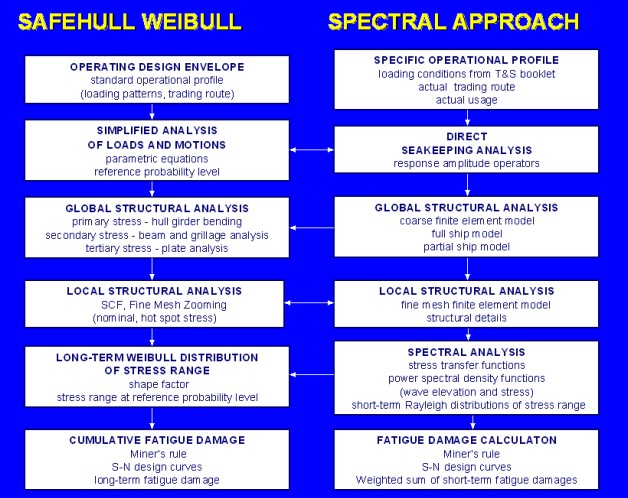
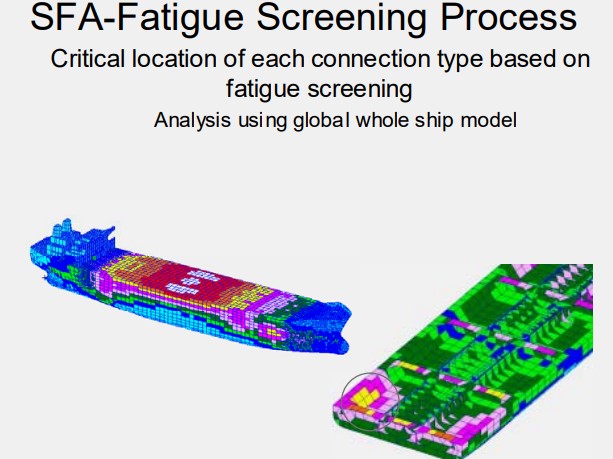
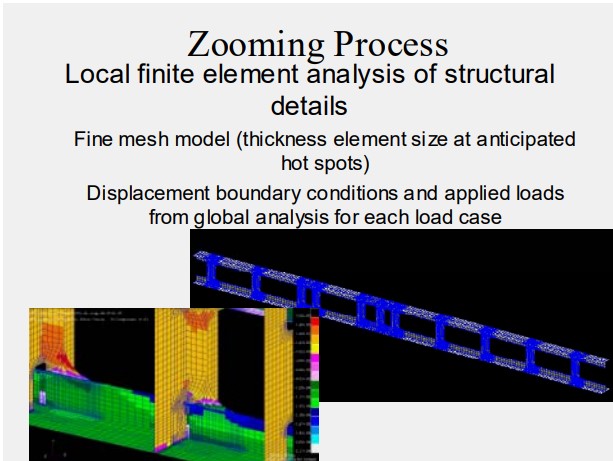
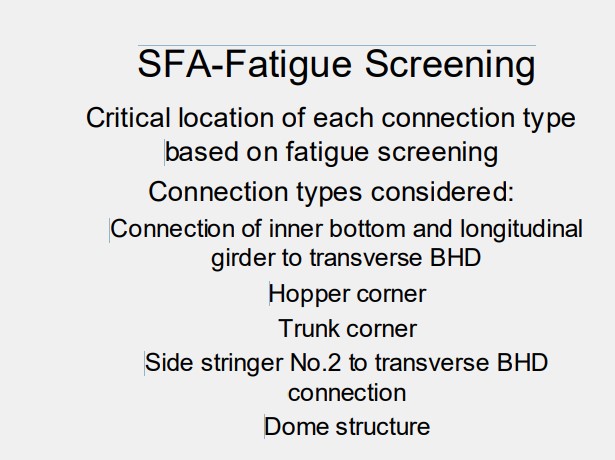
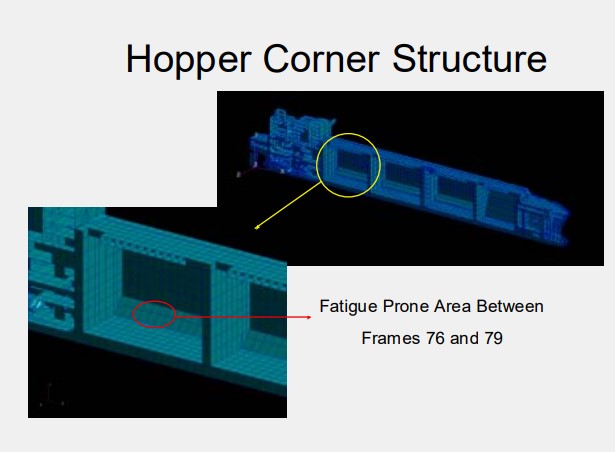
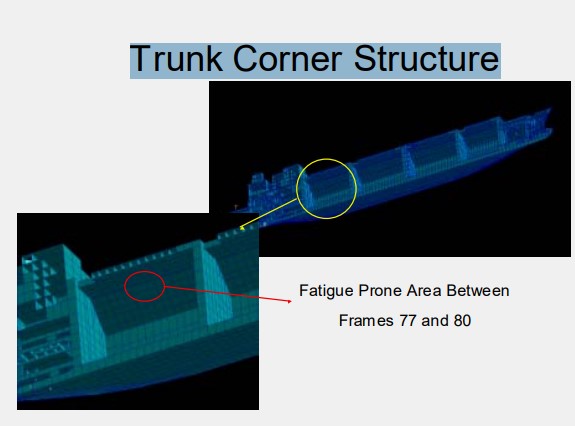
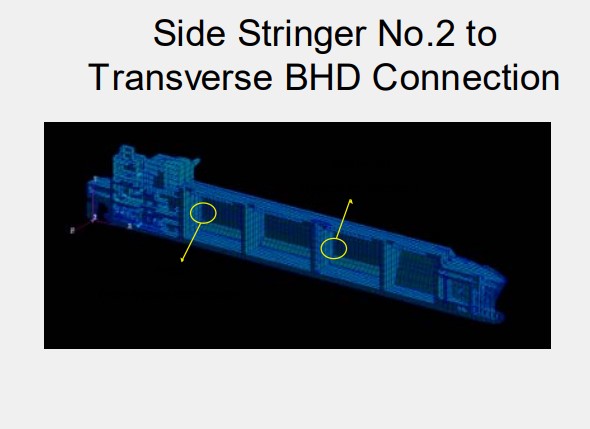
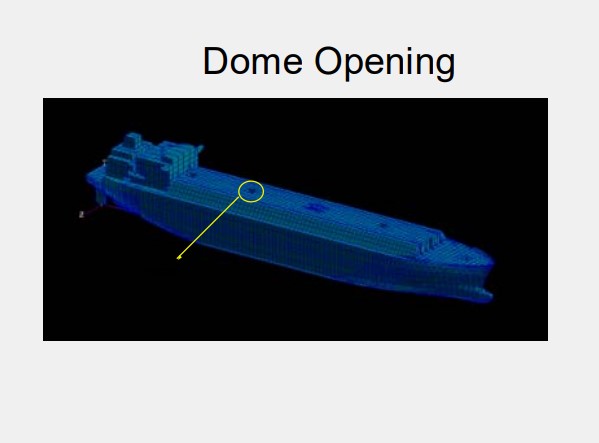
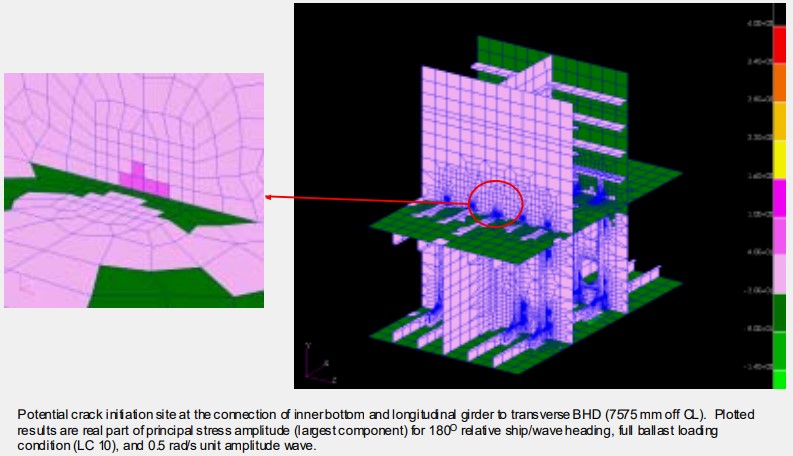
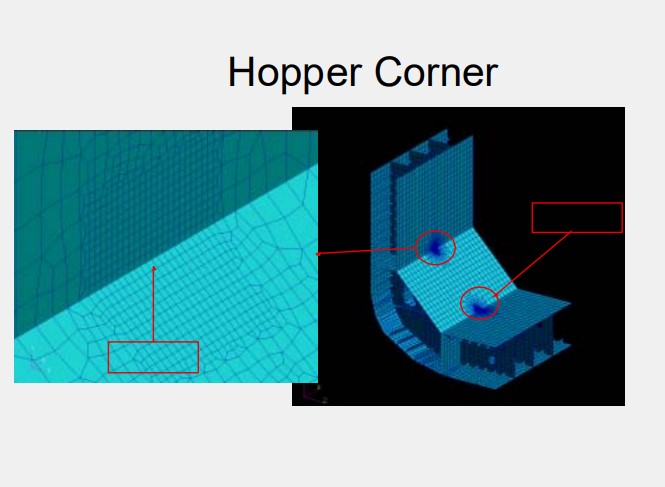
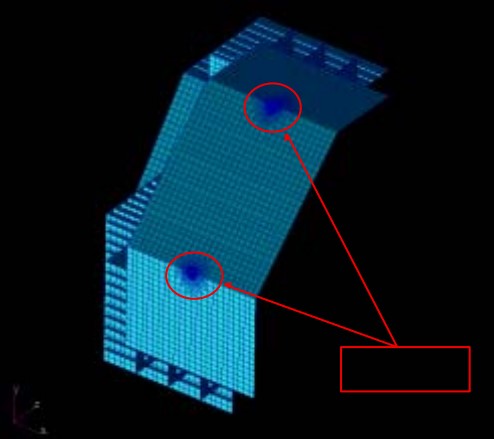
Figure 43 shows the calculation of the hot spot stresses.
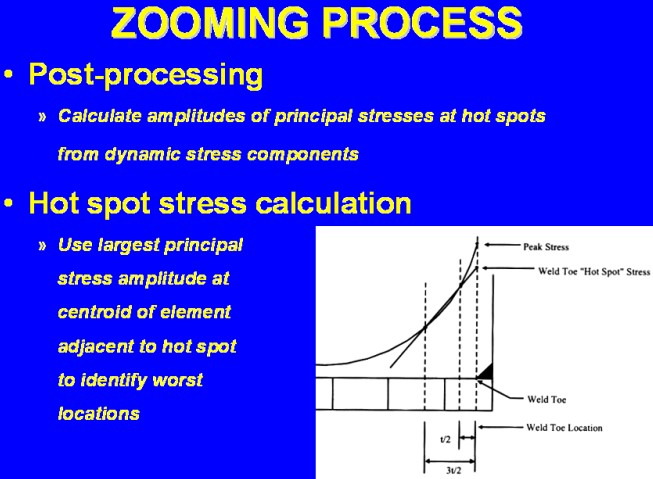
Figure 44 shows typical results of SFA.
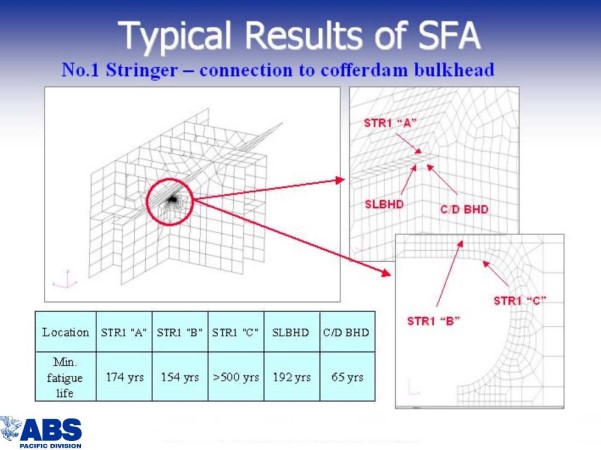
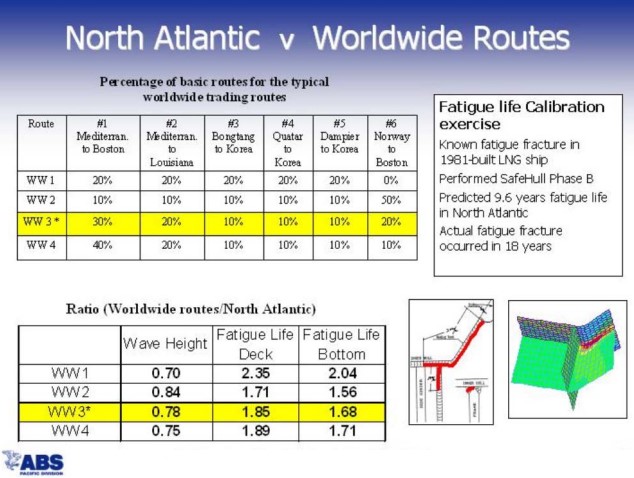
Figure 45 shows how fatigue life is calibrated.
DLA/SFA for Moss-Rosenberg Ship
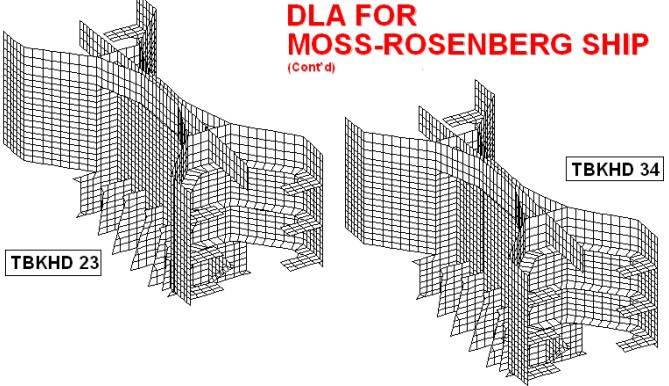
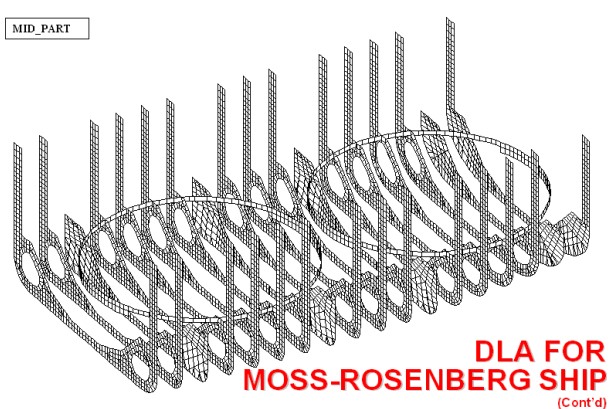
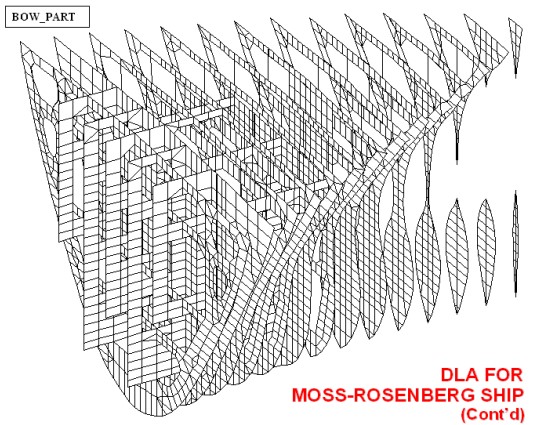
SAFEHULL is not available for Moss-Rosenberg ships. In order to analyze these ships it is necessary to use the DLA and SFA approach. The following slides refer to the Steel Fracture Modes & Hull Structural Analysis of LNGDLA and SFA analysis carried out by ABS on the project of a 145 000 m3 Moss-Rosenberg LNGC.
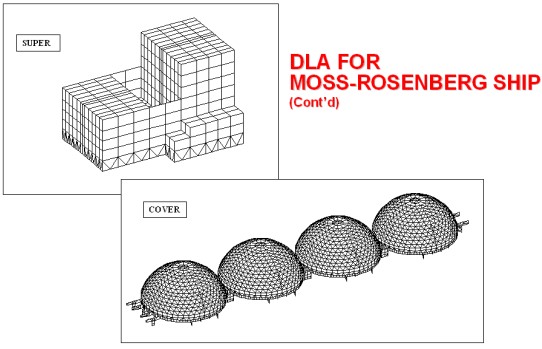
Figures 46 through 50 show some details of the model mesh used for the analysis.
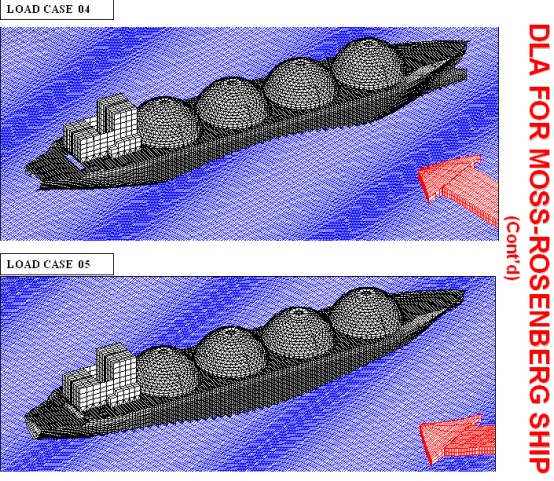
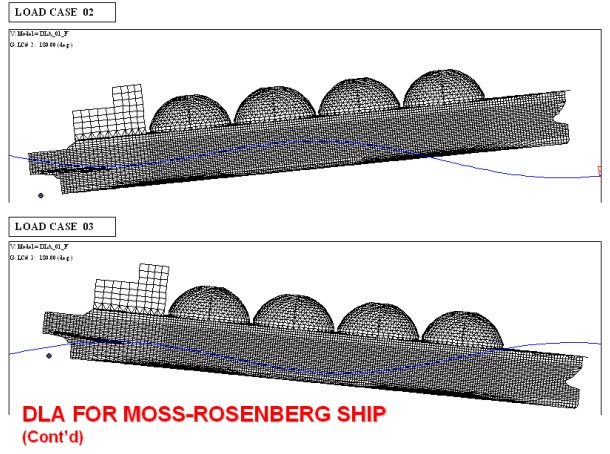
Figures 51 through 53 show the ship model on the selected wave model as well as the ship behavior in rough sea.
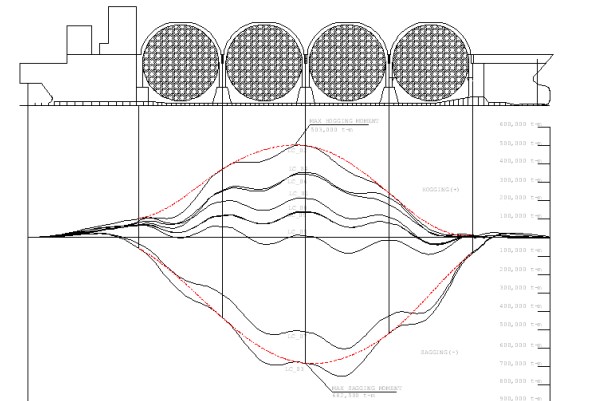
Figures 54 and 55 show the pressure distribution on the sides of the model and the calculated hull girder bending moments.
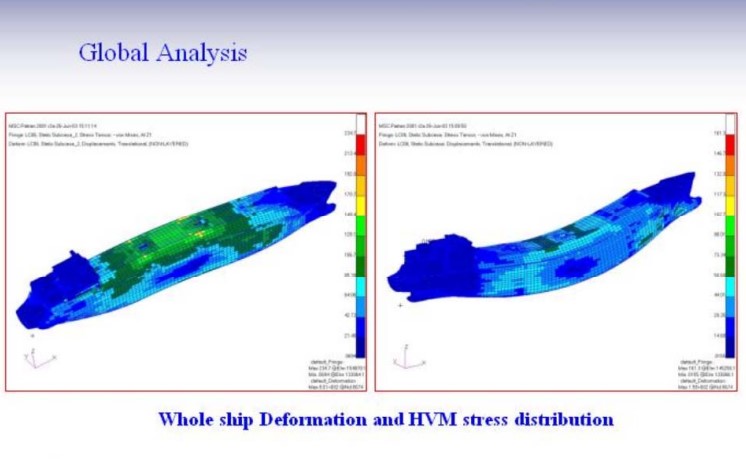
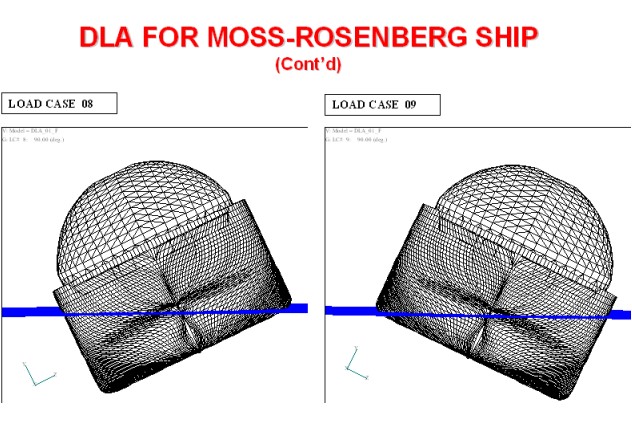
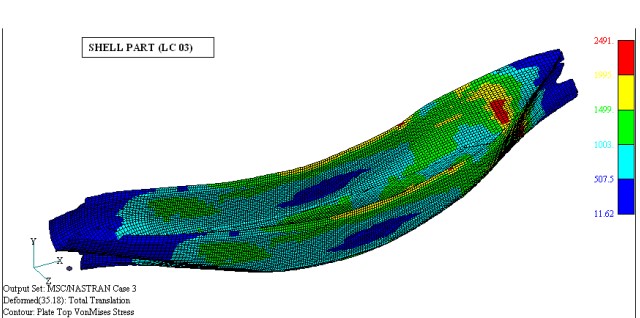
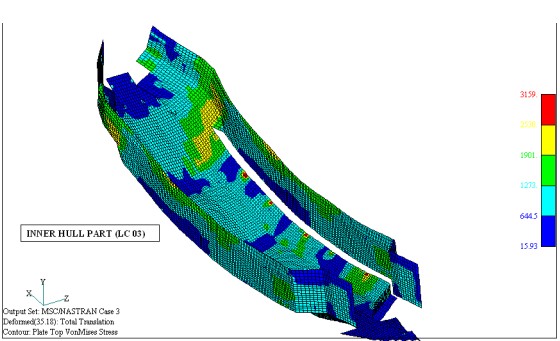
Next 8 figures (56-63) show examples of deflection and stress distribution of the whole hull and some selected parts in various loading conditions.
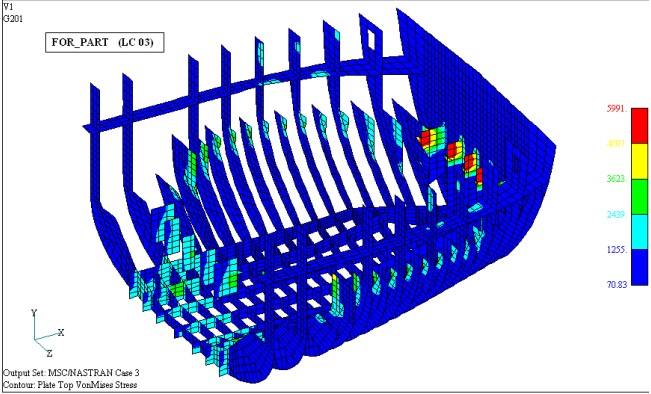
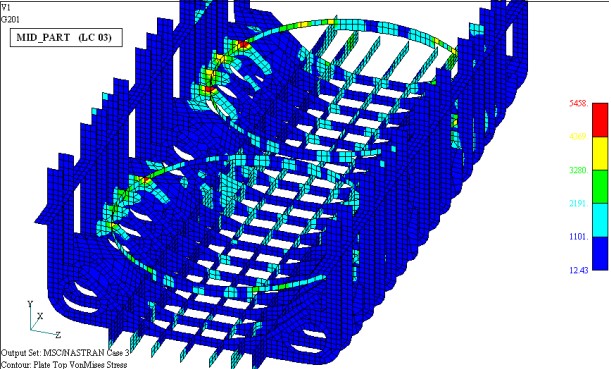
Finally, figures 64 and 65 show an example of the zooming process on the high stressed area at the connection between the deck covering and the deck.
DLA for SBP Ships
Figures 66 and 67 show the models for a SPB FPSO and for the concept design of a large SPB ship.
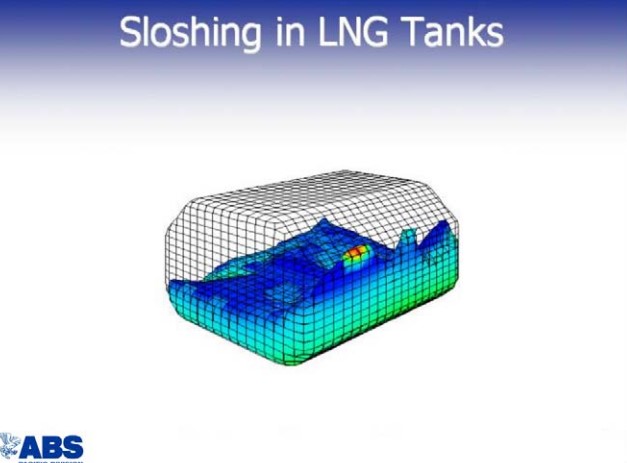
Sloshing
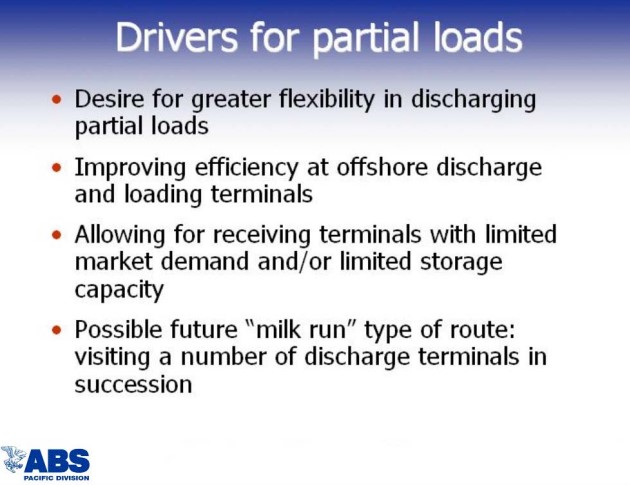
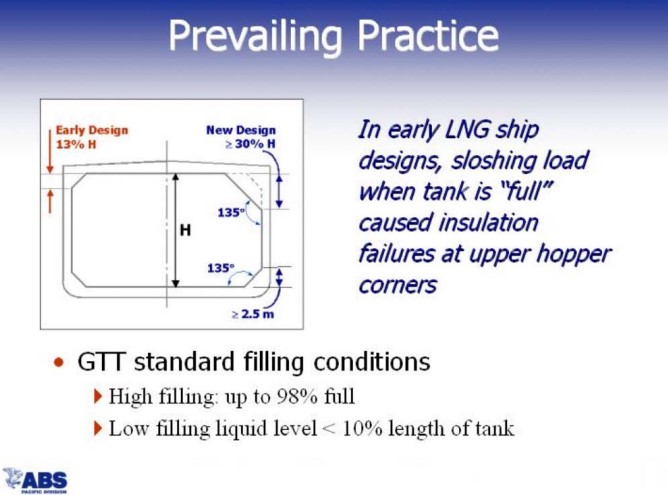
Sloshing, especially on membrane ships, is a major problem. The major classification Societies are strongly competing to offer to the analysis more and more realistic and reliable, as this is one of the point that will be considered to assign the classes of the new generation larger LNGC’s. ABS has the capability to perform very sophisticated and realistic analysis of sloshing. Figure 68 summarizes the reason for which partial load is requested and figure 69 the main concern of partial loading.
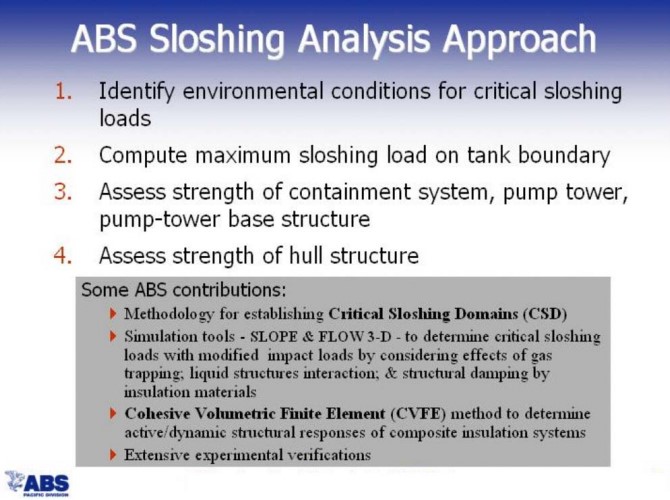
Figures 70 and 71 describe the ABS approach and contribution to the sloshing problem.
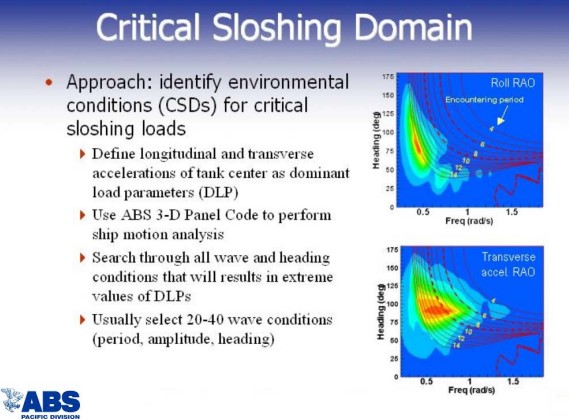
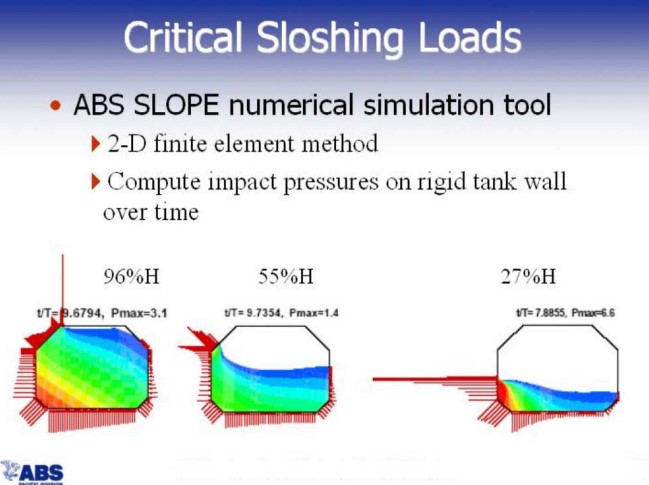
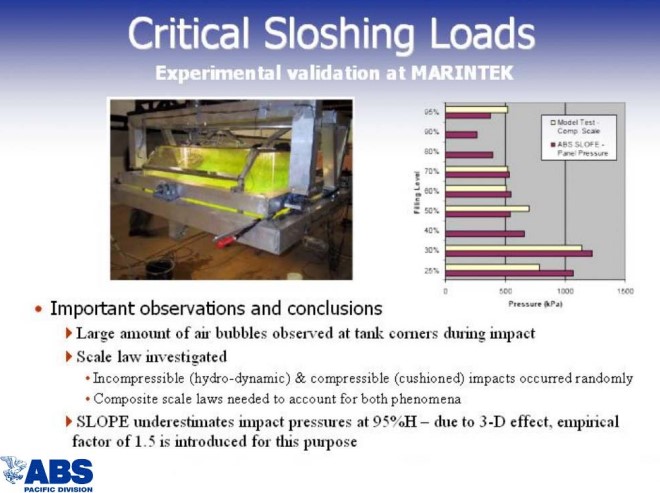
Figures 72 through 74 describe ABS technical approach and the conclusions at this date on the sloshing problem.
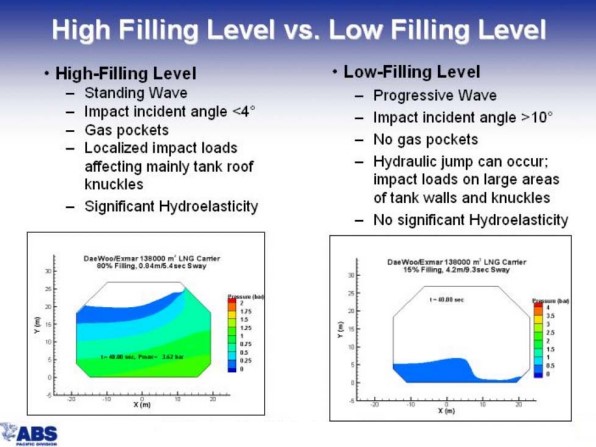
Finally, figure 75 focuses characteristics and problems of high filling limits versus low filling limits.
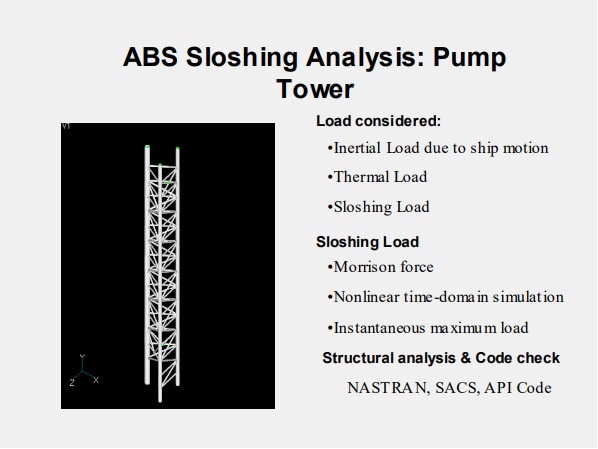
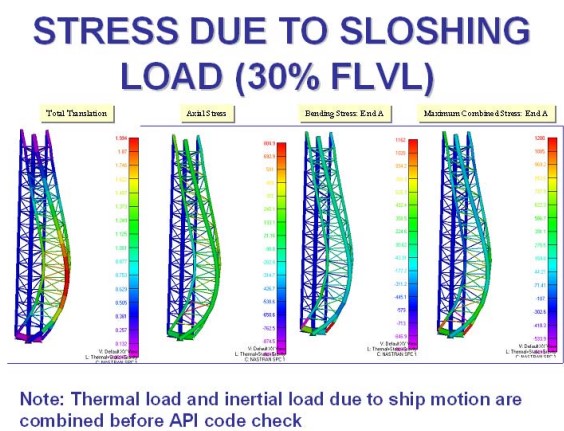
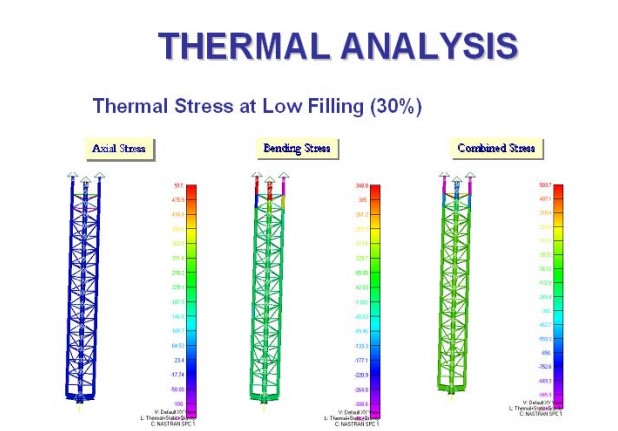
Pump Tower Strength Assessment
Figures 76 to 78 are relative to the verification of the strength of the pump tower against the loads imposed by sloshing and the thermal loads.
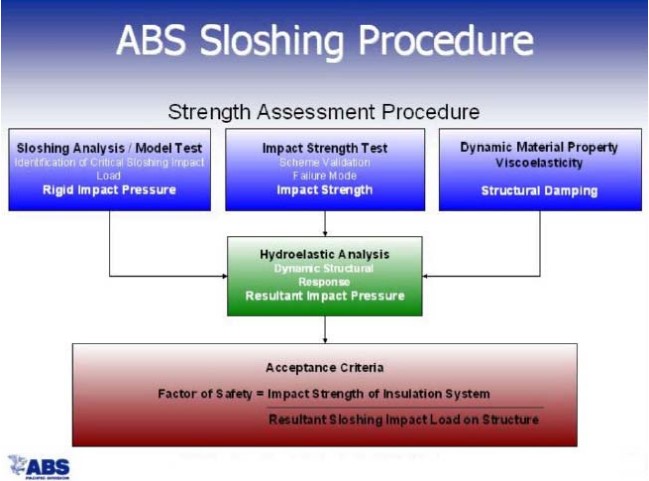
Insulation Strength Assessment
In general, insulation/membrane systems for today’s standard LNG carriers (up to about 145 0000 m3 capacity) are quite well established and the experience of these systems is satisfactory. However, there is the concern whether the strength of these systems is also suitable for the next generation of larger LNG carriers.
For this reason, the assessment of the strength of the insulation system of the largest ships against the static, dynamic and sloshing loads is today a very important issue.
Figure 79 lists the data to be taken into account to verify the strength of the insulation / membrane system of a LNG carrier.

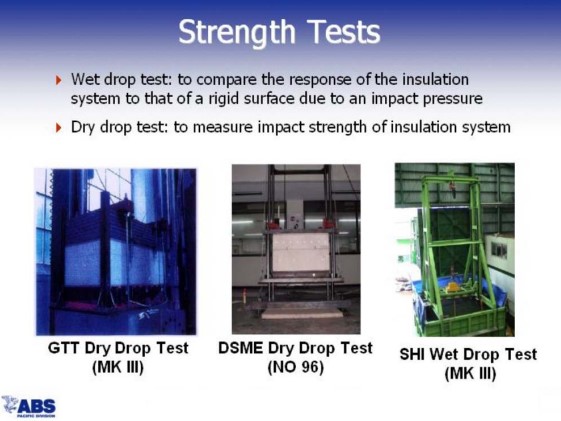
Figure 80 shows wet and dry drop test on NO.96 and MARK III insulation simple samples. Dry test measures the impact strength of the insulation system. Wet test gives the actual response of the hull structures to the cargo loads transmitted through the non-rigid insulation.
Figures 82, 83 and 84 show the actual stress dumping through the insulation.
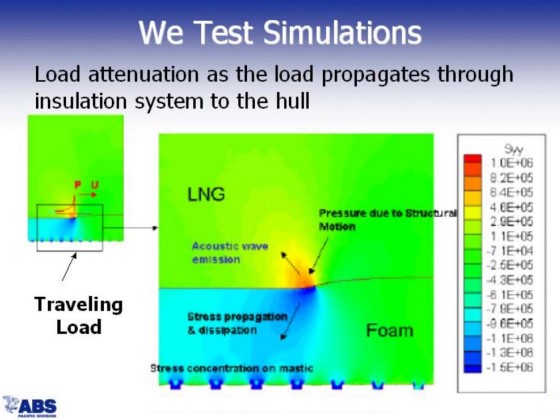
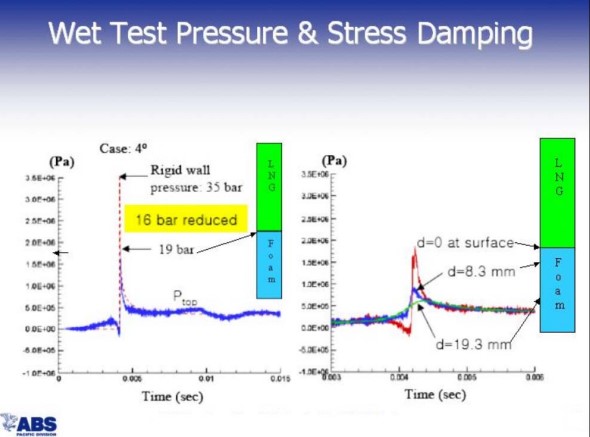
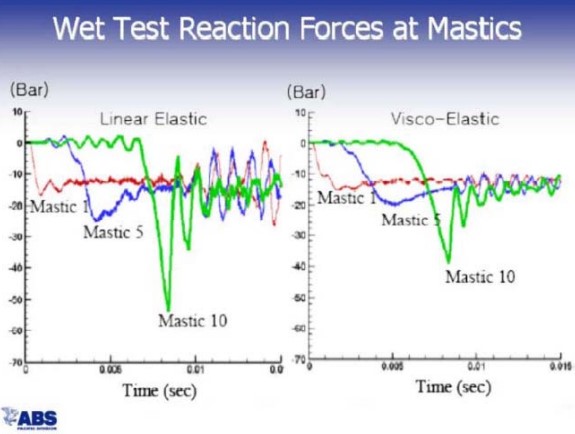
Figure 85 shows some self-explanatory conclusions.
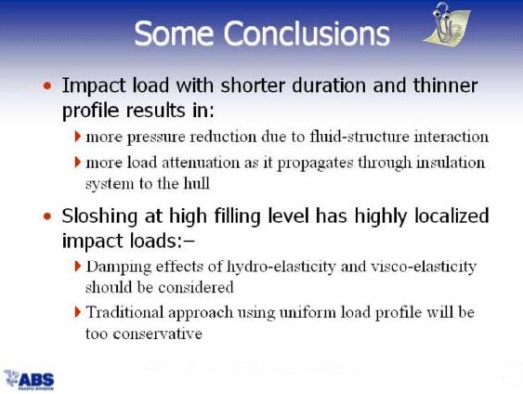
Figure 86 shows MARK III system failure mode.

Figure 87 shows how the safety factor is assessed.