This article mainly focuses on the fatigue assessment of the structural details specific to the large LPG carriers with prismatic tanks.
- Summary
- Introduction
- Description of the studied ship
- Calculation procedures
- Coarse mesh model
- Load cases
- Fine mesh model
- Assessment of the supports & keys
- Fatigue analysis methodology
- Fatigue methodology
- Damage calculation
- Welded joints
- Non welded areas
- FEM models for fatigue
- Vertical supply assessment
- Anti-rolling keys assessment
- Conclusions
- Authors
Summary
In a first step, are described the method of structural assessment of the hull and the independent tanks of LPG carriers. In a second step, are described more specifically the methodologies developed for the fatigue assessment of structural details specific to LPG carriers, and more particularly to the supports and keys. The paper also integrates the return of experience and mention practical solutions to enhance the fatigue of critical details.
Introduction
The world fleet of Liquefied Petroleum Gas (LPG) tankers is more than 1 000 vessels. This fleet of LPG carriers consists of a large range of ships, different in size, design, and cargo capability. The type of ships ranges from the coastal fully pressurised butane and propane tankers to the very large fully refrigerated tankers of more than 80 000 m3, involved on long trade traffic. They include more sophisticated small and medium size tankers, semi pressurised and fully refrigerated, able to carry a wide range of products such as ethylene or chemical gases, in addition to the current LPG products.
The purpose of this article is to focus on the segment of large LPG carriers designed with atmospheric type A cargo tanks, in accordance with the definition of the IMO IGC code and to focus on the fatigue assessment of the particular structural details for the hull and containment system of this type of ship.
For memory, there are about 100 VLCG on operation worldwide.
In accordance with ICG code, independent type A cargo tanks are self-supporting tanks designed using recognised ship structural analysis procedures. They are usually gravity tanks made of plane surface and their design vapour pressure is limited to a maximum of 0,7 bars.
The independent type A cargo tanks are required to be duplicated with a complete secondary containment system (secondary barrier) able to preserve the integrity of the ship structure in case of leakage of the cargo tanks and to safely keep the cryogenic cargo into the ship within 15 days.
Read also: The Liquefied Gas Tanker types
Calculation tools implemented by shipyards, design offices and classification societies have largely progressed since the first large independent type A LPG carrier was built in the early 70s. FEM analysis tools and methodologies for fatigue assessment have been more and more user friendly, easier and faster to run and as a consequence, more and more frequently used.
On the other hand, the latest designs include more and more high tensile steel:
Re = 355 MPa,
which makes the structure more critical from a fatigue point of view, and which makes the fatigue assessment more and more necessary, for the design review of VLCG.
BUREAU VERITAS has developed in his rules a notation “VeriSTAR Hull DFL XX years”, with XX is taken between 25 and 40 years, which may be granted to ship subject to the analysis described in this article.
This article aims at showing by example how the methodology was applied on an actual case of an 84 000 m3 LPG carrier project, recently built under BV classification.
Description of the studied ship
The ship subject of the fatigue assessment is a recently built VLCG with a capacity of 84 000 m3. The ship is fitted with four independent cargo tanks on the length. The design is fitted with double bottom and single side as shown figure 1 on the typical midship section.
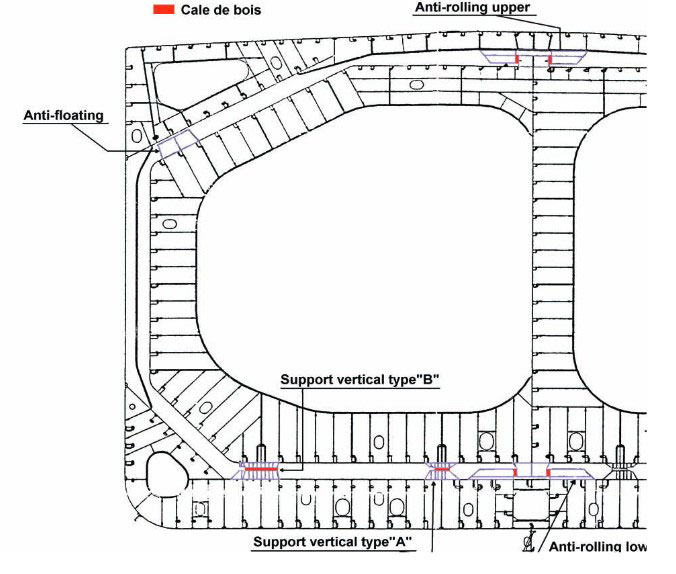
The independent tanks are supported and maintained in position within the ship’s hold tanks with various types of supports and keys.
Cargo tank supports and keys are to be designed and built to:
- Insulate the cargo tank in order to insure an acceptable boil off rate and to avoid that the temperature of the ship structure in way of the supports & keys is lowered below the values allowed for the steel used.
- Transmit to the hull structure the loads corresponding to the weight supplemented by the dynamic effects due to the ship motions while limiting the stress concentrations in both the hull and the cargo tank.
- Allow free contraction due to temperature and free displacement between the cargo tank and the hold due to the wave.
The various type of supports and keys, generally fitted with wooden chocks, are:
- Four rows of vertical supports are located in way of the transverse frame aim at transferring the weight of the tank and cargo to the hull. They are currently different types of such supports able to sustain loads of various ranges from about 400 t to 1 000 t. Those fitted in the corner of the cargo tank are generally the more loaded.
- Anti-rolling keys, preventing from lateral motion of the cargo tanks, are fitted along the centre line, both in way of the upper and lower parts of the cargo tank.
- Anti-pitching keys, preventing from longitudinal motion of the cargo tanks, are fitted along the transverse line of the cargo tank. They are located at mid span of the cargo tank, generally only in the lower part of the cargo hold. They are also used as anti-collision keys.
- Two rows of anti flotation keys, preventing from lifting of the cargo tank in case of flooding of the cargo hold are located on the top of the cargo tank on each side.
Calculation procedures
The analysis has been performed with VeriSTAR hull software, developed by BUREAU VERITAS. This computer program has already been subject to several papers. It is a powerful integrated finite element analysis software enabling automatic generation and loading of the model with respect to BUREAU VERITAS rule requirements.
It includes facilities to perform local refined analyses and fatigue assessment of typical structural details from coarse mesh models.
Coarse mesh model
The main objectives of the coarse mesh analysis are:
- To determine the stress distribution in the primary supporting members of the cargo tank and the ship structures;
- To determine the forces in the keys supporting the tanks;
- To verify that the yielding and buckling strength criteria as given in Rules for the Classification of Steel Ships are complied with;
- To determine, where necessary, the relevant boundary conditions for finer mesh analyses of the highly stressed areas.
As the reaction forces in the supports and keys depends on the stiffness of the ship hull and the stiffness of the cargo tank, the global coarse mesh model is to include both the ship hull and the cargo tank.
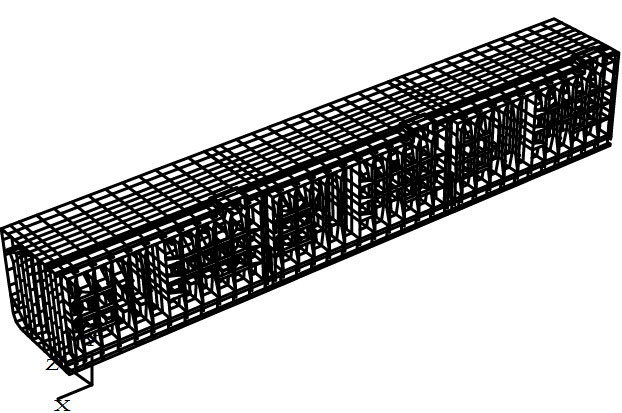
According to VeriSTAR calculation, the model is to be extended over three cargo tanks. As the structure is generally not symmetrical, both sides are to be modelled.
The Figure 2 shows a three cargo tank typical VeriSTAR model (half of the model).
The model integrates supports and keys modelled by beams or springs elements having the stiffness of the structure. Different methodologies are used to evaluate the stiffness of the supports and keys.
In the results of the coarse mesh model, the elements modelling the supports found in tension are deleted. Only the elements in compression are kept.
Load cases
For the yielding and buckling analysis, the internal load cases take into account the following internal load cases:
- Full load;
- Ballast;
- Alternate load case;
- Non symmetrical case;
- Damage case tank empty hold flooded.
The fatigue analysis is based mainly on full load and ballast load cases.
The internal load cases are combined with external sea conditions:
- Crest of wave head sea;
- Through of wave beam sea;
- Maximum internal acceleration;
- Beam sea external dynamic;
- Beam sea maximum acceleration.
Fine mesh model
Beyond the 3D coarse mesh analysis, several refined analysis are carried out on the basis of 3D fine mesh models, namely:
- Cargo tank web frames and strings;
- Hold typical bottom transverses, bottom girders, transverse bulkhead.
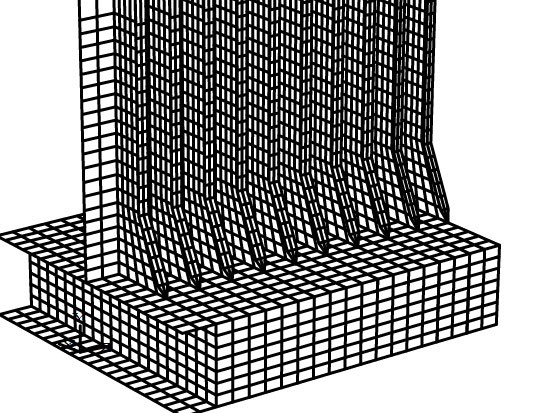
The standard size of elements used for fine meshes is based on the spacing between secondary stiffeners. Displacements from the coarse mesh model are applied as boundary conditions to the fine mesh model. The pressure loads and local forces are applied on the fine mesh model. An example of a fine mesh model of the foot of the transverse bulkhead is shown on the Figure 3 below.
Assessment of the supports & keys
Each type of supports has been subjected to a detailed FEM analysis. The structural elements surrounding the supports have been analysed on both sides (cargo tank side and hull side).
The typical size of the current finite element edge is based on a quarter of a longitudinal spacing.
The Figures 4a and 4b show the two fine mesh models for the assessment of a typical vertical support.


The loads from the coarse mesh are applied on the support, and the friction force is added in longitudinal and transversal directions, as shown Figure 5.
Fatigue analysis methodology
In the early 1980s, this methodology was introduced with the purpose to assure that the seagoing ships could respect a fatigue life of 20 years, in North Atlantic sea conditions, with a cumulative damage ratio of 1, taking into account the SN curve at minus two standard deviations.
These ships were verified by considering mainly two draughts; full and ballast loading cases. At that time, a guidance notes for fatigue assessment was developed.
The IACS recommendation No. 56 was published in 1999.
Fatigue assessment became mandatory, for ships more than 170 m in length, in 2000.
Fatigue methodology
Different approaches for fatigue analysis are available in BV rules.
For the case of the LPG carriers, the deterministic methodology was used, calibrated on a hydrodynamic analysis.
The stress ranges are calculated based on loads at a probability level of 10-5. The loads take into account the hull girder ending moment and shear forces, the wave pressure on the shell and the internal tank pressure due to the accelerations, which are taken from rule formula.
The distribution of long term stress range assuming a Weibull distribution, and rule formula are used to define the shape parameter.
The deterministic methodology has been calibrated using the spectral methodology, described hereafter, as well as return of experience.
Damage calculation
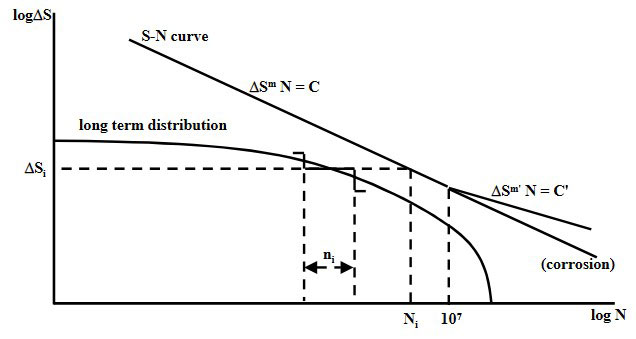
In spite of the critics, the only usable damage calculation method for marine structures design is the Miner sum. The method is based on a linear fatigue damage accumulation from a stair representation of the stress long term distribution.
An illustration is given on Figure 6 and the failure criteria is:
where γ is the partial safety coefficient which take into account the uncertainties of the Miner sum, as the value 1 is a mean value at failure of samples.
To take into account the welding and/or post-weld treatment conditions, Bureau Veritas decided to use the local stress where the crack is expected to occur.
Welded joints
For welded joints the stress range used is the notch stress range, i. e., taking into account the local geometry plus weld toe stress concentration (hot spot stress plus notch effect).
This stress range is associated with a unique typical basic material S-N curve with a stress range power m = 3 to respect the weld joint sample test results:
This curve is applicable to any steel, mild or high strength, used for floating unit structures.
For normal design this design S-N curve is a curve at 2 standard deviations in log(C) below the mean curve. When the structural component is efficiently protected against corrosion a change of m, from 3 to 5, is introduced at N = 107 to take into account for the influence of the fatigue limit associated to stress range randomness on the long term Miner sum. When the component is not protected, i. e., is submitted to a free corrosion in Gas Tank Environmental Controlmarine environment, the S-N curve constant C is divided by 2 and the S-N curve is continuous without any change of m.
For normal design and as-welded joints, where the maximum and minimum stress level are not exceeding the yield strength, the influence of the static stress is considered deleted by the welding residual stresses. When extreme stress levels exceed the yield strength particular corrections are necessary and determined case by case.
But when post-weld treatments are applied, the weld toe shape and the welding residual stresses are modified. Versus the applied technique the notch concentration factor has to be adjusted, but also the S-N curve power m may have to be changed.
For example grinding only requires modifying the notch concentration factor when refusion TIG requires to modify both notch concentration factor and power m values.
Non welded areas
Hot spots exist also on weld plate edges that are not welded and the return experience show that cracks can be observed in such areas (Figure 7).
In such case there is no more welding residual stresses. The static stress level defined by the R ratio:
R = Smin/Smax,
influences the S-N curve to be used for the Miner sum calculation. Test results show that the m value and the position of the S-N curve are function of R for N > 104 but that for N < 104 there is no influence, the S-N curve being the same than for R = -1 (see Figure 7).

The Miner sum is therefore calculated with the hot spot stress range associated with a S-N curve determined versus the value of R. These curves allow to take into account for stress extremes greater than the yield strength after correction using the material stress-strain curve.
FEM models for fatigue
The fine mesh models for the fatigue assessment have a mesh size of the order of magnitude of the plating thickness.
The following structural connections of VLCG are candidates to fatigue assessment:
- Foot of main frames of side shell;
- Side shell longitudinals with transverse webs;
- Knuckles between double bottom & hopper tank;
- Brackets in cargo tank;
- Supports and keys;
- Tank dome.
Most of the structural details in the above list are similar to other vessels. But the support and keys are typical of VLCG. We are going to focus on these structural members in Design and Operation of LPG Ships this category.
Vertical supply assessment
Generally, the fatigue calculations are based on the assumption of continuity and linearity of the phenomena. In case of the supports, there are discontinuities and non-linearity of the forces due to the friction, sliding and shifting of the cargo tanks on the supports. It is due to this behaviour that a specific methodology was developed.
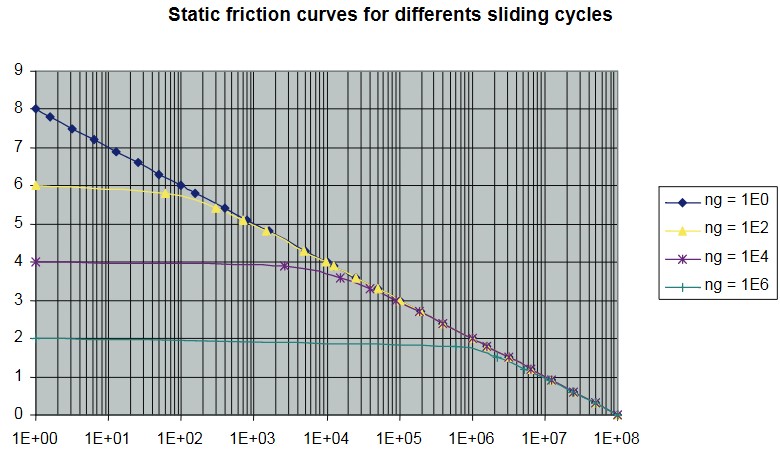
As there are two friction coefficients, the static and the dynamic friction coefficients, the friction coefficient changes when the sliding appears.
The right side of the histogram is linked to the static coefficient, and the left hand side is linked to the dynamic coefficient.

The probability level “p” where the sliding appears depends on the position of the studied support.
The histogram is to be continuous. Consequently, it is necessary to modify the histogram, to obtain a continuous function of the number of cycle. This modified histogram is shown on the Figure 9. The different histograms of sliding distribution are given for different probability of “p”.
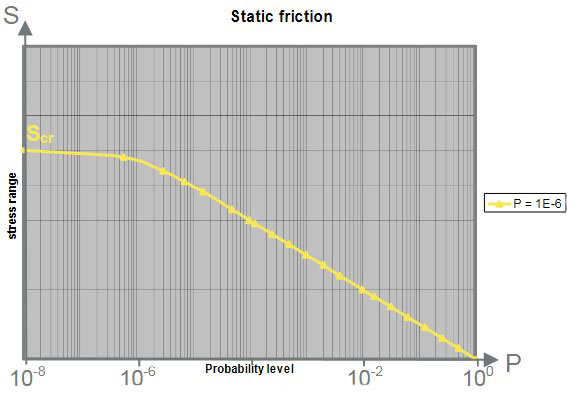
An alternative to the unique histogram of friction force is to divide the histogram in two parts. Figure 10, shows the histogram of the friction force, when there is no sliding. The histogram of the friction force with sliding is shown Figure 11.
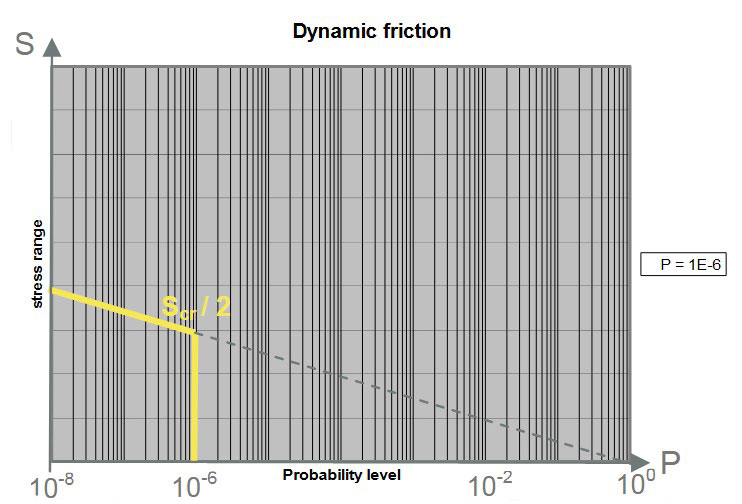
Then two fatigue calculation are carried out and the damage ratio combined.
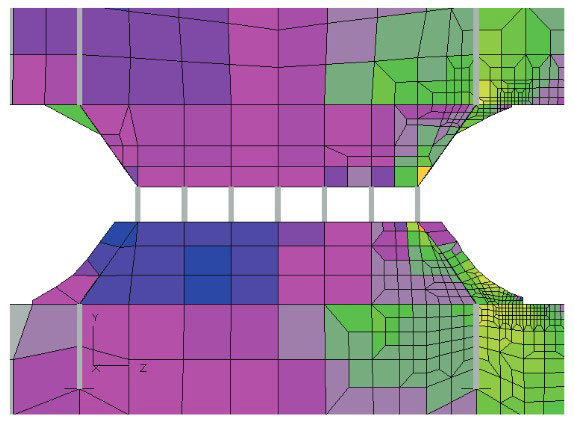
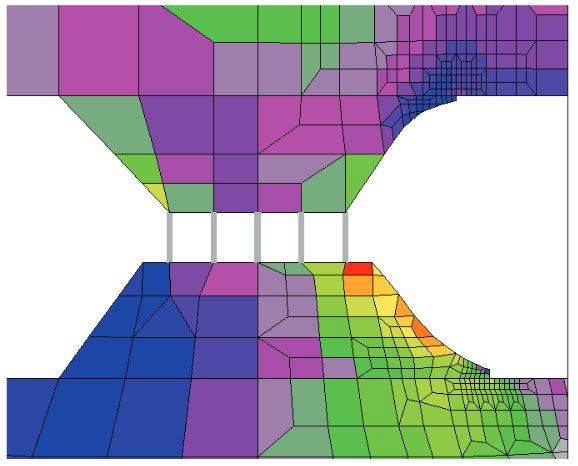
The applied methodology for the fatigue assessment of the support is composed on the following steps, for the cases full load:
- Step 1: The coarse mesh and fine mesh models are calculated assuming the supports merged, i. e. there is no sliding, as shown on the Figures 12 & 13. The part of the support in way of the tank is connected with the part in way of the hull in one unique model.
- Step 2: Taking into account the results of the coarse mesh with merged supports, the probability level “p” where the sliding appears is evaluated.
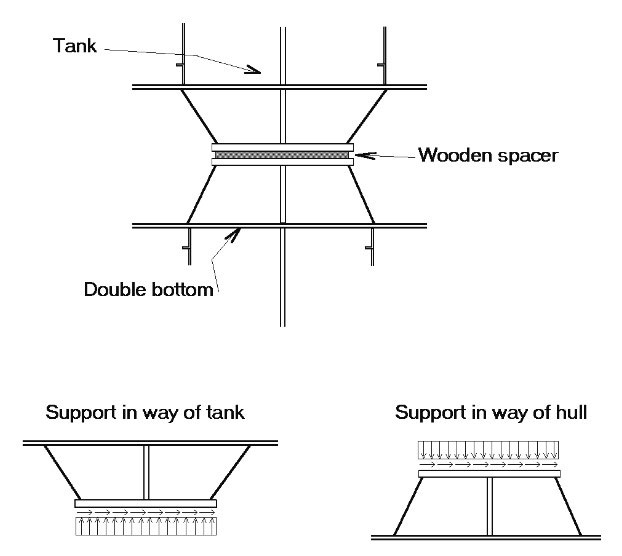
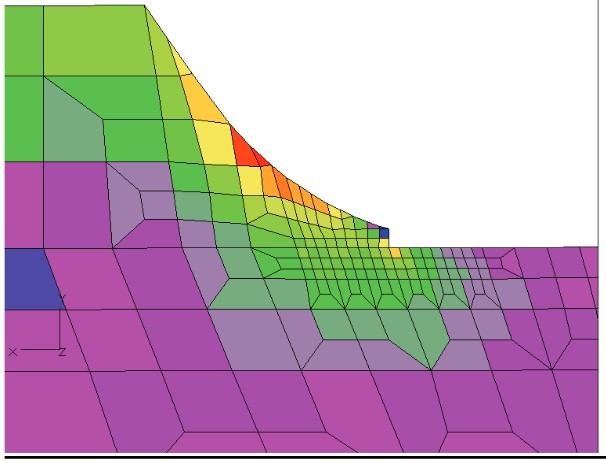
- Step 3: The supports is calculated in two separates models, with the friction force input. The part of the support in way of the hull and the part of the support in way of the cargo tank are calculated separately. The model of the part of the support in way of the hull is shown on the Figure 14. The friction force is introduced in way of the wooden spacer, both in the longitudinal and transversal directions, in two separate load cases.
- Step 4: The damages ratio obtained in the conditions of the step 1 with the histogram shown on figure 10 and the damage ratio obtained in the condition of the step 3 with the histogram of the figure 11 are combined to obtain the final damage ratio.
For the cases in ballast conditions, the damage ratio is calculated with only the self weight of the cargo tank. As in this case, most of the supports are found in tension in coarse mesh model, most of the elements modelling the supports are disconnected. For the calculation of this disconnected supports in the fine mesh model, the damage ratio is calculated as for the step 3, i. e. with the support in two parts.
Anti-rolling keys assessment
The methodology for the fatigue assessment of the anti-rolling keys is very different from the methodology for the vertical supports, due to the fact that there is a gap between the keys. This gap has a significant influence on the fatigue life and is to be taken into account in the fatigue calculation. The figure 15 shows the gap.

Due to this gap, the calculation is not linear. Then the methodology for the fatigue assessment includes the following steps:
- Step 1: The coarse mesh and fine mesh models are run without contact in the upper anti-rolling key in ballast and full load conditions. The deflection at the probability level depending on the probability level. The damage ratio is calculated in the critical elements of the keys.
- Step 2: The probability level where there is contact of the anti-rolling key is calculated.
- Step 3: The calculation is run with anti-rolling keys merged. The damage ratio is calculated in the critical elements of the keys.
- Step 4: The damage is calculated by combining the damage ratio obtained.
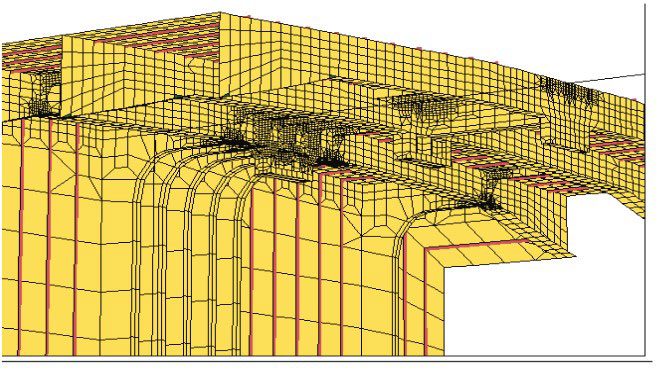
The Figure 16 shows an example of fine mesh for the fatigue assessment of the anti-rolling keys.
Conclusions
Due to the use of structural scantling optimisation by computing and the use of high tensile steels, fatigue cracking has become one of the major failure modes in ship structures.
It has to be pointed out however that the observed failures in service are generally found on ships which have not had their design details verified for fatigue before construction.
Today the requirements to assess fatigue is included in classification society rules, but the application to structural members and support keys of LPG carriers is not easy due to the non-linearity and sliding of these particular structures. This article has demonstrated a methodology for this type of assessment and is published in the revision 2 of the BV Guidance Note for Structural Assessment of LPG Carriers.
The methodology was applied to the case of a VLGC built recently and it lead to structural improvements being carried out such as Thickness increase, additional grinding of welds, improved design of brackets… etc.
The accumulated experience of Bureau Veritas allows us to help ship designers to improve the fatigue strength of hull structures and to help and guide owners to understand what is happening when they observe fatigue cracks in service. It allows for the development of more efficient inspection plans and the proposal of more effective repair solutions.
Authors

