Previous article Manual for Engineers to Calculate Amount of Gas in Reservoirs“Essential Calculations of the Gas Reservoir Performance” demonstrated that the ability of a gas reservoir to produce for a given set of reservoir conditions depends directly on the flowing bottom-hole pressure, pwf. This article will help engineers calculate gas pressure in piping system, flows in wells, pipelines and flowing temperature.
- Basic Flow Equation
- Laminar Single-Phase Flow
- Turbulent Single-Phase Flow
- Flow in Wells
- Static Bottom-Hole Pressure
- Flowing Bottom-Hole Pressure
- Flow in Pipelines
- Pipelines in Series
- Pipelines in Parallel
- Effects of Liquids
- Well Performance
- Pipeline Performance
- Gas Flow Through Restrictions
- Use of Pressure Traverse Curves
- Liquid Removal from Gas Wells
- Minimum Flow Rate for Continuous Liquid Removal
- Liquid Removal Methods
- Erosional Velocity
- Predicting Flowing Temperatures
- Flowing Temperatures in Wells
- Flowing Temperatures in Pipelines
Picture Everything about Natural Gas in Modern Industry“Possible pressure losses in complete system” illustrates that pwf depends on the separator pressure and the configuration of the piping system; that is:
where:
- psep = separator pressure;
- Δpfl = pressure drop in the flowline;
- Δpch = pressure drop in the surface choke;
- Δptub = pressure drop in the well tubing, and;
- Δpris = pressure drop in other restrictions, such as subsurface safety valves (SSSVS), valves and fittings, etc.
In order to determine the deliverability of the total well system, it is necessary to be able to calculate all of the pressure drops listed in Equation 1. This article will develop equations to make these calculations and demonstrate their application. The effects of liquids in the flow stream will be discussed, and the use of previously prepared pressure traverse curves for quick estimates will be demonstrated. Only steady-state, one-dimensional flow will be considered in this article.
Basic Flow Equation
The theoretical basis for most fluid flow equations is the general energy equation, an expression for the balance or conservation of energy between two points in a system. The energy equation is developed first, and using thermodynamic principles, is modified to a pressure gradient equation form.
The steady-state energy balance simply states that the energy of a fluid entering a control volume, plus any shaft work done on or by the fluid, plus any heat energy added to or taken from the fluid must equal the energy leaving the control volume. Picture 1 may be used to illustrate the control volume principle.
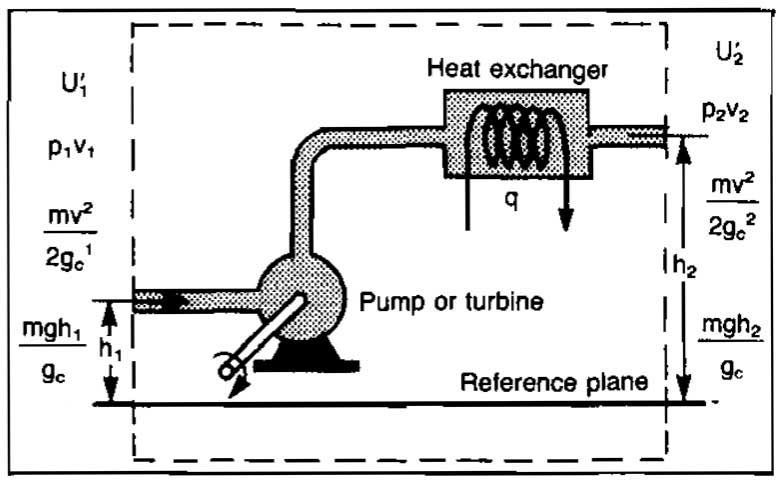
Considering a steady-state system, the energy balance may be written as:
where:
- = internal energy;
- pV = energy of expansion or compression;
- = kinetic energy;
- = potential energy;
- = heat energy added to fluid, and;
- = work done on the fluid by the surroundings.
Dividing Equation 2 by m to obtain an energy per unit mass balance and writing in differential form gives:
This form of the energy balance equation is difficult to pply because of the internal energy term, so it is usually converted to a mechanical energy balance using well-known thermodynamic relations. From thermodynamics:
and:
or:
where:
- h = enthalpy;
- S = entropy, and;
- T = temperature.
Substituting Equation 5 into Equation 3 and simplifying results in:
For an irreversible process, the Clausius inequality states that:
or:
where:
- dLw = losses due to irreversibilities, such as friction.
Using this relationship and assuming no work is done on or by the fluid, Equation 6 becomes:
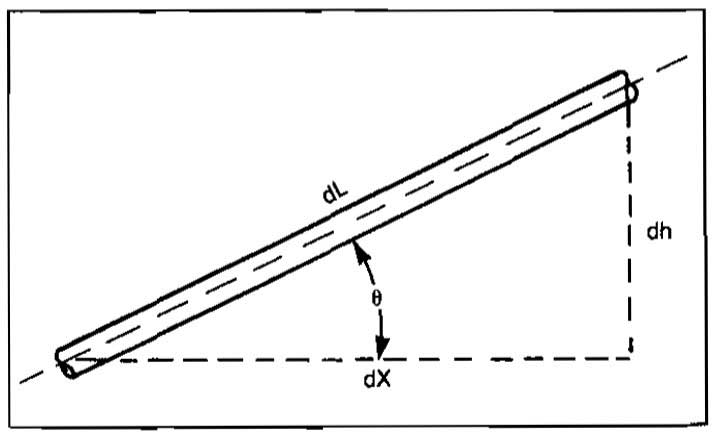
If we consider a pipe inclined at some angle θ to the horizontal, as in Picture 2, since dh = dL sinθ:
Multiplying the equation by
gives:
Equation 8 can be solved for pressure gradient, and if we consider a pressure drop as being positive in the direction of flow:
where:
is the pressure gradient due to viscous shear or friction losses.
In horizontal pipe flow the energy losses or pressure drops are caused by change in kinetic energy and friction losses only. Since most of the viscous shear occurs at the pipe wall, the ratio of wall shear stress (τw) to kinetic energy per unit volume (ρ v2/2 gc) reflects the relative importance of wall shear stress to the total losses. This ratio forms a dimensionless group and defines a friction factor.
To evaluate the wall shear stress, a force balance between pressure forces and wall shear stress can be formed. Referring to Picture 3:
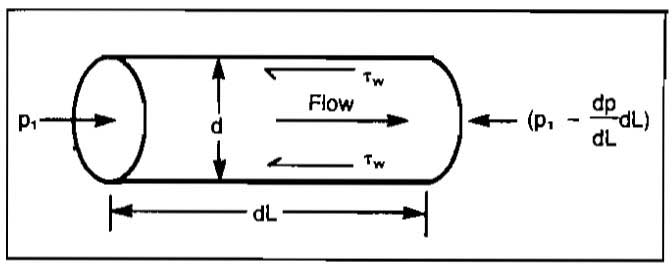
Substituting Equation 11 into Equation 10 and solving for the pressure gradient due to friction gives:
which is the well-known Fanning equation. In terms of a Darcy-Weisbach or Moody friction factor,
, and:
Laminar Single-Phase Flow
The friction factor for laminar flow can be determined analytically by combining Equation 12 with the Hagen-Poiseuille equation for laminar flow:
or:
Equating the expressions for frictional pressure gradient gives:
or:
The dimensionless group, NRe = ρvd/μ is the ratio of fluid momentum forces to viscous shear forces and is known as the Reynolds number. It is used as a parameter to distinguish between laminar and turbulent fluid flow. For engineering calculations, the dividing point between laminar and turbulent flow can be assumed to occur at a Reynolds number of 2 100 for flow in a circular pipe. Using units of lbm/ft3, ft/sec, ft and centipoise, the Reynolds number equation is:
Turbulent Single-Phase Flow
The ability to predict flow behavior under turbulent flow conditions is a direct result of extensive experimental studies of velocity profiles and pressure gradients. These studies have shown that both velocity profile and pressure gradient are very sensitive to characteristics of the pipe wall. A logical approach to defining friction factors is to begin with the simplest case, i. e., the smooth-wall pipe, proceed to the partially rough wall, and finally to the fully rough wall. Only the most accurate empirical equations available for friction factors are presented here.
Smooth-Wall Pipe. For smooth-wall pipes, several equations have been developed, each valid over different ranges of Reynolds numbers. The most commonly used equation-since it is explicit in f and also covers a wide range of Reynolds numbers (3 000<NRe<3·106) – was presented by Drew, Koo, and McAdams in 1932.
An equation proposed by Blasius may be used for Reynolds numbers up to 100 000 for smooth pipes.
Rough-Wall Pipe. The inside wall of a pipe is not normally smooth, and in turbulent flow, the roughness can have a definite effect on the friction factor, and thus the pressure gradient. Wall roughness is a function of the pipe material, the method of manufacture, and the environment to which it has been exposed.
From a microscopic sense, wall roughness is not uniform. Individual protrusions, indentations, etc. vary in height, width, length, shape, and distribution. The absolute roughness of a pipe, ∈, is the mean protruding
height of relatively uniformly distributed and sized, tightly packed sand grains that would give the same pressure gradient behavior as the actual pipe.
Dimensional analysis suggests that the effect of roughness is not due to its absolute dimensions, but rather to its dimensions relative to the inside diameter of the pipe, ∈/d. In turbulent flow, the effect of wall roughness has been found to be dependent on both the relative roughness and on the Reynolds number. If the laminar sub-layer that exists within the boundary layer is thick enough, the behavior is similar to a smooth pipe. The sublayer thickness is directly related to the Reynolds number.
Nikuradse’s famous sand grain experiments formed the basis for friction factor data from rough pipes. His correlation for fully rough-wall pipe is still the best one available. The friction factor may be calculated explicitly from:
The equation that is used as the basis for modern friction factor charts was proposed by Colebrook and White in 1939.
The friction factor cannot be extracted readily from the Colebrook equation. By rearranging the equation as follows, a trial-and-error procedure may be used to solve the equation for friction factor.
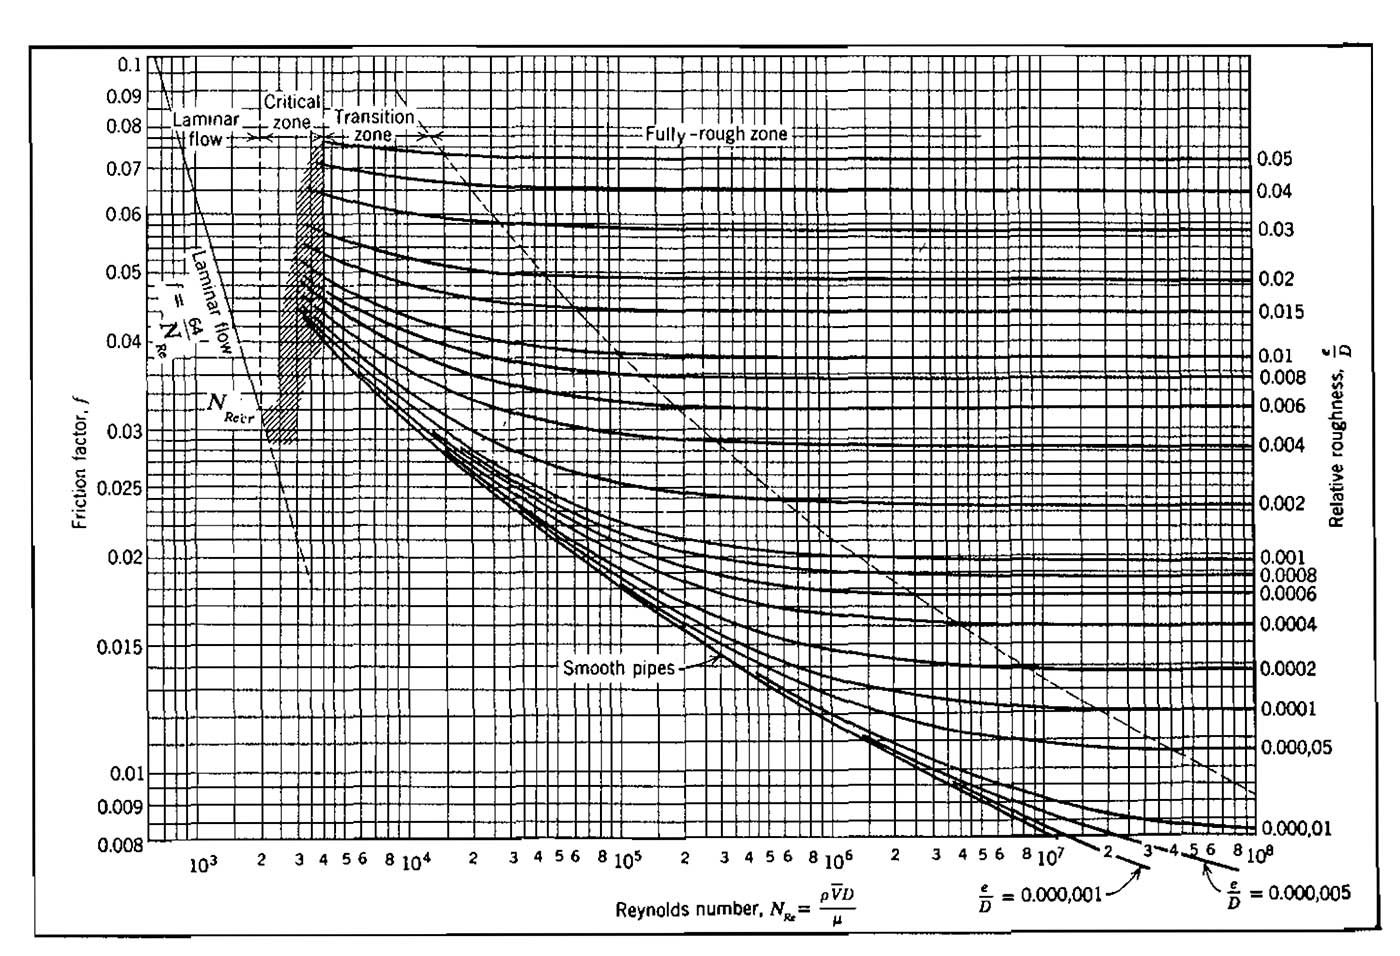
Values of fg are estimated and then fc is calculated until fg and fc agree to an acceptable tolerance. Using the Drew, Koo, and McAdams equation as an initial guess is recommended. After each unsuccessful iteration, the calculated value becomes the assumed value for the next iteration. Also, if more than one pressure loss calculation is to be made as in the case of the iterative procedures discussed in later sections, then the “converged” value of the previous calculation should be used for the initial guess in the next calculation. Convergence using this method is rapid, normally taking only two or three iterations. The variation of single-phase friction factor with Reynolds number and relative roughness is shown graphically in Picture 4.
The Colebrook equation may be applied to flow problems in the smooth, transition, and fully rough zones of turbulent flow. For large values of Reynolds number, it degenerates to the Nikuradse equation.
An explicit friction factor equation was proposed by Jain and compared in accuracy to the Colebrook equation. Jain found that for a range of relative roughness between 10-6 and 10-2 and range of Reynolds number between 5·103 and 108 the errors were within ±1,0 % when compared with the Colebrook equation. The equation gives a maximum error of 3 % for Reynolds numbers as low as 2 000. The equation is:
Equation 17 is recommended for all calculations requiring a friction factor determination for turbulent flow. It is much easier to use than Equation 16 and, since the value of ∈ will usually not be known to any high degree of accuracy, will give satisfactory results.
The determination of the value to use for pipe wall roughness in the friction factor equations is sometimes difficult. It is important to emphasize that ∈ is not a property that is physically measured. Rather, it is the sand grain roughness that would result in the same friction factor. The only way this can be evaluated is by comparison of the behavior of a normal pipe with one that is sand-roughened. Moody has done this, and his results, given in Picture 5, are still the accepted values. These values should not be considered inviolate and could change significantly by such things as paraffin deposition, erosion, or corrosion. Thus, if measured pressure gradients are available, a friction factor and Reynolds number can be calculated, and an effective ∈/d obtained from the Moody diagram. This value of ∈/d obtained from the Moody diagram. This value of ∈/d should then be used for future predictions until updated again. If no information on roughness is available, a value of ∈ = 0,0006 ft is recommended for tubing and line pipe that has been in service for some time.
Example 1:
A liquid of specific gravity 0,82 and viscosity of 3 cp (.003 kg/m-sec) flows in a 4 in. (101,6 mm) diameter pipe at a velocity of 30 ft/sec (9,14 m/sec). The pipe material is new commercial steel. Caiculate the friction factor using both the Colebrook equation and the Jain equation.
Solution:
From Picture 5, for commercial steel, ∈/d = 0,00045 Colebrook Solution: Use the Drew, Koo and McAdams equation for a first guess.

This value is not close enough to fg; therefore another trial is required using fg = 0,0183.
A third trial using fg = 0,0182 gives fc = 0,0182. Jain Solution:
Combining Equations 9 and 12, the pressure gradient equation, which is applicable to any fluid at any pipe inclination angle, becomes:
where the friction factor, f, is a function of Reynolds number and pipe roughness. This relationship is shown in the Moody diagram (Pic. 4). The total pressure gradient can be considered to be composed of three distinct components; that is:
where:
is the component due to potential energy or elevation change. It is also referred to as the hydrostatic component since it is the only component that would apply at conditions of no flow.
is the component due to friction losses.
is the component due to kinetic energy change or convective acceleration. Equation 18 applies for any fluid in steady-state, one-dimensional flow for which f, ρ, and v can be defined.
The elevation change or hydrostatic component is zero for horizontal flow only. It applies for compressible or incompressible, steady-state or transient flow in both vertical and inclined pipes. For downward flow the sine of the angle is negative, and the hydrostatic pressure increases in the direction of flow.
The friction loss component applies for any type of flow at any pipe angle. It always causes a drop of pressure in the direction of flow. In laminar flow the friction losses are linearly proportional to the fluid velocity. In turbulent flow the friction losses are proportional to vn, where 1,7≤n≤2.
The kinetic energy change or acceleration component is zero for constant area, incompressible flow. For any flow condition in which a velocity change occurs, such as compressible flow, a pressure drop will occur in the direction of the velocity increase.
Although single-phase flow has been studied extensively, it still requires an empirically determined friction factor for turbulent flow calculations. The dependence of this friction factor on pipe roughness, which must usually be estimated, makes the calculated pressure gradients subject to considerable error.
Equation 18 is a differential equation and must be integrated in order to apply it to calculate pressure drop as a function of flow rate or velocity and pipe diameter. It must be combined with a continuity equation and an equation of state to express velocity and density in terms of pressure. The following sections describe various assumptions made in integrating the equation for application.
If a computer is available, the equation can be integrated numerically by dividing the pipe into small increments and evaluating the gas or fluid properties at average pressure and temperature in the increment. If small enough increments are taken, the accuracy will be very good. A procedure for calculating a pressure traverse in a pipe using this method is outlined below, and a flow chart is presented in Picture 6.
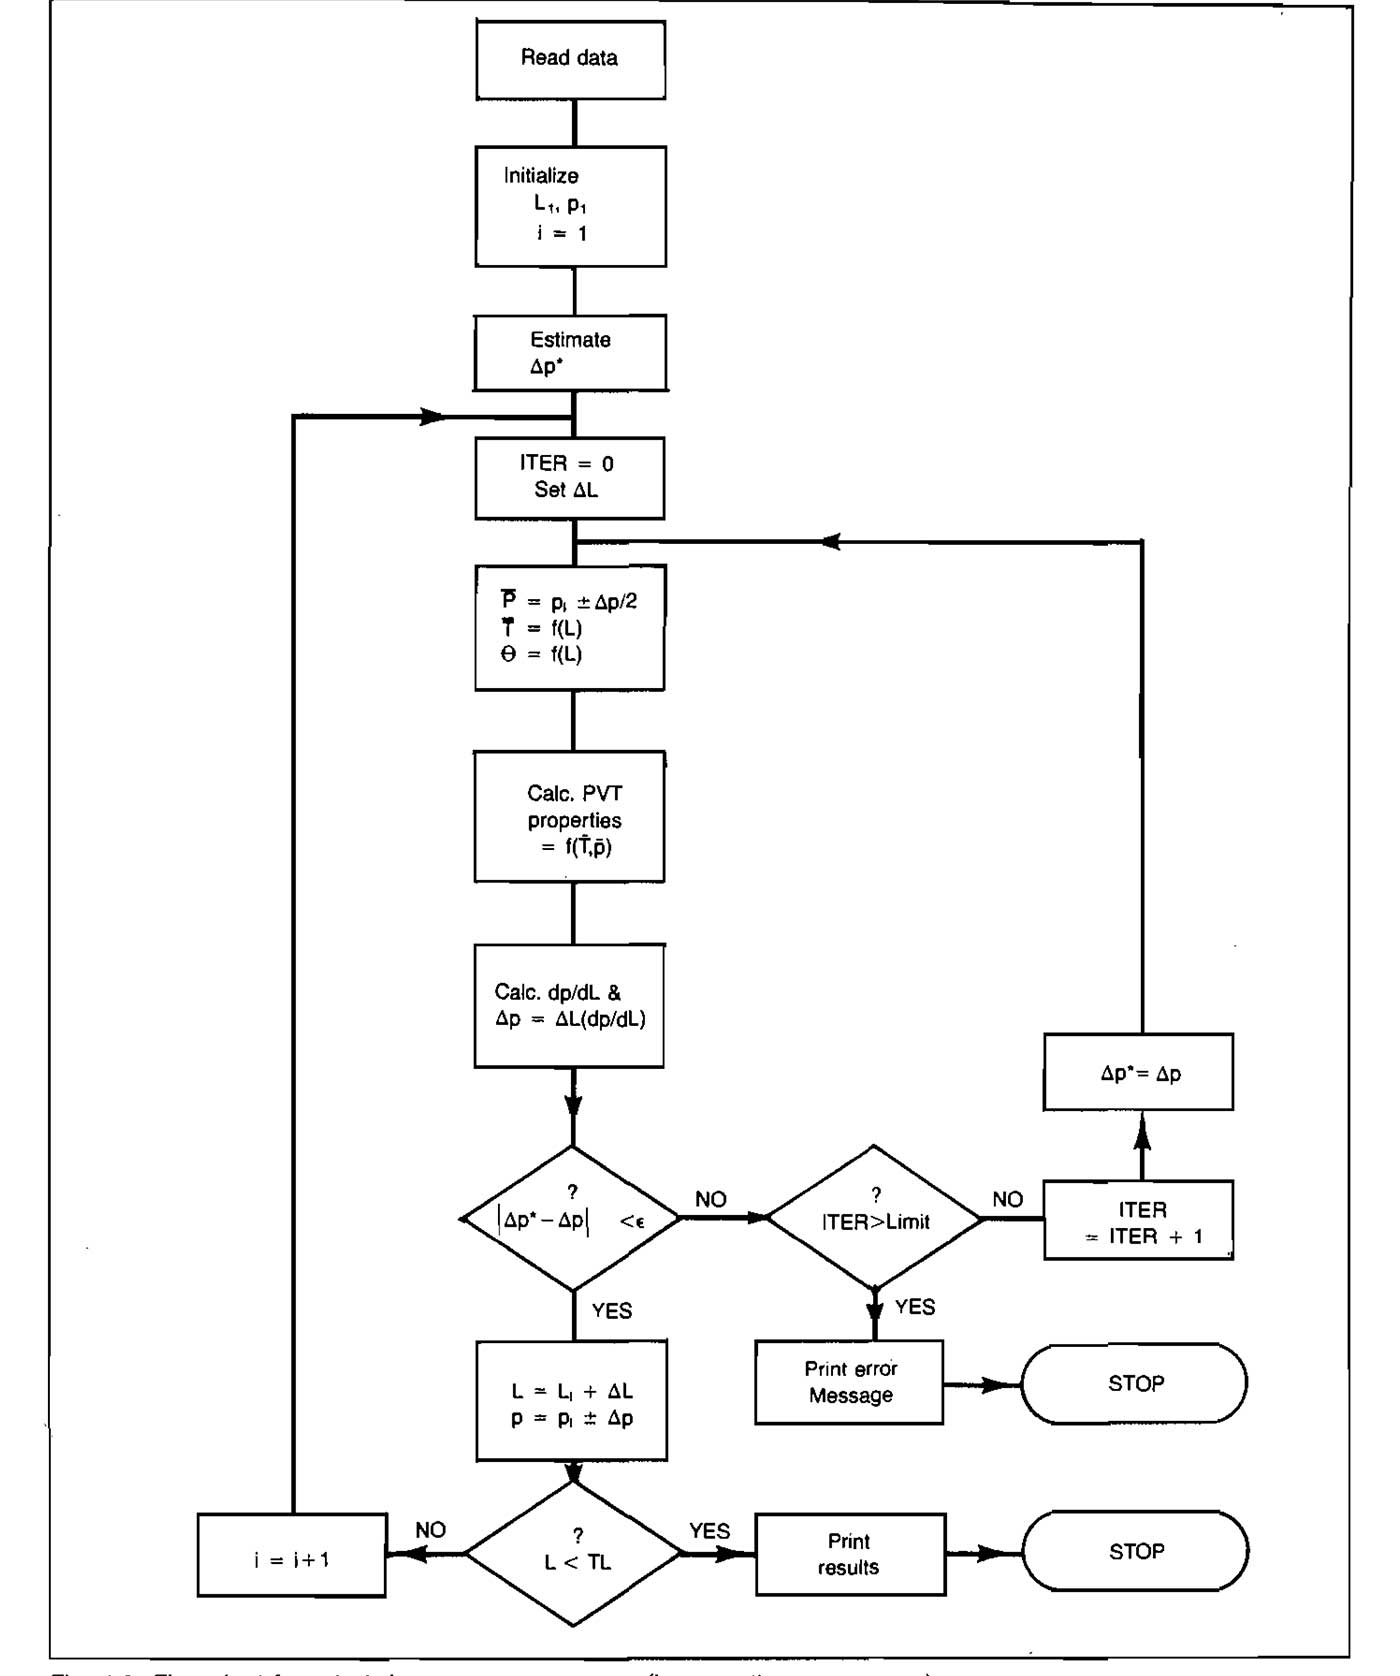
- Starting with the known pressure, p1, at location L1 select a length increment, ΔL.
- Estimate a pressure increment, Δp, corresponding to length increment, ΔL.
- Calculate the average pressure and, for nonisothermal cases, the average temperature in the increment.
- From laboratory data or empirical correlations, determine the necessary fluid and PVT properties at conditions of average pressure and temperature (ρg, vg, μg).
- Calculate the pressure gradient, dp/dL, in the increment at average conditions of pressure, temperature, and pipe inclination, using Equation 18.
- Calculate the pressure increment corresponding to the selected length increment, Δp = ΔL (dp/dL).
- Compare the estimated and calculated values of Δp obtained in steps 2 and 6. If they are not sufficiently close, estimate a new pressure increment and return to step 3. Repeat steps 3 through 7 until the estimated and calculated values are sufficiently close.
- Set L = L1+ΣΔL and p = p1+ΣΔp.
- If ΣΔL is less than the total conduit length, return to step 2.
Using this procedure the length increments can be selected so that their sum is exactly equal to the total conduit length and interpolation is not required in the last step.
Flow in Wells
Several methods are available for calculating static and flowing pressure drop in gas wells. The most widely used method is that of Cullender and Smith. All of the methods begin with Equation 18, with modifications for flow geometry. In most cases the acceleration gradient is ignored. Since it is frequently necessary to calculate the static bottom-hole pressure in a gas well, this procedure will be presented first.
Static Bottom-Hole Pressure
Vor a vertical (θ = 90°, sin θ = 1), shut-in (v = 0) gas well, Equation 18 becomes:
where:
Combining this with Equation (20):
Average Pressure and Temperature Method. If Z is evaluated at average pressure and temperature in the increment:
from which:
This equation holds for any consistent set of units. For conventional field units:
where:
- pws = static or shut-in BHP, psia;
- pts = static tubing pressure, psia;
- γg = gas gravity (air = 1);
- H = well depth, ft;
- = average temperature in the tubing, °R, and;
- = gas compressibility factor evaluated at ,
Evaluation of
makes the calculation iterative, and the procedure outlined previously can be used.
Example 2:
Using the following data, calculate pws with Equation 23.
- H = 10 000 ft;
- Ts = 70 °F = 530 °R;
- γg = 0,6;
- pts = 4 000 psia;
- Tf = 220 °F = 680 °R.
Solution:
A good first guess for pws can be obtained from:
From “Best and Most Widely Methods to Perform Necessary Calculations with a Gas”“Compressibility factors for natural gases”, Z = 0,950.
This is not close enough to the estimated value of 5 000 psia. Set the calculated value of pws as the next estimated value and continue until convergence is reached.
This value is probably close enough to the previously estimated value of 4 865. However, one more iteration using 4 868 as the estimated value yields a calculated value of 4 868 also, which is therefore the correct bottomhole pressure.
The calculation could also be made by estimating an initial value for Z and comparing calculated and estimated values until convergence on Z is obtained.
Cullender and Smith Method. The method presented by Cullender and Smith takes into account the variation of temperature with depth and the variation of Z with pressure and temperature. From Equation 21:
The integral is written in short notation as:
Using a series expansion, the value of the integral is approximated by:
where:
- pms = pressure at mid-point of well, H/2;
- Ims = I
evaluated at pms,
- Its = I evaluated at pts, Ts;
- Iws = I evaluated at pws, Tf.
The calculation procedure consists of dividing the well into two equal segments of length, H/2, finding the pressure pms at H/2 and using this value to calculate pws. Its can be evaluated from known surface conditions; that is:
Example 3:
Work Example 2 using the Cullender and Smith method.
Solution:
Calculate Its:
At T = 70, p = 4 000, Z = 0,86:
Estimate pms:
Calculate Ims:
Calculate pms:
This is not close enough to the estimated value of 4 500 psia, therefore set
= 4 465 and repeat.
At T = 145, p = 4 465, Z = 0,95:
pms = 4 464 psia which is close enough to the previously estimated value of 4 465.
Estimate pws:
- T = 220 °F;
- Z = 1,027.
Calculate Iws:
Calculate pws:
For the second trial, Z = 1,019:
A third iteration yields a value of pws = 4 880 psia. This compares with a value of 4 868 psia obtained using the average pressure and temperature method.
Flowing Bottom-Hole Pressure
For a flowing well the velocity is not zero, and ignoring acceleration, Equation 18 becomes, for a well inclined at an angle Ø from the vertical:
Several methods have been presented for integrating Equation 25 depending on the assumptions made for handling temperature and Z-factor. Only the average pressure and temperature and Cullender and Smith methods will be discussed.
Average Pressure and Temperature Method. Substituting the expression for gas density in terms of p, T, and Z into Equation 25 results in:
Integration of Equation 26 assuming an average temperature in the flow string and evaluating Z at average conditions of pressure and temperature gives:
where:
- p = psia;
- S
=
- MD = measured depth, ft;
- TVD = true vertical depth, ft;
- = °R;
- q = MMscfd;
- d = inches, and;
- f = f(NRe, ∈/d) Jain or Colebrook equation or Picture 4.
The solution procedure is the same as for a shut-in well except for evaluation of the friction factor, which requires calculating a Reynolds number and estimating pipe roughness. Iteration is required since Z and μ must be evaluated at:
Dividing the well into several length increments and using the procedure described earlier will give more accurate results. Actually, any of the methods will give identical results if the well is divided into short enough increments.
Convergence is sometimes obtained faster if iteration is performed on the Z-factor rather than the unknown pressure. The procedure for this method is:
- Estimate Z* (A good first estimate is 0,9). Viscosity may be either estimated or evaluated at the known pressure.
- Calculate the unknown pressure using Equation 27 with Z = Z*.
Calculate the average pressure,
Evaluate Z and μ at
and
- Compare Z and Z*. If not close enough, set Z* = Z and go to Step 2. Repeat until abs(Z-Z*)/Z<0,001 or any other tolerance preferred. When the tolerance is met, the pressure calculated in Step 2 is the correct value.
Example 3 (a):
Use the average pressure and temperature method to calculate the flowing bottom-hole pressure for the following directional well:
- γg = 0,75;
- MD = 10 000 ft;
- TVD = 7 000 ft;
- Ts = 110 °F;
- Tf = 245 °F;
- ptf = 2 000 psia;
- qsc = 4,915 MMscfd;
- d = 2,441 in.;
- ∈ = 0,0006 in.;
- = 0,012 cp at p = 2 000 psia;
- T
=
Solution:
In terms of mass flow rate, the Reynolds number is:
where:
| Units | ||
|---|---|---|
| Variable | Field | SI |
| qsc = gas flow rate | MMscfd | MM m3/day |
| γg = gas gravity | – | – |
| μ = gas viscosity | cp | kg/m-sec |
| d = pipe inside diameter | in. | m |
| C = constant | 20 011 | 17,96 |
From Equation 17 or Pic. 4, f = 0,015:
- Estimate Z* = 0,9:
- For Z* = 0,9, = 5,636·106+536,966= 6,173·106, pwf = 2 485 psia.
- At p = 2 242 psia and T = 178 °F, Z = 0,806, μ = 0,012.
which is too large.
2
For Z* = 0,806,
= 5,866·106+491,187
= 6,357·106, pwf
= 2 521 psia.
3
4 At p = 2 261 psia and T = 178 °F, Z = 0,805.
5
which is close enough. Therefore pwf = 2 521 psia.
Cullender and Smith Method. Derivation of the Cullender and Smith method for flowing wells begins with Equation 26. The following substitutions are made for velocity:
which gives:
or:
where:
which is constant for a given flow rate in a particular pipe size. Separating the variables gives:
which is applicable for any consistent set of units. Substituting field units and integrating the right-hand side of Equation 29 gives:
where:
and:
Writing Equation 30 in short notation and dividing the well into two increments of length H/2 gives:
Upper half of well:
Lower half of well:
where:
The solution procedure is similar to that for the static case, but is more involved because of the more complicated definition of I. For practical purposes, F can be considered a constant since the only variable in the Reynolds number used in evaluating f is gas viscosity. Viscosity is a function of pressure, but for simplification of the calculations it can be evaluated at
and the known pressure.
Example 4:
The following data pertain to a flowing gas well. Use the Cullender and Smith method to calculate the flowing bottom-hole pressure.
- γg = 0,75;
- H = 10 000 ft;
- Ts = 110 °F;
- Tf = 245 °F;
- ptf = 2 000 psia;
- qsc = 4,915 MMscfd;
- d = 2,441 in.;
- ∈ = 0,0006 in.;
- Ø = 0°;
- = 0,012 cp (assume constant).
Solution:
Calculate f and F2:
From Equation 17: f = 0,015
Calculate Itf:
At p = 2 000 psia, T = 110 °F, Z = 0,71
Estimate
(First Trial)
Calculate Imf:
At p = 2 250, T = 110+67,5 = 178, Z = 0,797
Calculate pmf:
Calculate Imf: (Second Trial)
At p = 2 371, T = 178, Z = 0,796
Calculate pmf:
Calculate Imf: (Third Trial)
At p = 2 379, T = 178, Z = 0,796
Calculate pmf:
Therefore, the pressure at the mid-point of the well is 2 379 psia. The value of pwf is now calculated.
Estimate
Calculate Iwf:
At p = 2 676, T = 245, Z = 0,867
Calculate pwf: (First Trial)
Calculate Iwf: (Second Trial)
At p = 2 741, T = 245, Z = 0,868
Calculate pwf:
This is close enough to the previously calculated value of 2 741 psia. Therefore, the flowing bottom-hole pressure is 2744 psia.
Annular Flow. Many gas wells are dually completed, and one zone may produce through the tubing-casing annulus. This presents no problem in calculating static pressures, and either of the previously described methods can be used. For flowing wells either the Average Pressure and Temperature or the Cullender and Smith method may be used if the Hydraulic Radius concept is employed. The only modifications necessary are in calculating the effective diameter and area and the Reynolds number. It can be shown that the correct effective diameter is:
where:
- dh = effective diameter;
- dc = casing inside diameter;
- dt = tubing outside diameter.
This diameter is used in calculating both relative roughness and Reynold’s number. The effective area through which the gas is flowing is:
Therefore, when using either Equation 27 or the Cullender and Smith method, the d5 is replaced by:
There are no published data on values of roughness for an annulus. It would seem that a somewhat rougher surface than that for a round pipe would be applicable since the flow must pass the tubing collars. If one measurement of pressure drop and flow rate can be made, roughness can be back-calculated, and this value can be used for other flow rates.
The Cullender and Smith and Equation 27 methods can also be used to estimate pressure drop occurring during gas injection by using a negative value for F2 in Equation 30 or making the friction loss term negative in Equation 27.
Flow in Pipelines
For most practical cases of gas flow in pipelines, the line can be considered horizontal and the hydrostatic or elevation component, as well as the acceleration component, can be dropped from the general equation, Equation 18. This is not true if the line is transporting liquids, as will be discussed later. The general equation is:
Many solutions to Equation 34 have been proposed over the years. The difference in most of the solutions results from the method used to handle the friction factor, f, and the gas compressibility factor, Z. In most cases temperature is assumed constant and Z is evaluated at average pressure in the line. This requires an iterative solution if one of the pressures is unknown. Integration of Equation 34 over some distance, L, between upstream pressure p1 and downstream pressure p2 results in:
where:
- p = psia;
- L = ft;
- = °R;
- q = MMscfd (14,7 psia, 60 °F);
- d = inches, and;
- f = f(NRe, ∈/d) (Moody diagram or Jain eq.).
Equation 35 was derived using base or standard conditions as 14,7 psia and 60 °F. It can be put in a more general form by leaving the base conditions in the equation as variables. It is frequently advantageous to express Equation 35 in terms of flow rate; that is:
The value of C depends on the units used in the equation. Table 1 gives the value of C for various combinations of units.
Example 5:
A pipeline is to deliver 320 MMscfd of gas to a downstream pressure of 600 psia. Using the following data, calculate the required upstream pressure.
- = 45 °F = 505 °R;
- γg = 0,67;
- d = 25,375 in.;
- L = 100 miles = 528 000 ft;
- ∈ = 0,0006 in.
Solution:
Use Equation 35. p1 must be estimated to determine
and
. Estimate Δp/ΔL = 0,0005 psi/ft. Then:
| Table 1. Value of C for Various Units | |||||
|---|---|---|---|---|---|
| p | T | d | L | q | C |
| psia | R | in. | mi | scfd | 77,54 |
| psia | R | in. | ft | scfd | 5 634 |
| psia | R | in. | ft | MMscfd | 5,634·10-3 |
| kPa | K | m | m | m3/d | 1,149·106 |
At p = 732 psia, T = 45 °F, Z = 0,844, μ = 0,012 cp (assume constant).
Determine f:
From Equation 17 (Jain Eq.), f = 0,0097
Calculate p1:
This is not close enough to the estimated value of 864. Set p*1 = 846 and re-calculate p1:
Second Trial:
Since two successive values of p1, are approximately equal, the iterative solution has converged. The required upstream pressure is 847 psia.
Example 6:
Calculate the flow capacity of the following pipeline.
- p1 = 4 140 kPa;
- p2 = 2 760 kPa;
- L = 30 000 m;
- d = 0,152 m;
- ∈ = 4,572·10-5 m;
- γg = 0,75;
- Tb = 288 °K;
- pb = 101,4 kPa;
- = 294 °K;
- μ = 1,2·10-5 kg/m-sec;
- = 0,889.
Solution:
The soiution will be trial-and-error or iterative since friction factor is required in Equation 36. This requires a value of Reynolds number, which requires flow rate, the unknown. Rather than estimate flow rate, it Is easier to estimate friction factor. The procedure is as follows:
- Estimate f*;
- Calculate q using Equation 36;
- Calculate NRθ = f(q);
- Calculate f using the Moody diagram or Equation 17;
- Compare f and f*. If not close, set f* = f and go to Step 2. Continue until f = f*.
- Estimate f* = 0,01, a reasonable value for pipelines.
- q = 31 783/f0,5 = 31 783/(0,01) 0,5 = 317 830 m3
- NRθ = 7,385·106(0,31783) = 2,347·106
- Comparing f and f*, 0,015 ≠ 0,010, therefore, set f* = 0,015.
2
3
4 f = 0,015
5 f = f*, therefore q = 259,507 m3/day.
The previous examples illustrate that if either the pressure drop or flow rate is unknown, the solution is iterative. If the unknown is diameter, the solution will also be iterative since diameter is necessary to evaluate the friction factor. This fact has prompted several investigators to substitute a specific equation for f into the general flow equation to make the solution for either q or d noniterative or explicit. The friction factor specified may be either diameter dependent only or Reynolds number dependent. None includes the dependence on pipe roughness.
The expressions incorporated into Equation 35 for f in several of the most popular pipeline equations are listed below.
| Equation | f |
|---|---|
| Panhandle A | |
| Panhandle B | |
| IGT | |
| Weymouth |
Using these relationships for friction factor in Equation 36, the general form of the pipeline flow equation without f becomes:
where E is the efficiency factor, and the values of the ai constants used in the various equations are tabulated below.
The efficiency factor depends on the condition of the pipe and usually varies between about 0,7 and 0,92 for dry gas. It must be estimated just as pipe roughness was estimated in the previous equations.
| Equation | a1 | a2 | a3 | a4 | a5 |
|---|---|---|---|---|---|
| Panhandle A | 435,87 | 1,0788 | 0,5394 | 0,4604 | 2,618 |
| Panhandle B | 737,00 | 1,0200 | 0,5100 | 0,4900 | 2,530 |
| IGT | 337,90 | 1,1110 | 0,5560 | 0,4000 | 2,667 |
| Weymouth | 433,50 | 1,0000 | 0,5000 | 0,5000 | 2,667 |
The units to be used in Equation 37 are:
- q = cu ft/day measured at Tb, pb;
- T = R;
- p = psia;
- L = miles, and;
- d = inches.
Example 7:
Using the following data, calculate the flow capacity of the pipeline using the Weymouth equation, the Panhandle B equation, and the Panhandle A equation.
- p1 = 847 psia;
- p2 = 600 psia;
- d = 25,375 in.;
- L = 100 miles;
- γg = 0,67;
- = 505 °R;
- = 0,846;
- Tb = 520 °R;
- pb = 14,7 psia;
- E = 1,0.
Solution:
Weymouth:
Panhandle B:
Panhandle A:
The flow capacities using the various equations vary considerably and can be compared to the results of Example 5, which showed that the line would deliver 320 MMscfd at the specified pressures. If it is assumed that this is the correct value for q, efficiency factors of 1,061, 0,890, and 0,879 would have to be applied to the Weymouth, Panhandle B, and Panhandle A equations respectively to make the. calculated results agree.
The choice of which equation to use can be difficult. It is generally assumed that the Panhandle A equation is more applicable at Reynolds numbers in the transition region, and the B equation is more accurate in the fully turbulent region. If pipe roughness data are available, the value of friction factor can be determined and Equation 36 should be used.
All of the pipeline equations considered to this point have been applicable to horizontal or near-horizontal pipes only. That is, all of the calculated pressure drop is due to friction. If the gas changes elevation, an elevation component will apply even though it is very small for most pipelines. However, the elevation or hydrostatic component may be included in the general flow equation as follows:
where:
- e = natural log base = 2,718;
s =
and;
- H = elevation change, ft.
This method of handling the elevation change assumes that the rate of elevation change with pipeline length is constant. However, if this is not the case, very little error will result because of this assumption unless the average pressure in the line is very high, resulting in a large gas density effect.
Pipelines in Series
If a pipeline or gathering line consists of sections of different diameter pipe, the flow capacity of the entire pipeline can be calculated by first determining an equivalent length of a line of some arbitrary diameter that would have the same flow capacity as the system. The general flow equation or any of the specialized equations can then be used to determine the flow capacity. By using the fact that for a series pipeline:
it can be shown that:
where N = number of pipe segments. If the specialized equations are used, the friction factor is not required and the equation becomes:
where a3 and a5 are obtained from the previous table. For example, if the Weymouth equation is used, since a3 = 0,5 and a5 = 2,667, Equation 40 becomes:
Pipelines in Parallel
For pipes in parallel the total flow rate is the sum of the rates in the individual pipes, or:
If the lengths of the individual pipes are the same, the total flow capacity is calculated from:
When applied to the specialized equations, Equation 43 becomes:
The diameter do of a single line having the same flow capacity as N parallel lines of diameters di is:
In many cases only part of an existing pipeline will be paralleled or “looped” in order to increase its flow capacity. Equations 41, 44, and 45 can be combined to give:
where:
- qnew = new flow capacity after looping;
- qold = flow capacity before looping;
- Y = fraction of the original line that was paralleled starting at the outlet;
W =
- d1 = diameter of original line;
- d2 = diameter of parallel line;
- f1 = friction factor for original line, and;
- f2 = friction factor for parallel line.
Using the specialized equations, the expression for W becomes:
Equation 46 can easily be solved for either W or Y to determine either the necessary line size for the parallel line or the length of line to be looped.
Effects of Liquids
The equations presented in the previous sections were derived for calculating the relationship between flow rate and pressure drop for dry gases. There are many cases in gas production operations in which some liquid will be traveling in the pipe along with the gas. These include gas wells producing some condensate or water and pipelines in which condensationmay occur or water may form. The presence of these liquids greatly increases the pressure drop for a given gas rate and reduces the efficiency of gathering systems.
If the liquid loading is low, the increased pressure drop in the tubing can be handled by adjusting the gas gravity used in the vertical gas flow equations. This will not suffice for pipeline flow because the liquids will accumulate in the low sections in the line. It then becomes necessary to apply a two-phase pressure drop method to design the piping system. Methods for use in both wells and pipelines will be discussed in this section.
Well Performance
The two-phase flow problem in flowing wells can be handled by either fluid gravity adjustment or by applying a two-phase flow correlation. There are many such correlations available, but only the Hagedorn and Brown method will be discussed in detail for vertical flow. The Beggs and Brill method, which will be used for pipeline flow, can also be used for well performance, but it has been found to sometimes overpredict pressure drop in vertical flow. Other well-known vertical, two-phase flow correlations are those of Poettmann and Carpenter, Orkiszewski, Duns and Ros and Gray.
Gravity Adjustment. The gravity adjustment procedure consists of adjusting the gas gravity to a mixture gravity to account for the added density due to the liquid and then using one of the equations presented earlier to calculate pressure drop in a well. Either Equation 27 or the Cullender and Smith method can be used. The mixture gravity is given by:
where:
- γm = adjusted fluid gravity (air = 1);
- γg = dry gas gravity;
- γL = liquid specific gravity, and;
- R = producing gas-liquid ration, scf/STB.
The gravity adjustment method may be used with confidence for wells producing at high gas-liquid ratios. If a well is producing at a gas-liquid ratio of less than approximately 10 000 scf/STB, the two-phase correlations should be used. A gas-liquid ratio of 10 000 scf/STB expressed in terms of liquid loading is 100 STB/MMscf.
This simple method of adjusting the gas density for the presence of liquids assumes that the fluids are flowing as a homogeneous mixture. It should not be used for any gas-liquid ratio unless the well is flowing at a high enough rate to keep it from loading with liquids. The loading phenomenon is discussed in the next section.
Hagedorn and Brown Method. The Hagedorn and Brown method, ignoring acceleration, requires solution of Equation 25 for each increment that the well is divided into.
Empirical correlations are presented for determining the mixture density ρm and the friction factor, f. The parameters in Equation 49 are defined by:
- ρm = ρLHL+ρg(1-HL);
- ρL = liquid density;
- ρg = gas density;
- HL = liquid holdup (fraction of pipe occupied by liquid);
- Ø = angle of well segment from vertical;
- vm = vsL+vsg;
- vsL = superficial liquid velocity = qL/Ap;
- vsg = superficial gas velocity = qg/Ap;
- Ap = area of flow string = πd2/4;
- d = flow string ID;
- ρf = ρn2/ρm;
- ρn = ρLλ+ρg(1-λ), and;
- λ = vsL/vm.
The friction factor is calculated using the Jain equation or found from the Moody diagram using the pipe relative roughness and the following Reynolds number:
where:
μm =
- μL = liquid viscosity, and;
- μg = gas viscosity.
Determination of HL requires the use of three empirical correlations. These are presented in Pictures 7, 8, and 9.

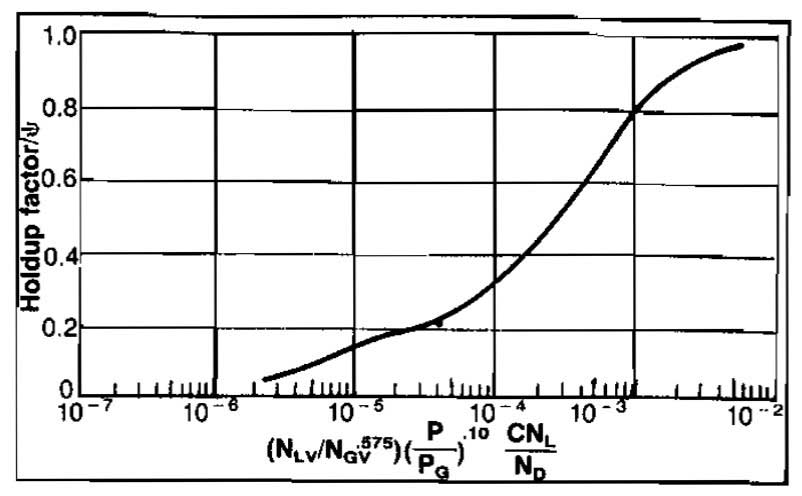
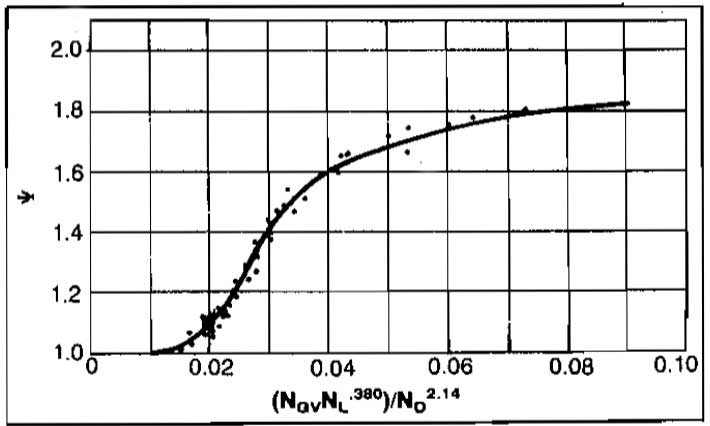
In order to determine HL from these figures, the following dimensionless numbers must be evaluated from known data:
and:
where σ = gas-liquid surface tension. These equations are valid for any consistent set of units. For field units the equations are:
and:
where:
- vsL, vsg = ft/sec;
- ρL = lbm/cu ft;
- σ = dynes/cm;
- d = ft, and;
- μL = centipoise.
The procedure for finding HL is:
- Calculate NL.
- Find CNL from Picture 7.
- Calculate
where pa = base pressure (14,7 psia).
Find
from Picture 8.
Calculate
- Find ψ from Picture 9.
- Calculate HL = ψ(HL/ψ).
A constraint on liquid holdup is that HL≥λ.
Once HL is determined, NRe and thus f can be calculated. The pressure gradient can then be calculated. This is Step 5 in the procedure for calculating a pressure traverse, which was presented earlier. All of the fluid properties and velocities used in the above equations are evaluated at the average pressure and temperature in the tubing increment.
When gas and liquid flow simultaneously in a pipe, the velocity of the mixture must be great enough so that the drag forces acting upward on the liquid are great enough to offset the gravity forces acting downward. Otherwise, the liquid will fall back and accumulate in the pipe. This increase in liquid holdup will increase the density of the mixture and therefore, the hydrostatic or elevation pressure gradient. The resulting increase in bottornhole pressure will result in a decrease in rate coming from the reservoir and therefore, a further decrease in velocity of the fluid in the pipe. If steps are not taken to increase the velocity, the well may die. The velocity of the fluid in the pipe depends on both the pipe size and the volumetric flow rate. The velocity may become too low if either the tubing is too large or the flow rate is too small. The liquid loading phenomenon is illustrated qualitatively in Picture 9 (a).
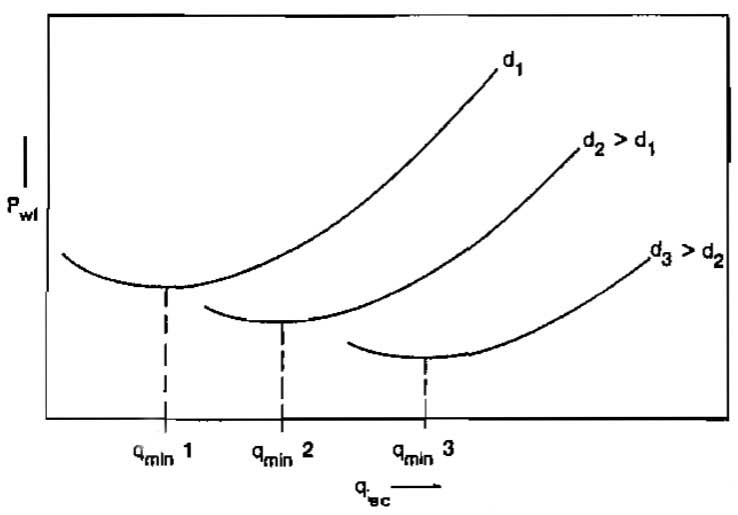
Most of the two-phase flow correlations mentioned earlier can be used to construct plots as illustrated in Picture 9 (a) and thus determine the minimum gas rate to avoid loading for a particular tubing size. A simple equation for predicting this minimum rate will be presented in a subsequent section.
Example 8:
During the calculation of a pressure traverse in a gas well producing liquid, the following conditions were determined at the average pressure and temperature in the pipe increment:
- p = 1 500 psia;
- T = 180 °F;
- d = 2,992 in.;
- μg = 0,012 cp;
- μL = 0,45 cp;
- σ = 25 dynes/cm;
- vsg = 30 ft/sec;
- vsL = 5 ft/sec;
- ∈ = 0,0006 ft;
- ρL = 50 lbm/cu ft;
- ρg = 8 lbm/cu ft;
Using the Hagedorn and Brown method, determine the pressure gradient.
Solution:
Before finding HL and f, some preliminary calculations are made:
Determine HL:
- NL = 0,0024;
- From Picture 7, CNL = 0,002;
- From Picture 8, HL/ψ = 0,29;
- From Picture 9, ψ = 1,0;
- HL = 1,0(0,29) = 0,29;
From Picture 4 or Equation 17, f = 0,025:
A FORTRAN computer subroutine for the Hagedorn and Brown method is included in the appendix.
Pipeline Performance
Two methods will be presented for handling pipelines in which both liquid and gas are flowing. The Flanigan method accounts for the added pressure drop caused by lifting the liquid up the hills in a hilly-terrain pipeline and ignores any pressure recovery in the downhill sections. The angle of the hill is of no consequence in this method.
The Beggs and Brill correlation can be used to account for the hydrostatic or elevation pressure drop and is applicable to downward two-phase flow such as might occur in offshore gathering lines.
Flanigan Method. Flanigan proposed using the Panhandle A equation to calculate the pressure drop due to friction, based on the gas flow rate. A correlation for efficiency factor as a function of superficial gas velocity and liquid loading is presented in Picture 10.

The gas velocity and liquid to gas ratio are in ft/sec and bbls/MMscf, respectively. The additional pressure drop due to hills is calculated from:
where:
- Δpe1 = pressure drop due to hills, psi;
- ρL = liquid phase density, lb/ft3;
- HF = holdup factor, and;
- Σh = sum of the vertical heights of the hills.
The holdup factor is a function of gas superficial velocity and is calculated from:
The superficial gas velocity used in Picture 10 and Equation 52 must be calculated at the average pressure and temperature in the line. This requires an iterative solution since either p1 or p2 is unknown and
. If either q or d is unknown, they must be estimated before vsg can be calculated.
Beggs and Brill Method. The Beggs and Brill method requires the determination of the flow pattern that would exist in the pipeline if the pipe were horizontal. Different equations are used to calculate liquid holdup for each flow pattern. The flow patterns defined are shown in Picture 11.
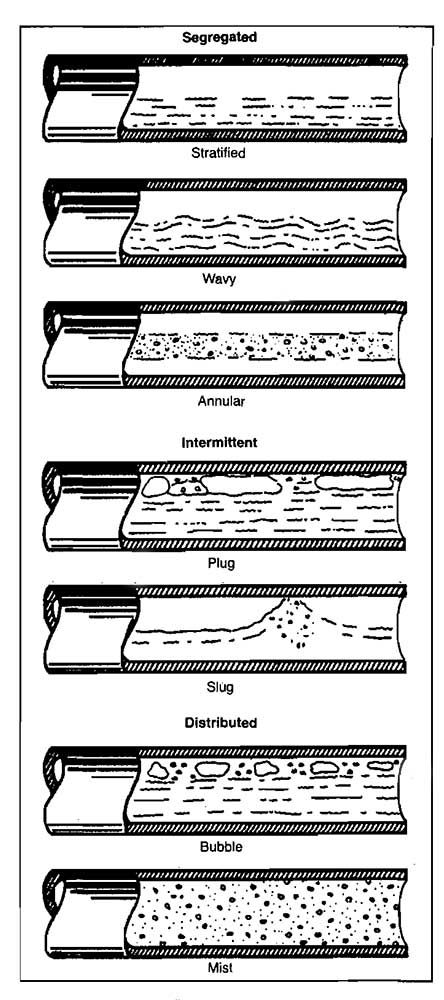
Determination of the correct flow pattern requires calculating several dimensionless numbers, including a two-phase Froude number.
The following variables are used to determine which flow pattern would exist if the pipe were in a horizontal position. This flow pattern is a correlating parameter and gives no information about the actual flow pattern unless the pipe is horizontal.
The horizontal flow pattern limits are:
| Segregated | |
| Limits | λ<0,01 and NFR<L1 |
| or | λL≥0,01 and NFR<L2 |
| Transition | |
| Limits | λL≥0,01 and L2<NFR≤L3 |
| Intermittent | |
| Limits | 0,01≤λL<0,4 and L3<NFR≤L1 |
| or | λL≥0,4 and L3<NFR≤L4 |
| Distributed | |
| Limits | λL<0,4 and NFR≥L1 |
| or | λL≥0,4 and NFR>L4 |
When the flow falls in the transition region, the liquid holdup must be calculated using both the segregated and intermittent equations and interpolated using the following weighting factors.
where:
and:
The same equations are used to calculate liquid holdup for all flow patterns. The coefficients and exponents used in the equations are different for each flow pattern.
The liquid holdup depends on flow pattern and is calculated from:
where HL(0) is the holdup that would exist at the same flow and pressure conditions in a horizontal pipe. It is calculated from:
where a, b and c are determined for each flow pattern from Table 2.
| Table 2 | |||
|---|---|---|---|
| Flow Pattern | a | b | c |
| Segregated | 0,98 | 0,4846 | 0,0868 |
| Intermittent | 0,845 | 0,5351 | 0,0173 |
| Distributed | 1,065 | 0,5824 | 0,0609 |
The value calculated for HL(0) is constrained by:
The factor for correcting the holdup for the effect of pipe inclination is given by:
where Ø is the actual angle of the pipe from horizontal, and:
where α, e, f, and g are determined for each flow condition from Table 3.
| Table 3 | ||||
|---|---|---|---|---|
| Flow Pattern | α | θ | f | g |
| Segregated uphill | 0,011 | -3,768 | 3,539 | -1,614 |
| Intermittent uphill | 2,96 | 0,305 | -0,4473 | 0,0978 |
| Distributed uphill | No correction | C = 0, ψ = 1, HL = f(φ) | ||
| All flow patterns downhill | 4,70 | -0,3692 | 0,1244 | -0,5056 |
The value for C must be positive, and if a negative value is calculated, C is set equal to zero.
Once HL(Ø) is determined, the two-phase density is calculated from:
where Hg = 1-HL.
The pressure gradient due to elevation change is then:
The pressure gradient due to friction is:
where:
The no-slip friction factor fn is determined from the Moody diagram or from Equation 17 using the following Reynolds number:
where:
The ratio of the two-phase to no-slip friction factor is calculated from:
where:
and:
The value of S becomes unbounded at a point in the interval 1<y<1,2; for y in this interval, the function S is calculated from:
Although the acceleration pressure gradient is very small except for high velocity flow, it should be included for more accurate results.
If an acceleration term is defined as:
the total pressure gradient can be calculated from:
Example 9:
Using the following data for a hilly terrain pipeline, calculate the outlet pressure using the Beggs and Brill method.
- = 7 140 STB/D;
- = 25,7 MMcf/D;
- d = 12 in.;
- p1(inlet) = 425 psia;
- = 90 °F, γg = 0,70;
- γo = 0,83 = 40 °API.
Divide the pipeline into two sections. Section 1 rises 300 ft in one mile. Section 2 drops 300 ft in 3 000 ft.
Solution:
Section 1
1
Estimate Δp and calculate
:
2 From fluid property correlations, at 410 psia and 90 °F:
- Rs = 96 scf/STB;
- Bo = 1,047;
- μo = 2,4 cp;
- σo = 19,6 dyno/cm;
- z = .925;
- μg = 0,0105 cp.
3 Calculate flow rates and densities:
4 Calculate the in-situ superficial velocities:
5 Determine the flow pattern:
Since λL>.01 and L2<NFR≤L3.
Flow pattern is transition, therefore interpolation is required.
6 Calculate the liquid holdup:
- Segregated:C = (1- λL) ln (.011 λL-3,768 NLv3,539 NFR-1,614) = 5,516Ø = arcsin (300/5 280) = 3,257°ψ = 1+C [sin (1,8 Ø)-sin3 (1,8 Ø)/3] = 1,56HL(Ø)(segregated) = HL(0) ψ = .189 (1,56) = .295
- Intermittent:C = (1-λL) ln (2,96 λL.305 NLv-.4437 NFR.0976) = .1246ψ = 1+C(.1015) = 1,013HL(Ø) (intermittent) = .157(1,013) = .159B = 1-A = .545HL (transition) = A·HL (seg.)+B·HL (int.) = .455(.295)+.545(.159) = .221
7 Calculate the actual and no-slip densities:
8 Calculate the friction factor:
From Equation 17:
8 Calculate the pressure gradient:
10 Calculate the pressure drop:
For hand calculations this is ciose enough to the estimated Δp* of 30 psi. If a computer program were being used, the calculated Δp would be taken as the new estimated Δp* and the procedure would be repeated until the error was smaller. The pressure at the end of section 1 is 425-32,2 = 392,8 psia. The same procedure must be followed to calculate the pressure at the end of section 2.
Section 2
1
2
- Rs = 90;
- Bo = 1,046;
- μo = 2,4 cp;
- μg = 0,0105 cp;
- σo = 19,6 dyno/cm;
- z = .925;
3
4 vsL = .484/.785 = 0,616 ft/sec
5 λL = .616/14,14 = 0,4356
Since λL>.01 and L2<NFR<L3, flow pattern is transition.
6
- Segregated:C = (1-λL) ln (4,7 λL-.3692Ø = -arcsin (300/3 000) = -5,74°ψ = 1+C (sin(1,8 Ø)-sin3(1,8 Ø)/3) = 1-1,75(.177) = .69HL(Ø) = .183(.69) = .126
- Intermittent:C = 1,75, ψ = .69HL(Ø) = .153(.69) = .106
7 ρs = 50,28(.115)+1,46(1-.115) = 7,07 lbm/cu ft
8
9
10 Δp = (-.0036)(3 000) = -10,8 psi
The estimated Δp* was zero. Iteration through two more trials gives a pressure drop of -8,6 psi. The pressure at the outlet end of the pipe is then 425-32,2+8,6 = 401,4 psia.
Gas Flow Through Restrictions
There are several locations in the gas production system where the gas must pass through relatively short restrictions. Examples of these restrictions are perforations, subsurface safety valves, and surface chokes. The flow may be either critical or subcritical. In critical flow the velocity of the gas through the restriction is equal to the velocity of sound in the gas. Since pressure disturbances travel at the velocity of sound, a disturbance in the pressure downstream of the restriction cannot affect the upstream pressure or the flow rate.
In sub-critical flow the flow rate depends on both the upstream and downstream pressures. Surface chokes are usually sized so that flow will be critical, whereas in subsurface safety valves the flow is subcritical. Flow through well perforations will also be subcritical. Equations for both critical and subcritical flow are given in this section.
Flow through well perforations was discussed in Manual for Engineers to Calculate Amount of Gas in ReservoirsEssential Calculations of the Gas Reservoire Performance.
A general equation for flow through restrictions can be obtained by combining the Bernoulli equation with an equation of state and assuming that there are no irreversible or friction losses taking place. An empirical discharge coefficient is included to account for the simplifying assumptions used in deriving the equation. The following equation may be used for both critical (sonic) or subcritical (subsonic) flow. Tables 4 and 5 give values for the constants in the equation for various systems of units.
| Table 4. Coefficients and Units for Equation 61 | |||
|---|---|---|---|
| Symbol | English System | Metric System | SI Metric System |
| qsc | Mscf/d | m3/d | m3/d |
| d | in. | mm | mm |
| p abs | psia | kgf/cm2 | kPa |
| T abs | °R | °K | °K |
| Cs | 27,611 | 1,6259 | 1,6259 |
where:
- qsc – volumetric gas flow rate;
- Cn – coefficient based on system of units, discharge coefficient and standard conditions;
- d – ID of bore opening to gas flow;
- γg – gas specific gravity (air = 1,0), dimensionless;
- k – ratio of specific heats = Cp/Cv, dimensionless;
- p1 – upstream pressure, absolute units;
- p2 – downstream pressure, absolute units;
- T1 – upstream temperature, absolute units;
- Z1 – compressibility factor at p1 and T1, dimensionless;
- Cs – coefficient based on system of units;
- Cd – discharge coefficient (empirical), dimensionless;
- Tsc – standard temperature base, absolute units;
- psc – standard pressure base, absolute units, and;
- Rpc – critical pressure ratio, dimensionless.
Values of k can be obtained from:
where:
- M = molecular weight, lbm/mole;
- Cp = specific heat, BTU/lbm – °R.
The pressure ratio at which flow becomes critical depends on the k value for the flowing gas and is given by:
| Table 5. Coefficient for Equation 61 | ||||
|---|---|---|---|---|
| System of Units | Cd | psc abs | Tsc abs | Cn |
| English | 0,865 | 14,696 psi | 491,68 °R | 799,06 |
| 0,865 | 14,696 psi | 519,68 °R | 844,57 | |
| Metric | 0,865 | 1,0332 kg/cm2 | 273,16 °K | 371,83 |
| 0,865 | 1,0332 kg/cm2 | 288,72 °K | 393,01 | |
| SI Metric | 0,865 | 101,325 kPa | 273,16 °K | 3,7915 |
| 0,865 | 101,325 kPa | 288,72 °K | 4,0075 | |
In calculating the values for Cn given in Table 5, a discharge coefficient of 0,865 was used. The discharge coefficient actually depends on the Reynolds number, the ratio of the diameter of the pipe to the diameter of the restriction, and the geometry of the restriction.
Example 10:
Using the following data, find the flow rate through the choke for:
a) p2 = 2 837 kPa, and;
b)
- p2 = 1 420 kPa;
- d = 10 mm;
- γg = 0,69;
- k = 1,25;
- Cd = 0,865;
- psc = 101,325 kPa
- Tsc = 288,72 °K;
- T1 = 333 °K;
- p1 = 3 546 kPa;
- Z1 = 0,93.
Solution:
From Table 5, Cn = 4,0075:
a)
, therefore flow is subcritical.
Using Equation 61:
b)
, therefore flow is critical.
Equation 61 has been modified for particular types of wellhead chokes. An equation which is used for the types of chokes manufactured by the Thornhill-Craver company is given below. This equation applies for 6 in. long chokes with rounded entrances operating in critical flow. The equation is:
where:
- qsc = flow rate, Mscfd;
- A = area of choke opening, in.2;
- p1 = upstream pressure, psia;
- Cd = discharge coefficient, usually = 0,82;
- T = upstream temperature, °R, and;
- γg = gas specific gravity.
Example 11:
Recalculate the flow rate in Example 4·10b using Equation 4·61a.
- d = 10 mm = 0,394 in.;
- p1 = 3 546 kPa = 514 psia;
- T1 = 333 °K = 600 °R;
- γg = 0,69.
Solution:
An equation for calculating the pressure drop across a subsurface safety valve operating in subcritical flow was presented by the API in 1974. For the English System of units given in Table 4, the equation is:
where:
- β = d/dp;
- dp = pipe diameter, inches;
- Cd = discharge coefficient (API suggests using 0,9), and;
- Y = expansion factor;
The solution of Equation 62 is iterative since Y is a function of Δp = p1-p2. The value for Y ranges from about 0,67 to 1,0. For quick estimates of Δp, a value of 0,85 can be used.
Example 12:
A subsurface safety valve having a bean diameter of 1,0 in. is installed in a gas well equipped with 3,5 in. tubing (2,992 in. ID). The well is flowing at a rate of 20 MMscfd. Calculate the pressure drop across the SSSV if the pressure upstream of the SSSV is 2 000 psia. The temperature is 180 °F. Assume Cd = 0,9, Y = 0,85. Gas gravity is 0,70.
Solution:
Use of Pressure Traverse Curves
Several equations were presented earlier for calculating flowing bottom-hole pressures in gas wells. Solution of these equations is iterative and, unless a computer is available, can require a considerable amount of time to solve. Estimates in the field can be made by using previously prepared pressure traverse curves, which can be calculated using conditions relative to a specific field. These curves can be prepared using either Equation 27 or the Cullender and Smith method. If small length increments are used in the calculations, Equation 27 is sufficiently accurate. Samples of flowing gas pressure traverse curves prepared using Cullender and Smith (see Pics. 12 through 16) are included for illustration.

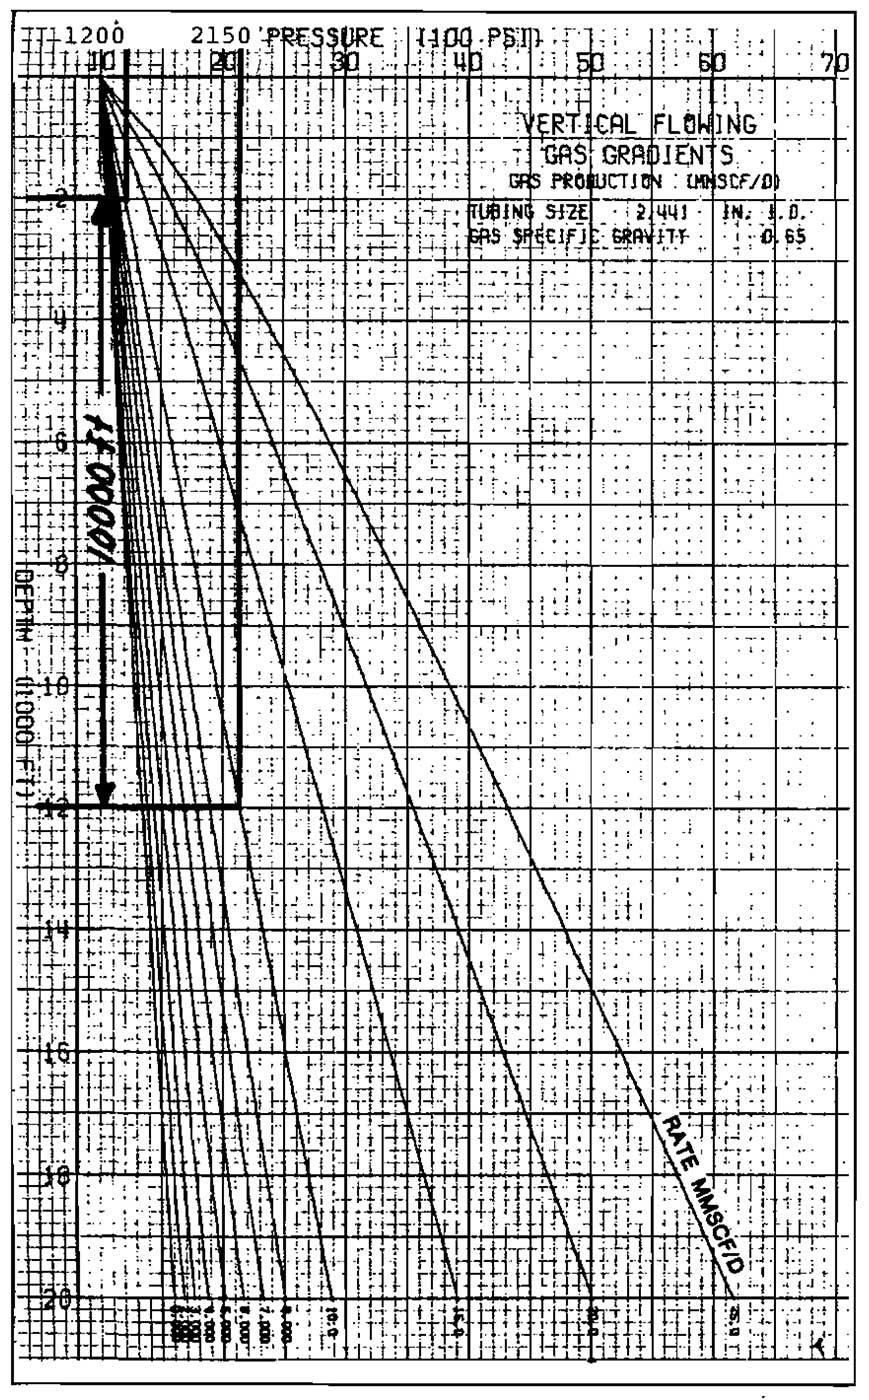
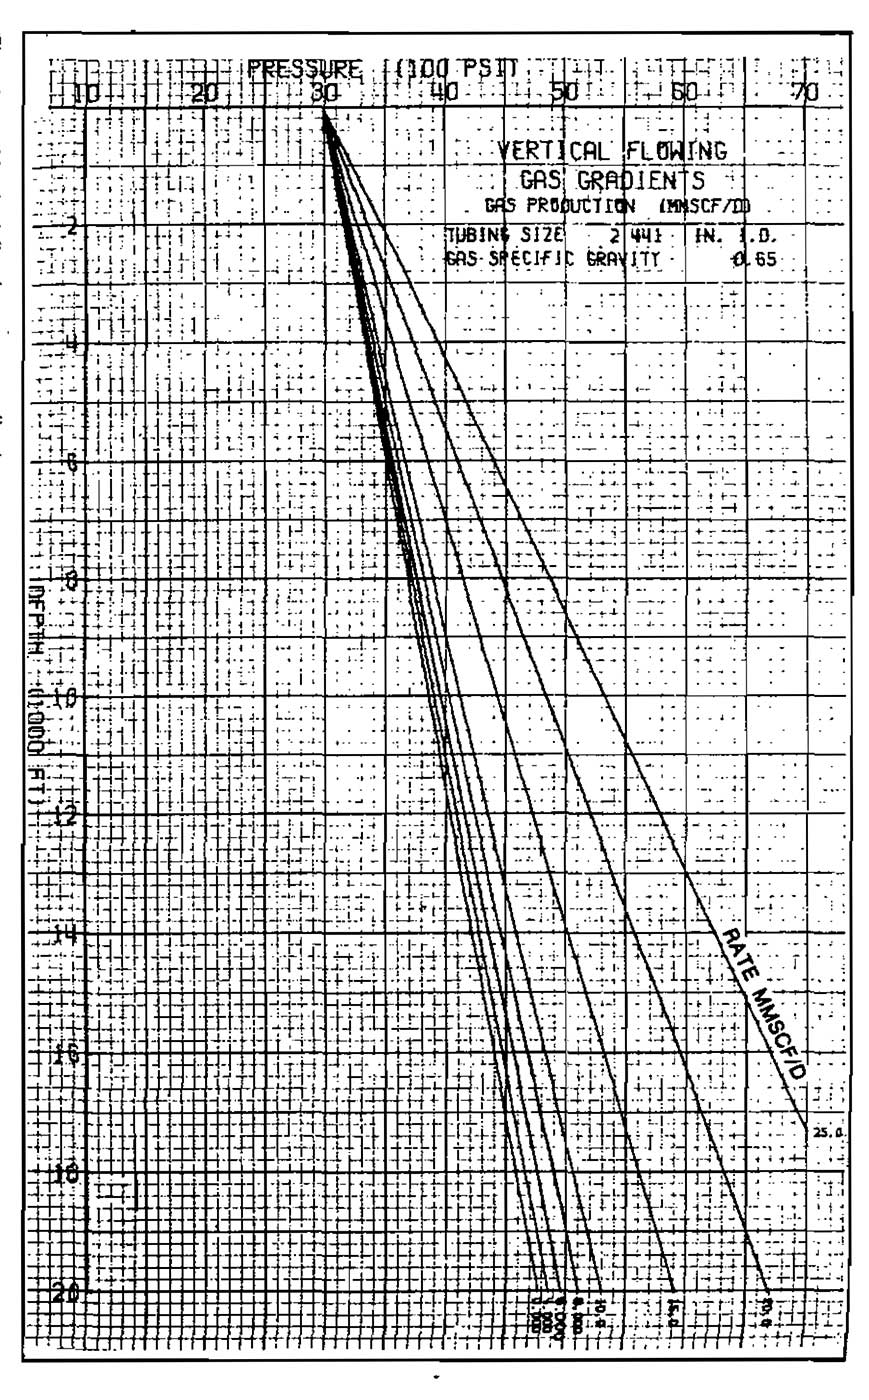
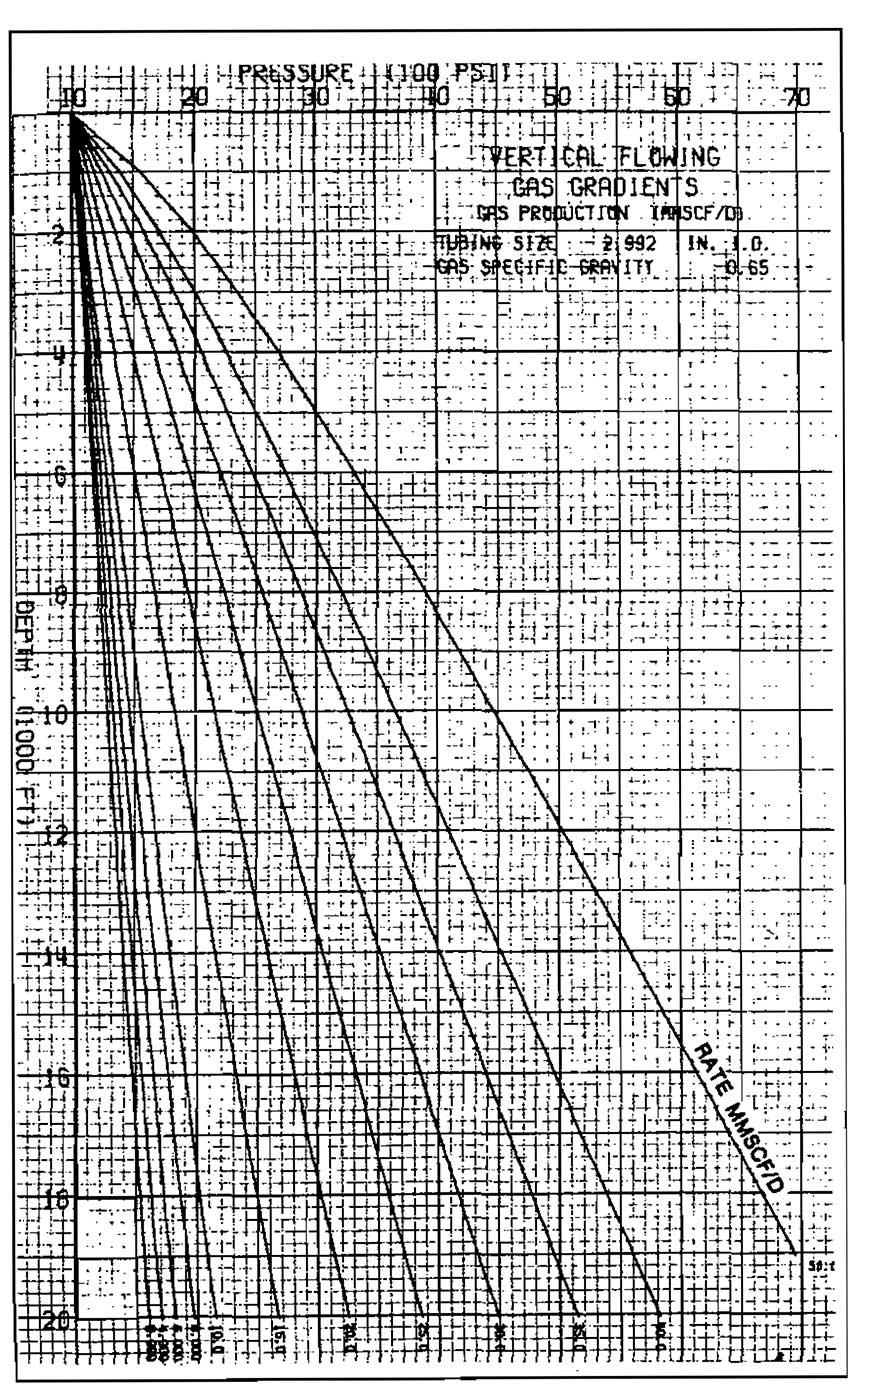
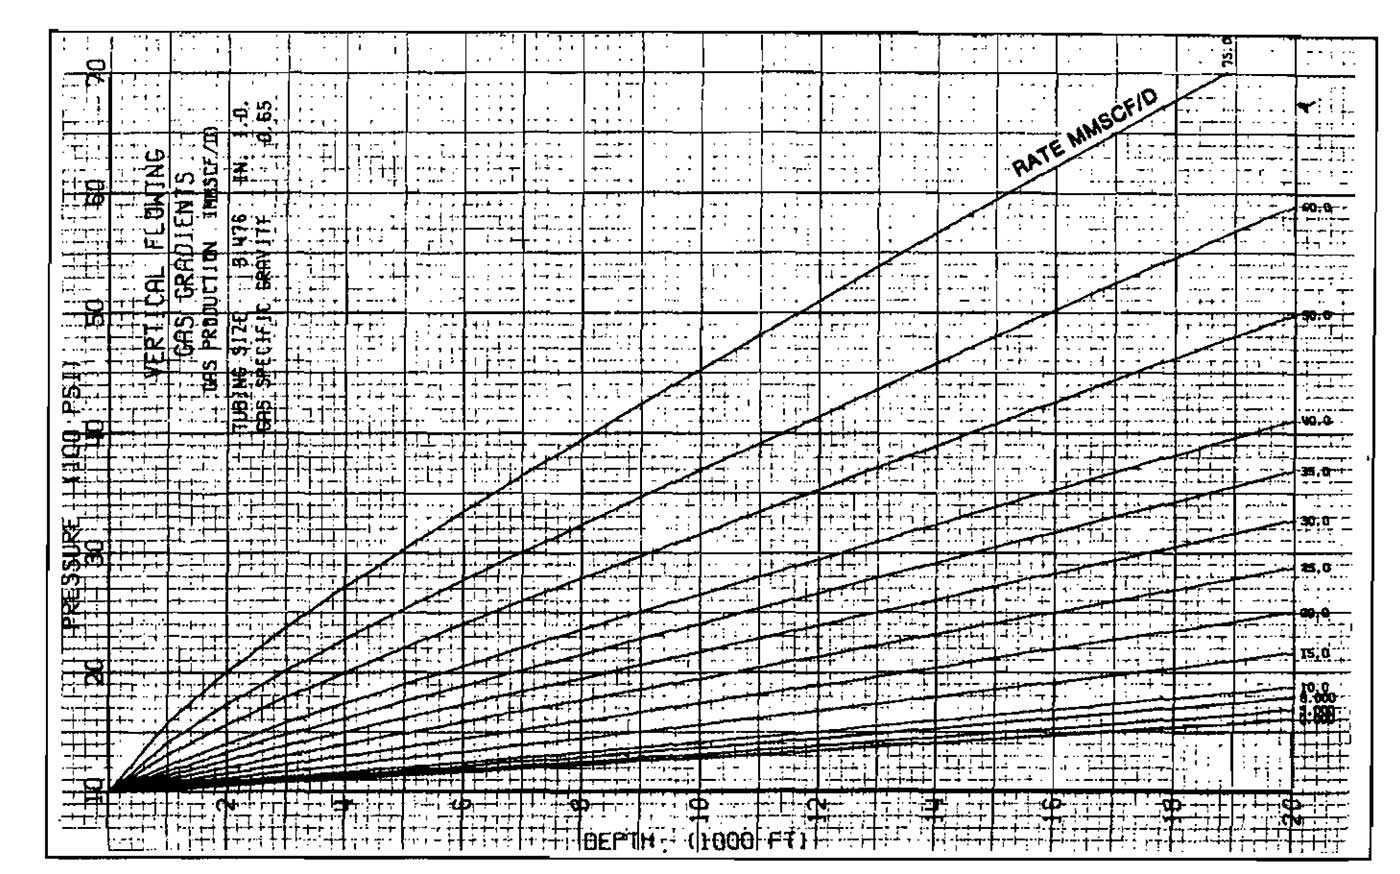
An example problem illustrates the application procedure for determining flowing bottom-hole pressure. It should be pointed out that when using the prepared traverse curves, one has no control over gas gravity, flowing temperature, gas viscosity, or pipe roughness. These curves were taken from Brown.
Example 13:
Using the traverse curves, estimate the flowing bottom-hole pressure for the well producing under the following conditions:
- H = 10 000 ft;
- ptf = 1 200 psig;
- d = 2,441 in.;
- qsc = 9,8 MMscfd.
Solution:
Select Picture 13 as the curve that closely matches the given conditions. The following procedure will yield an estimate of pwf:
- Starting at the known pressure of 1 200 psig on the pressure axis, draw a vertical line to intersect the 10 MMscfd traverse line.
- Draw a horizontal line to the depth axis. This locates the equivalent depth of 2 000 ft, which represents the wellhead.
- Add the well depth to the equivalent depth found in Step 2 to get 10 000 + 2000 = 12 000 ft.
- Draw a horizontal line from 12 000 ft to intersect the 10 MMscfd line.
- From this intersection, draw a vertical line to the pressure axis and read pwf = 2 150 psig.
Liquid Removal from Gas Wells
One of the most common factors that can reduce the deliverability of a gas well is the increased flowing wellbore pressure caused by the accumulation of liquids in the well bore. Liquid accumulation can occur in wells that have never produced large quantities of liquid.
When the velocity of the fluid in the tubing is too low to lift the liquids to the surface the liquid accumulates and begins to build up in the bottom of the well. The increased hydrostatic head acting on the formation further reduces the flow rate and thus the velocity of the fluid. This process continues until the well dies or begins to flow intermittently. The source of these liquids is either condensation of hydrocarbons or water from the gas or water entering from the formation.
Several methods have been used to either keep the liquid from accumulating or to remove the liquid as it accumulates. Some of these methods are discussed in this section.
Minimum Flow Rate for Continuous Liquid Removal
A model for calculating the minimum gas velocity for removing liquid droplets from wells was presented by Turner, et al. in 1969. The model was based on the fact that a freely falling particle in a fluid will reach a terminal velocity when the drag forces are equal to the gravitational forces. The terminal velocity is a function of the size, shape, and density of the particle and the density and viscosity of the fluid in which it is falling. The interfacial tension between the two fluids also influences this velocity since the droplet will shatter if the surface tension of the liquid is too small.
By writing a force balance on a droplet suspended in gas, the following equation was obtained:
where:
- vt = terminal velocity of the droplet, ft/sec;
- σ = interfacial tension, lbf/ft;
- ρL = liquid density, lbm/ft3;
- ρg = gas density, lbm/ft3, and;
- Cd = drag coefficient.
The equation was adjusted using experimental data to evaluate the drag coefficient, and when surface tension is expressed in dynes/em, Equation 63 becomes:
Turner, et al. also presented simplified versions of Equation 64 for field use that are easier to use since only the minimum pressure in the flow string is required. Equations were presented for use when the liquid is either water or condensate, which necessitate assuming average values for the fluid properties. The assumptions used were:
| Liquid | σ, dynes/cm | ρ, lbm/ft3 |
|---|---|---|
| Water | 60 | 67 |
| Condensate | 20 | 45 |
It was. also assumed that the gas density could be put in terms of pressure if a gas gravity of 0,6 and a temperature of 120 °F were used. This resulted in separate equations for water and condensate.
where the velocities are in ft/sec and the pressures are in psia. The minimum volumetric flow rate for a particular velocity and pipe size may be calculated from:
- qsc (min.) = minimum flow rate for continuous liquid removal, MMscfd;
- vg = gas velocity, ft/sec;
- A = conduit area, ft2;
- T = flowing temperature, °R;
- Z = gas compressibility factor evaluated at T and the pressure used to calculate vg, and;
- p = wellhead pressure, psia.
Equations 65 and 66 were derived using wellhead flowing pressures since this was the only pressure measured in the field tests. Actually, the minimum velocity in a gas well will occur at the point of highest pressure, that is, at the bottom of the well. Using the bottom-hole flowing pressure to determine qsc (min.) will introduce a safety factor in the design.
A nomograph of Equation 67 is presented in Picture 17.

The product qZ is obtained from the nomograph, and to obtain qsc (min.), the Z factor must be calculated at surface conditions.
Example 14:
A gas well is producing against a fixed wellhead pressure of 1 150 psia through 3-1/2 in. (2,992 ID) tubing. Wellhead temperature is 140 °F and gas gravity is 0,70. Calculate the minimum flow rate required to keep this well unloaded il it produces salt water along with the gas.
Solution:
at p = 1 150, T = 140 °F, γg = 0,7, the Z-factor is 0,86.
Turner, et al., observed that Ibeir melbod was applicable for liquid loading up to 130 bbl/MMscf. If bolb water and condensate are present, the equation for water should be used.
Liquid Removal Methods
Various melbods for removing liquids from gas wells, sometimes called dewatering, have been used in Ibe past. Descriptions of the methods and Ibe degree of success of Ibe various melbods are described in papers by Hutlas and Granberry and by Libson and Henry. Libson and Henry found Ibat Ibe minimum surface velocity for keeping wells unloaded in the Intermediate Shelf Area of soulbwest Texas was 1 000 ft/min or about 17 ft/sec. Melbods for liquid removal include:
- pumping units;
- gas lift;
- plunger lift;
- intermittent flow ilb flow controllers;
- small tubing installation and;
- soap injection.
Beam Pumping Units. Pumping units may be used to pump Ibe liquids up Ibe tubing, allowing the gas to be produced through the annulus. An advantage of using pumping units is Ibat they do not depend on gas velocity for lift and can be used to deplete Ibe field to a very low pressure. It is desirable to have the tubing set as close as possible to the bottom perforations or even below the perforations. A liquid cushion above the pump helps prevent gas from entering the pump.
On low liquid-rate wells, difficulties arise because a beam pumping unit cannot be adjusted for very low rates. The wells are sometimes pumped intermittently.
Plunger Lift. A plunger installed in a gas well producing liquid acts as an interface between the gas stored in the annulus and the liquid accumulated in the tubing above the plunger. A schematic of a plunger lift well is shown in Picture 18. The well remains shut in for a period of time and is then opened to allow the plunger, pushed by the annulus gas, to unload the liquids.
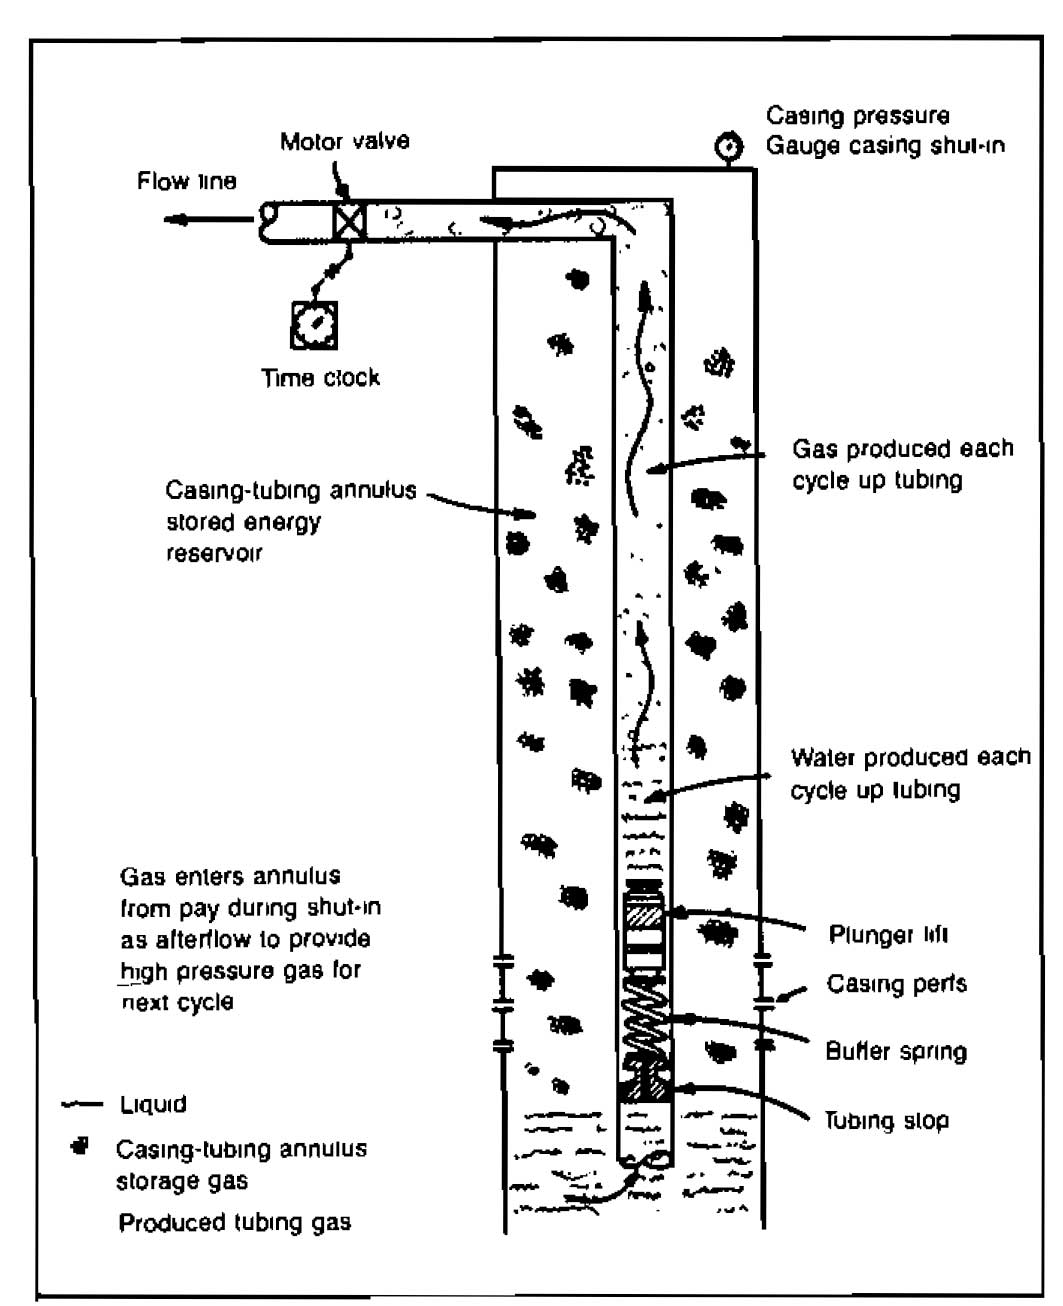
The automatic opening of the well may be accomplished by a motor valve on the flowline. The motor valve may be operated by a clock or by monitoring the flow rate of the well. If a clock is used the time cycles are adjusted by trial-and-error to find the optimum.
Surface flow controllers may be used that permit the well to flow until the gas velocity drops to some critical value. The well is then shut in for a time period that still must be determined by trial. The advantage of the flow controller is that it allows the well to flow for the maximum length of time before shut-in.
Small Tubing. Smaller tubing may be installed in gas wells as the flow rate decreases in order to maintain the velocity above a critical value. In some cases a smaller string may be run inside the existing tubing string, such as running 1 in. inside 2-7/8 in. tubing. This method works best on low volume wells in which friction loss is not severe.
Gas-Lift. A recent development in removing liquid from gas wells is the combination of a liquid diverter and gas-lift system. This system lifts liquid up the tubing string and produces gas through the annulus.
A liquid diverter is a device that opens when a predetermined head of liquid is accumulated above it, allowing the liquid to enter the tubing from the annulus. The tubing is open to atmospheric pressure at the surface. As liquid is diverted to the tubing, it accumulates until the gas-lift valve opens to lift the liquid slug to the surface.
The gas-lift valve may be actuated by the liquid head in the tubing if it is a so-called fluid operated valve. Various other means have been proposed to control the opening and closing of the gas-lift valve. Some of these are described by Hutlas and Granberr.
Soap Injection. Injection of surfactants or foaming agents into the annulus with a chemical pump and timer has produced successful results in some wells. By the reduction of the surface tension, water can be unloaded continuously in a foamed state. Soap injection has not been as successful in wells producing condensate because of the difficulty involved in obtaining a surfactant that will foam condensate.
Erosional Velocity
When fluid flows through a pipe at high velocities, erosion of the pipe can occur. This is especially true for high capacity gas flow in which the in-situ velocity may exceed 60 to 70 ft/sec. Erosion is not as much of a problem in oil wells, although some high gas-liquid ratio wells may be subject to erosion.
The velocity at which erosion begins to occur cannot be determined exactly, and if solid particles such as sand are in the fluid, erosion may occur at relatively low velocities.
The velocity at which erosion may occur has been related to the density of the fluid by the following equation.
where:
- ve = erosional velocity, ft/sec;
- ρ = fluid density, lbm/ft3, and;
- C = a constant that ranges between 75 and 150.
A good value for C has been found to be about 100. If C is set equal to 100, and the gas equation of state is used to express density, Equation 68 becomes:
The equation may be expressed in terms of gas flow rate at standard conditions by:
where:
- qe = erosional flow rate, Mscfd;
- A = area of the pipe, ft2;
- p = lowest pressure in the pipe, psia;
- T = temperature at point where p is determined, °R;
- Z = gas compressibility factor at p, T, and;
- γg = gas gravity.
Example 15:
A gas well is producing through 2-7/8 in tubing at a wellhead pressure of 800 psia. The wellhead temperature is 140 °F and gas gravity is 0,65. Determine the maximum rate at which this well can produce without exceeding the erosional velocity.
Solution:
At p = 800, T = 140 °F the value of Z is 0,91.
Predicting Flowing Temperatures
All of the correlations presented previously require a value of fluid temperature in order to calculate the required fluid property or pressure drop. The flowing temperature profile in a gas well or an oil well is usually assumed to be linear between the surface temperature and the bottom-hole temperature. A linear temperature profile is also frequently assumed for surface flowline calculations. The linear assumption for well flow will usually not introduce significant errors if a good value for surface flowing temperature can be obtained. The heat loss from a fluid in a pipe is a function of the mass flow rate in the pipe, and will therefore change with a change in producing rate.
An algorithm for coupling pressure and heat loss calculations requires an iterative solution because the overall heat transfer coefficient and the enthalpy change depend on pressure. If some average heat transfer coefficient can be determined, an approximate temperature profile can be calculated independent of the pressure loss calculations. This will of course be less accurate, but in many cases the amount of data available will not be sufficient to perform the more accurate calculation.
Flowing Temperatures in Wells
An equation for temperature in a well as a function of location, L, as derived by Ramey, can be written as:
where:
- T1 = temperature at fluid entry (L = 0);
- TL = temperature at location L;
- GT = geothermal gradient;
- A = relaxation distance wCp/πdU;
- w = mass flow rate, = ρscqsc;
- Cp = specific heat of the flowing fluid;
- d = pipe diameter;
- U = overall heat transfer coefficient, and;
- L = distance from fluid entry.
When the equation is written in this form it assumes that the fluid and surroundings temperature are equal at the inlet to the pipe. This will be the case for flowing wells where T1 is the reservoir temperature. Also included is the assumption that the heat loss is independent of time. This assumption limits application of Equation 70 to wells that have been producing for a considerable length of time.
When multiphase flow is occurring in a well, the variables involved in evaluating the relaxation distance, A, are very difficult to determine, especially the overall heat transfer coefficient U. In view of this fact, Shiu and Beggs developed an empirical method to estimate A based on measured temperature profiles from 270 wells. Using the measured temperatures, TL at various locations, L, a value of A for each test was calculated from Equation 70. An equation to estimate A was then developed as a function of data that will usually be known.
The equation is:
where:
- A = relaxation distance, ft;
- w = total mass flow rate, lbm/sec;
- ρL = liquid density at standard cond., lbm/ft3;
- d = pipe ID, in.;
- API = oil gravity, °API;
- γg = gas gravity (air = 1);
- C1 = 0,0149;
- C2 = 0,5253;
- C3 = 2,9303;
- C4 = -0,2904, and;
- C5 = 0,2608, and;
- C6 = 4,4146.
Equation 71 is applicable for flowing oil wells only, although a similar approach could be used for gas wells.
Flowing Temperatures in Pipelines
In order to calculate a temperature profile in a pipeline it is usually assumed that the temperature of the surroundings is constant. Modification of Equation 70 to account for this results in:
where Ts is the surroundings temperature, and the other variables are defined in Equation 70.
For flow of gases the Joule-Thomson effect may be included, but since this effect depends on pressure, an iterative solution is required. The more rigorous equation is:
where:
- μ = Joule-Thomson coefficient, and;
- dP/dL = pressure gradient at L.
If measured values of temperature and flow rate are available for one flow condition, a value for the group of terms Cp/πU may be calculated. The value of this group can be assumed constant for a particular well or even for an entire field if necessary. The procedure is:
- Using measured values of T and L, calculate A;
- Using the measured flow rate qsc, calculate
- For other conditions of qsc and/or d, calculate
This procedure can be used for both wells and pipelines.
