Although natural gas has been utilized as a fuel for more than 150 years, the large demand for it has developed fairly recently. The principal reason for this is the greater difficulty of storing and transporting gas as compared to liquid fuels. Initially, natural gas was used only in the areas in which it was produced, with excess production being vented to the air or flared. This was especially true of gas produced along with the oil in oil fields.
The development of large diameter, high pressure pipelines and compressors, along with the technology of gas storage in reservoirs, has spurred both the demand for natural gas and the development of the technology required to produce and transport it. This is illustrated in the United States by the fact that natural gas supplied more than 30 % of the total energy demand in 1980 as compared to 18 % in 1950 and less than 4 % in 1920. Natural gas supplied about 20 % of the energy worldwide in 1980.
The Liquefied Natural Gas as the Energy of the Futureincreased demand has also greatly increased the price obtained for the gas. In 1950 the average price for natural gas in the United States was about $0,07 per thousand standard cubic foot (Mscf), and as late as 1970 the price averaged only about $O,17/Mscf. In 1980 the average price had increased to more than $0,90/Mscf with gas in some areas selling for as much as $9,00/Mscf. The large difference in the average and maximum selling price is due to the huge quantities being sold at very low prices under long term contracts made many years ago.
Natural gas is used primarily as a fuel for space heating and for generating steam for electric power plants, although its use as a feedstock for petrochemical plants is increasing rapidly. Because of the necessity of using very high pressure to store significant quantities of natural gas in small spaces, its use as a fuel for motor vehicles is very limited. However, as the supply of liquid fuels such as gasoline diminishes, it is likely that technology will be developed to overcome this problem.
Geographical Occurrence of Natural Gas
Geological conditions necessary for commercial accumulations of natural gas exist in various locations worldwide. The tables and graphs presented in this section locate and quantify the known reserves and the production rates of various countries. These data are also presented for various states in the United States.
Worldwide Occurrence of Natural Gas
The worldwide reserves of natural gas has steadily increased during recent years, while the United States reserves declined from 1967 to 1983.
Table 1 shows that the United States share of the total world reserves decreased from 27,8 % to 6,7 % during the 1967-1983 period. As of 1983, the proved world gas reserve was 3 033 trillion cubic feet. The changes in reserves by area from 1967 to 1983 are shown in Table 1.

(r) Revised;
(p) Preliminary;
(1) Figures include 26 trillion cubic feet in Prudhoe Bay, Alaska (discovered in 1968) for which transportation facilities are not yet available;
(2) Based on Energy Information Administration estimates
These statistics are also reported by country for the twenty leading gas producing countries in Table 2.
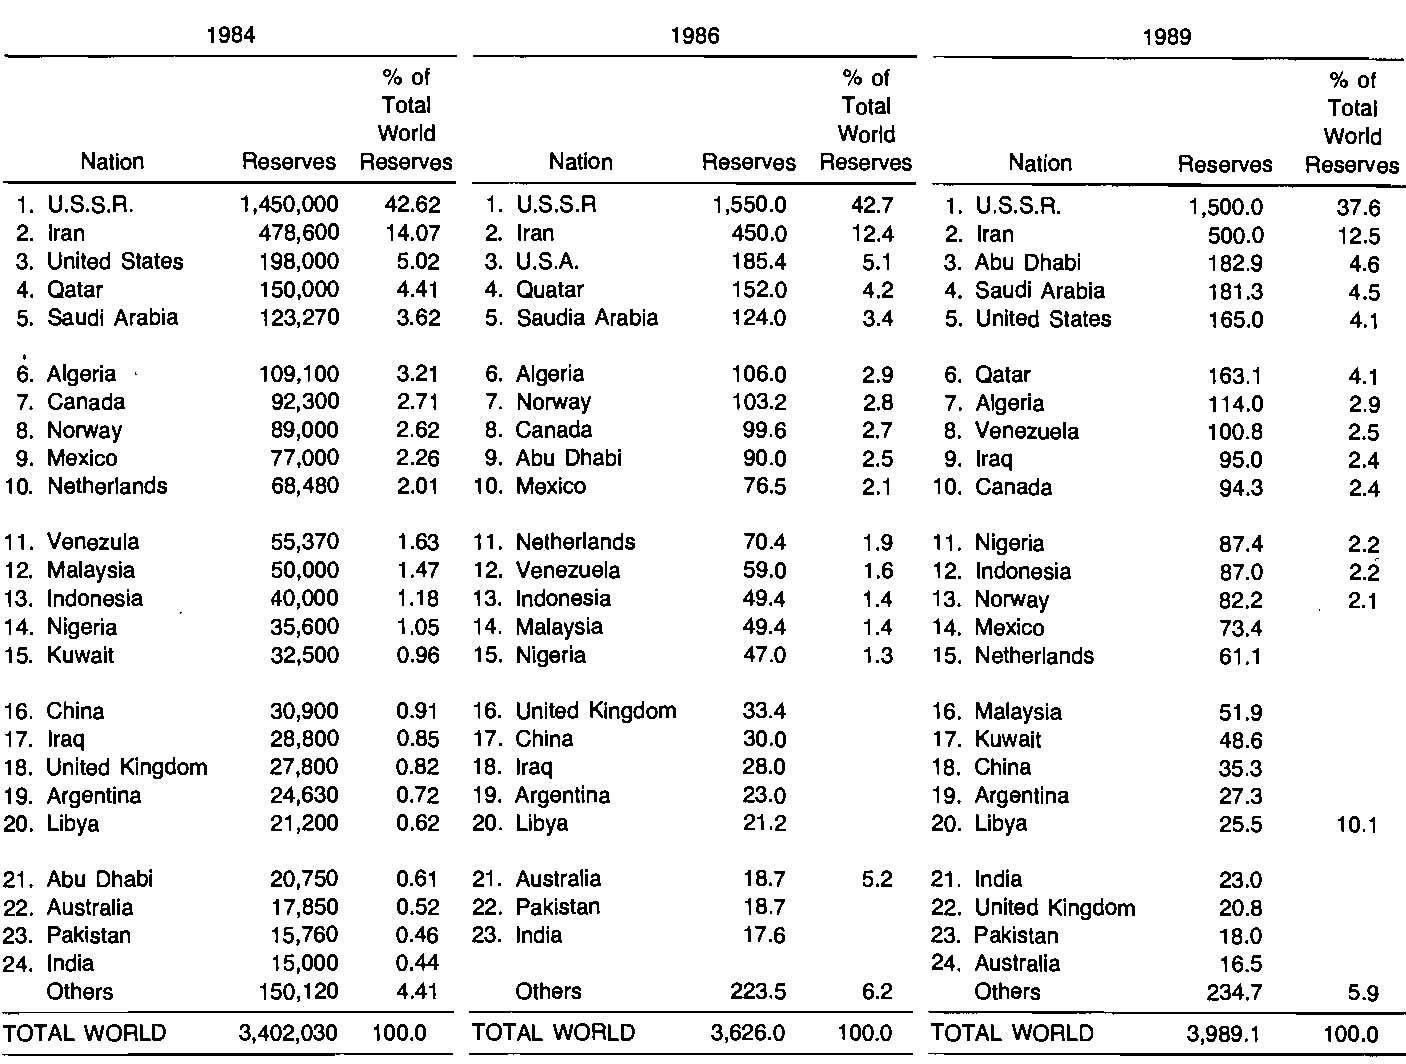
Although the United States has less than 7 % of the total world reserves, it currently produces more than 34 % of the gas produced worldwide. Production statistics by area for the 1975-1981 period are presented in Table 3.
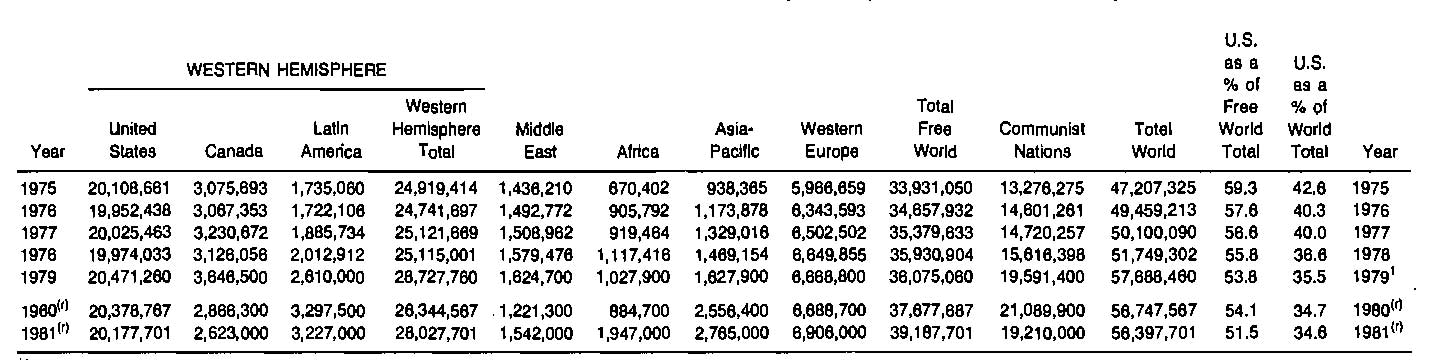
(r) Revised
The production statistics for the twenty leading countries are presented in Table 4 for 1980, 1981 and 1984.
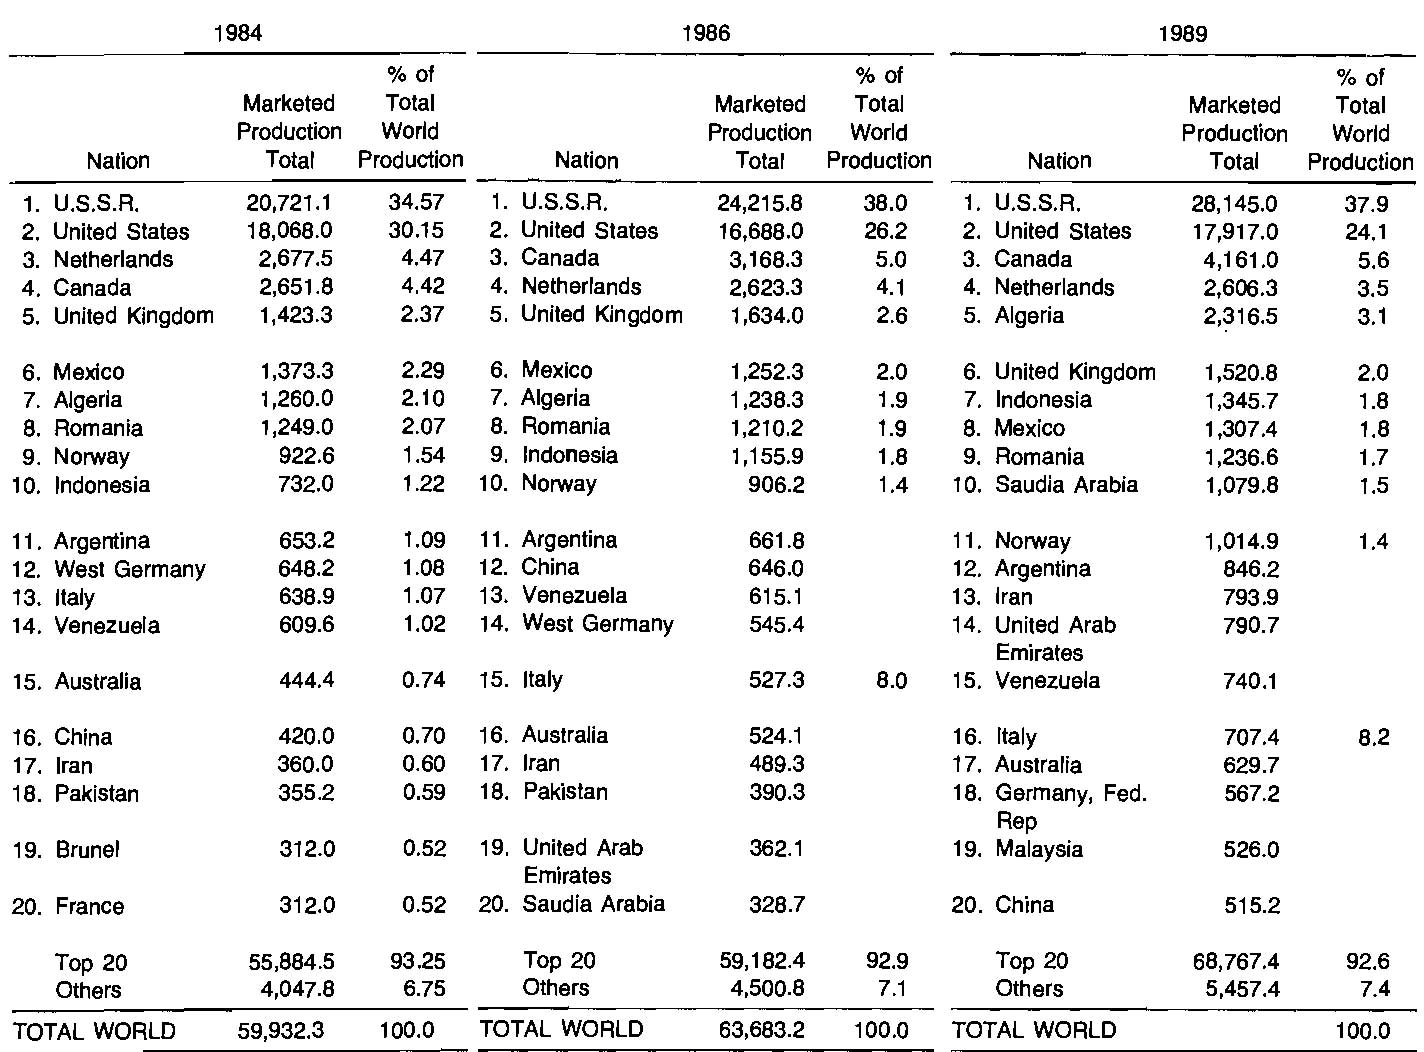
At the 1981 worldwide production rate of 160 billion cu ft/day, known reserves exist to sustain this rate for another forty-five years.
Occurrence of Natural Gas in the United States
The United States is not in the same condition as the total world with respect to supply of natural gas. As shown in Table 5, almost eleven years would be required to deplete the 1981 known reserves at 1981 production rates.
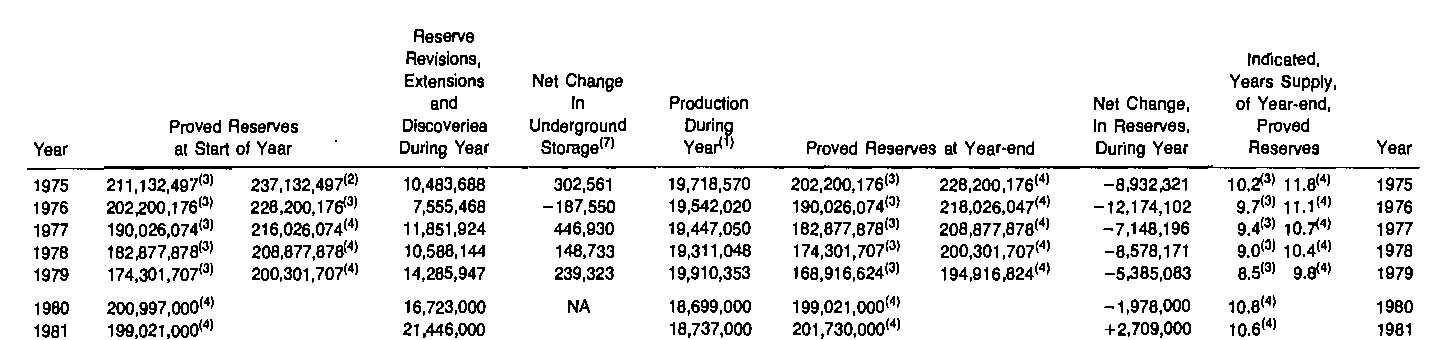
(1) – Estimated;
(3) – Figures exclude 26 trillion cubic feet in Prudhoe Bay, Alaska (discovered in 1968) which are not yet available for market due to the lack of transportation facilities;
(4) – Figures include 26 trillion cubic feet in Prudhoe Bay, Alaska;
(7) – The net difference between gas stored in and gas withdrawn from underground storage reservoirs, inclusive 01 adjustments and nativegas transferred from other reserve categories. (Adjustments include change of reporting basis starting in 1973 to report only gas reserves considered recoverable, in effect, reducing gas reserves by 1 024 140 MMCF that would have been reported since 1972 using former basis)
This does not mean that the gas will be depleted in ten years, however, as new supplies are being found continuously. The changing reserve situation in the United States is illustrated graphically in Picture 1.
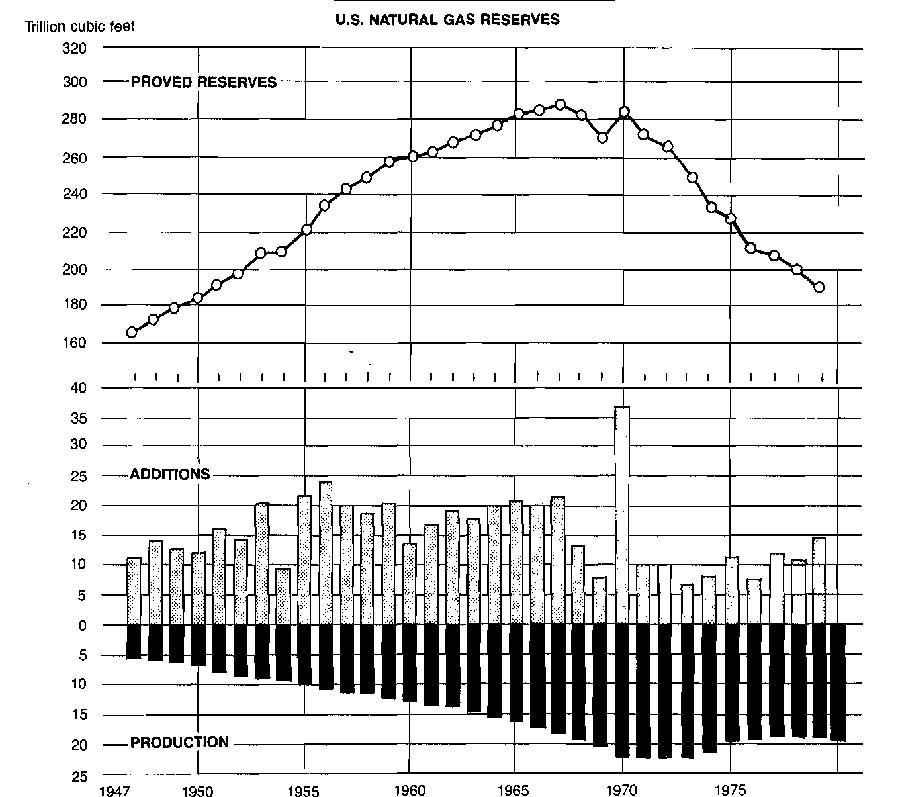
Table 6 shows estimates of the total remaining resources of natural gas in the United States. Depending on the source of the estimate, the resources remaining in 1979 range from 502 to 1 202 trillion cubic feet.
| Table 6. Estimated Gas Resources and Reserves (Trillion Cubic Feet) Including Alaska | ||||||
|---|---|---|---|---|---|---|
| Source of Estimate | Year of Estimate | New Fields | Potential Resources Does not include possible resources from unconventional sources such as coal-bed degasification. Devonian shale, Rocky Mountain tight-gas formation, geopressured resources, and biomass and coal gasification.x Old Fields | Total | 1979 Proved Reserves | Total Remaining Resources As of December 31, 1981. Estimates are corrected for gas consumed since the date of resource estimate.x |
| U. S. Geological Survey | 1980 | 594 | 162 | 756 | 195 | 922 |
| National Academy of Sciences | 1974 | 530 | 118 | 648 | 195 | 717 |
| Exxon Base | 1974 | 342-942 | 56-321 | 423 – 1 143 | 195 | 502 – 1 202 |
| Potential Gas Committee | 1980 | 720 | 193 | 913 | 195 | 1 089 |
Table 7 presents salient statistics related to the gas industry in the United States for the period 1970-1981. Approximately 5 % of the gas consumed is imported, primarily from Canada. Some liquefied natural gas is imported from Algeria.
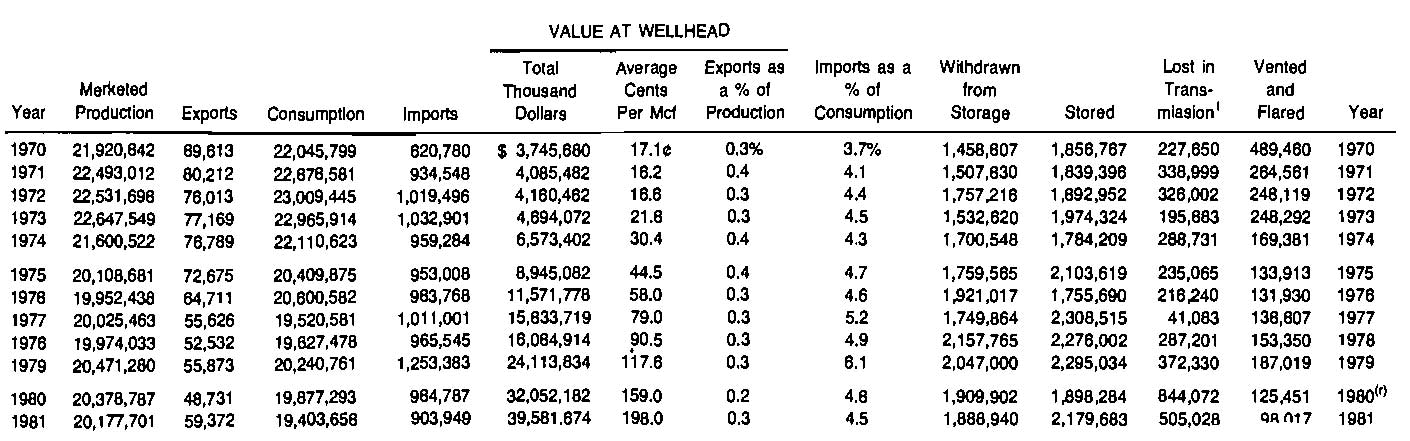
(1) – Also includes changes in above ground storage and gas unaccounted for;
(r) – Revised
Of the gas produced in the United States, almost 90 % comes from only five states. These are:
- Kansas;
- Louisiana;
- New Mexico;
- Oklahoma;
- and Texas.
The state of Louisiana is by far the largest producer, accounting for about 34 % of the total gas produced in the United States in 1981. Much of this gas is produced offshore. Table 8 lists the gas production by slates for the period 1972-1981.
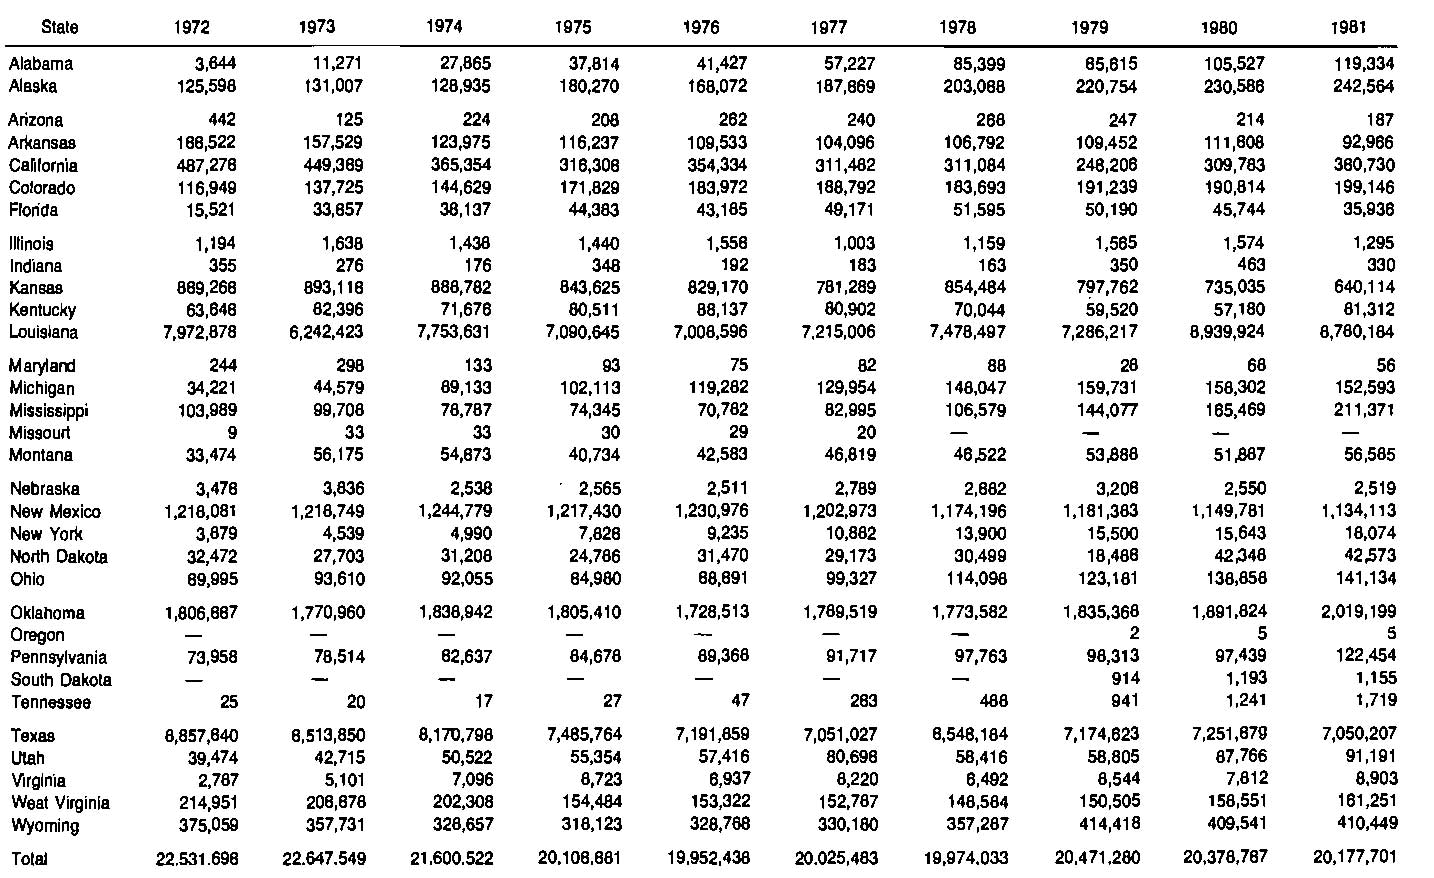
(1) – Marketed production of natural gas represents gross withdrawals less gas used for repressuring and quantities vented and flared
Consumption of natural gas is of course more evenly distributed among the states, with Texas being the largest consumer. Table 9 shows where the United States produced gas was used in the period 1977-1981.

(1) – Included with New Hampshire;
(2) – Included with Maryland;
(3) – Total includes 3 131 MMcf from Hawaii in 1980 and 2 899 MMcf in 1981;
(4) – Totals may not add due to independent rounding
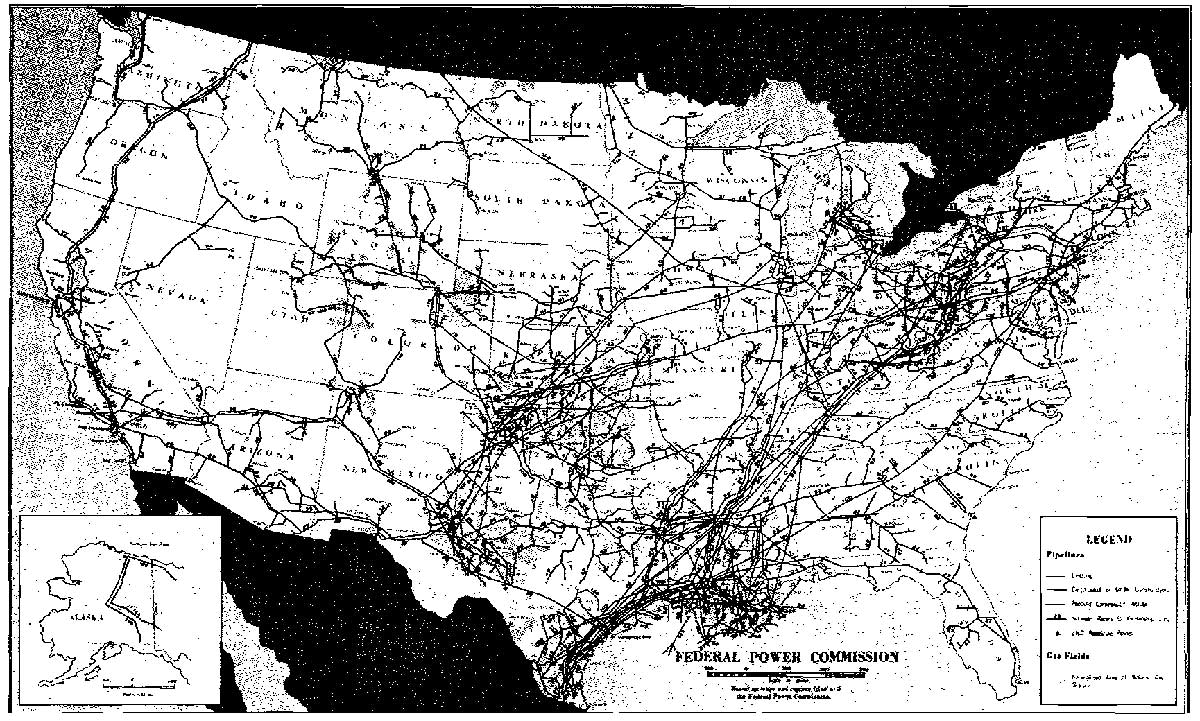
The large growth of the gas industry in the United States is attributable to the comprehensive transmission system that has developed since the late 1940’s. In 1977 the network of gas pipelines consisted of more than 250 000 miles and served almost 45 million gas customers. The pipeline grid is shown in Picture 2, and the distribution of pipelines and customers among the slates is listed in Table 10.

Geological Occurrence of Natural Gas
Certain requirements must be met for a commercial deposit of petroleum to exist. These are:
- A source; that is, material from which the petroleum is formed;
- Porous and permeable beds in which the petroleum may migrate and accumulate after being formed;
- A trap or subsurface condition restricting further movement so that it may accumulate in commercial quantities.
Natural gas and crude oil are generated from organic matter under the influence of increasing temperature and time. Both the type of organic matter and the temperature it experiences have a role in controlling whether oil or gas is formed. Organic matter can be divided into two broad categories depending on whether it was derived from organisms growing on the land surface or growing in water, that is, whether it is terrestrial or aquatic. It is generally thought that the terrestrial matter Fundamentals of Liquefied Natural Gasproduces natural gas and some waxy crudes, whereas aquatic material produces normal crudes.
This distinction is important in estimating the maximum depth to which crude oil or natural gas may occur. Rivers have played a critical role in transporting terrestrial material to the depositional environment. Therefore, deltas are very gas-prone depositional environments. The oldest and deepest sediments were deposited in the continental rift and are rich in terrestrial organic matter. They are overlain by increasingly marine sediments containing greater amounts of aquatic matter so that a vertical sequence develops with the gas-generating organic matter at the bottom and the oil-generating material at the top.
Modification by Migration and Burial
Oil and gas may be remobilized after it has formed in reservoirs. This secondary migration is most frequently caused by regional tipping and may lead to a marked separation of oil and gas. Gussow used the term “differential entrapment” for the case in which a full trap with a gas cap spills oil from the bottom into the next higher trap. This can lead to adjacent traps with gas, oil, or varying mixtures of the two. The gas-filled reservoirs can be down dip from the oil-filled reservoirs. The process is illustrated in Pictures 3 and 4.

As can be seen from Picture 4, natural gas can occur either associated or not associated with oil. Trap 1 in Picture 4 is a non-associated gas reservoir while Trap 2 is an associated gas reservoir; that is, the gas occurs as a gas cap in contact with crude oil. In some associated gas reservoirs, the oil exists as a thin rim at the bottom of the trap.

The temperature increase that accompanies increasing depth of burial has a major role in determining the composition of the trapped petroleum. Crude oils are not equilibrium mixtures, and as temperature increases the hydrocarbons readjust toward equilibrium at an increasing rate. This readjustment causes a redistribution of hydrogen, ultimately giving methane and a solid carbon-rich residue. The oil changes first to condensate, then to wet gas, and finally to dry gas. Gas developed in this manner is frequently associated with hydrogen sulphide and carbon dioxide.
Read also: Process of Liquefied Natural Gas regasification
Although the maximum temperature for oil to exist is fairly well established, the temperature and thus depth limitations on the Occurrence of natural gas have yet to be determined. Barker and Kemp have published the results of a computer study to determine this depth limitation and have found that under certain conditions methane can remain stable at depths beyond 40 000 ft. The amount of methane surviving is strongly influenced by reservoir lithology with fairly cool, clean sandstones being the most favorable reservoirs. It was found that methane has less stability in deep carbonates.
The Barker and Kemp study implies that natural gas may exist at depths greater than have been presently explored if porous and permeable reservoirs exist at these depths. Table 11 shows that considerable reserves may exist at depths between 15 000 and 30 000 ft.
| Table 11. Total Estimated Potential Supply of Natural Gas by Depth Increments as of December 31, 1982 (Trillion Cubic Feet) | |||
|---|---|---|---|
| Probable | Possible | Speculative | |
| Onshore (Drilling Depth) | |||
| Lower 48 States | |||
| less than 15 000 feet | 103 | 133 | 83 |
| 15 000 to 30 000 feet | 48 | 130 | 96 |
| 151 | 263 | 179 | |
| Alaska | |||
| less than 15 000 feet | 6 | 16 | 28 |
| 15 000 to 30 000 feet | – | – | – |
| 6 | 16 | 28 | |
| Total onshore | 157 | 279 | 207 |
| Offshore (Water Depth) | |||
| Lower 48 States | |||
| less than 200 meters | 30 | 41 | 30 |
| 200 to 1 000 meters | 3 | 22 | 23 |
| Alaska | |||
| less than 200 meters | 2 | 13 | 59 |
| 200 to 1 000 meters | – | – | 10 |
| 2 | 13 | 69 | |
| Total Offshore | 35 | 76 | 122 |
| Total Lower 48 States | 184 | 326 | 232 |
| Total Alaska | 8 | 29 | 97 |
| Total United States | 192 | 355 | 329 |
Characteristics of Natural Gas
Natural gas is a mixture of hydrocarbon gases with some impurities, mainly nitrogen (N2), hydrogen sulphide (H2S), and carbon dioxide (C02). Gases containing significant amounts of H2S or CO2 or both are called sour or acid gases. These impurities must be removed before the gas is used as a fuel. The hydrocarbon gases are:
- Methane;
- Ethane;
- Propane;
- Butanes;
- Pentanes;
and small amounts of:
- Hexanes;
- Heptane’s;
- And some heavier fractions.
In gas used for fuel, methane is the largest component, usually 95 to 98 %.
Natural gas is normally considered to be a mixture of straight chain or paraffin hydrocarbon compounds. However, occasionally cyclic and aromatic compounds occur in a natural gas. The molecular structures of some of these are shown in Picture 5.
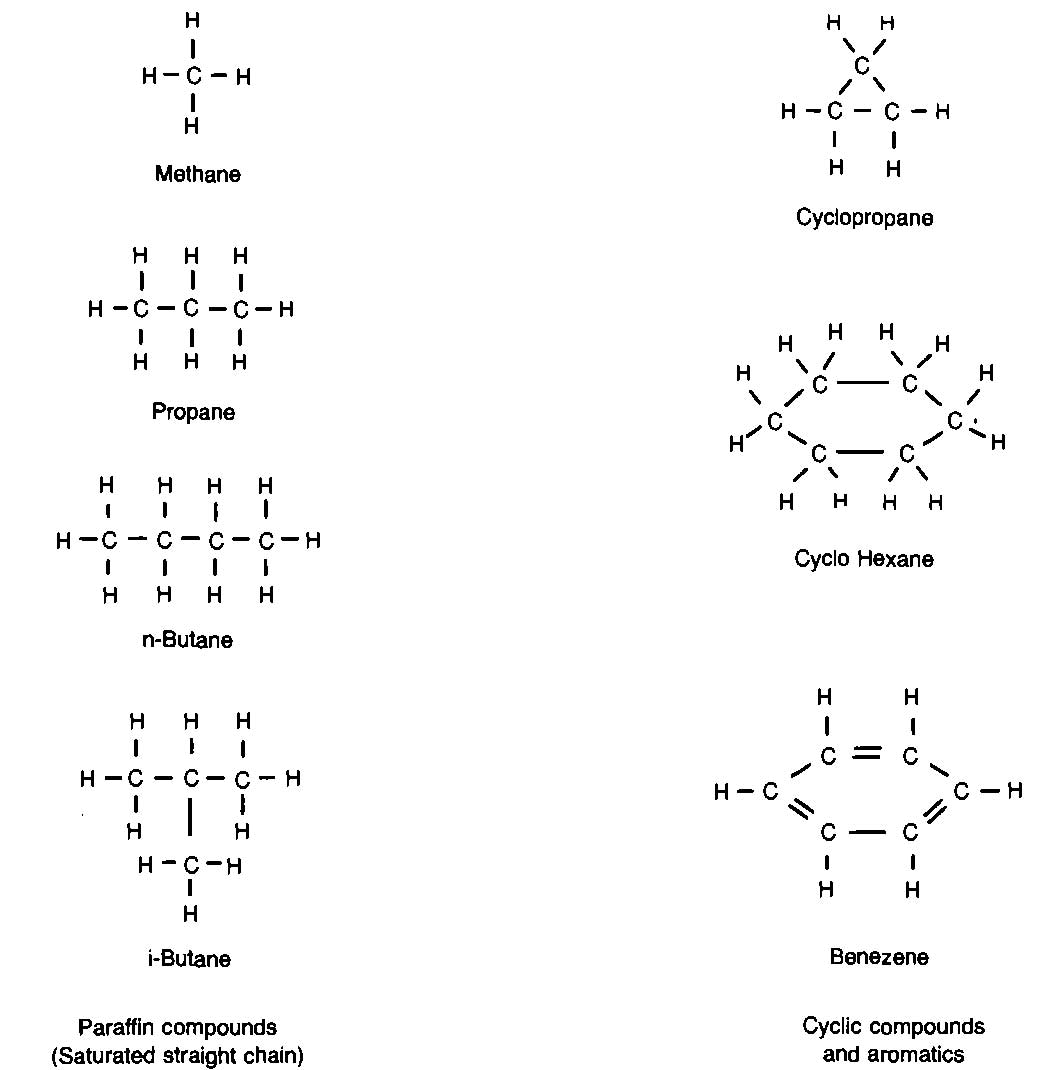
The general formula for the paraffin hydrocarbons is CnH2n+2, where n is the number of carbon atoms.
Gas Composition
The actual composition of a natural gas can vary over wide ranges. Even two gas wells producing from the same reservoir may have different compositions. Table 12 shows typical hydrocarbon compositions of the gas produced from different types of reservoirs. The composition of the gas produced from a given reservoir may change with time if liquids condense in the reservoir as pressure declines. This occurs in a so-called retrograde condensate reservoir.
| Table 12. Typical Natural Gas Compositions | ||||
|---|---|---|---|---|
| Mol Percent | ||||
| Component | Symbol | Associated Gas | Wet Gas | Dry Gas |
| Methane | C1 | 27,52 | 59,52 | 97,17 |
| Ethane | C2 | 16,34 | 5,36 | 1,89 |
| Propane | C3 | 29,18 | 4,71 | 0,29 |
| i-Butane | i-C4 | 5,37 | 2,03 | 0,13 |
| n-Butane | n-C4 | 17,18 | 2,39 | 0,12 |
| i-Pentane | i-C5 | 2,18 | 1,80 | 0,07 |
| n-Pentane | n-C5 | 1,72 | 1,61 | 0,05 |
| Hexane | C6 | 0,47 | 2,60 | 0,04 |
| Heptane’s Plus | C7+ | 0,04 | 19,98 | 0,24 |
| 100,00 | 100,00 | 100,00 | ||
Although natural gases contain small fractions of hydrocarbon components much heavier than heptane, most analyses group all of the heavier components into a category called Heptane’s plus or C7+. Table 13, from Katz lists, some of the components of petroleum and the commercial products that contain these components. Only the constituents in the range of condensate well effluents and lighter will be considered in this text.
| Table 13. Constituents of Petroleum | |||||||||||
|---|---|---|---|---|---|---|---|---|---|---|---|
| Name | Formula | Product of Commerce Containing Constituent | General Range of Constituents in Field Stream | ||||||||
| Methane | CH4 | Natural gas | Dry gas | Field separator gas | Gas condensate well effluent reservoir gas phase | Crude oil well effluent | |||||
| Ethane | C2H6 | Natural gas | |||||||||
| Propane | C3H8 | Natural gas, propane | Stock-tank condensate | LP gas | |||||||
| Isobutane | i-C4H10 | Natural gasoline, butane | Stock-tank crude oil | Natural gasoline | |||||||
| n-Butane | n-C4H10 | Natural gasoline, motor fuel, butane | |||||||||
| Pentanes | C5H12 | Natural gasoline, motor fuel | Debutanizaed condensate | ||||||||
| Hexanes | C6H14 | Natural gasoline, motor fuel | |||||||||
| Heptane’s | C7H16 | Natural gasoline, motor fuel | |||||||||
| Octanes | C8H18 | Natural gasoline, motor fuel | |||||||||
| Decanes | C10H22 | Motor fuel | |||||||||
| Tetradecane | C14H20 | Kerosene, light furnace oil | |||||||||
| Hexadecane | C16H34 | Mineral seal oil, furnace oil | |||||||||
| Triacontane | C30H62 | Light lubricating oil, heavy fuel oil | |||||||||
| Tetracontane | C40H82 | Lubricating oil, heavy fuel oil | |||||||||
| Asphaltene | C60H182+ | Asphalt, road oil bunker fuel oil | |||||||||
Other Sources of Gaseous Fuel
Alternatives to conventional sources of natural gas are importation of liquefied natural gas, substitute natural gas, coal gasification, and gas from shale reservoirs. The technology required for handling and transporting these gases once they are produced is essentially the same as for natural gases.
Liquefied Natural Gas. Liquefied natural gas (LNG) is essentially methane that is liquefied at atmospheric pressure by cooling it to – 260 °F. The phase change reduces the volume by 623:1, and approximately 15 % of the energy is consumed in the phase change. Most of the LNG imported into the United States comes from Algeria and is transported in large tankers that hold approximately 750 000 barrels of LNG. This is equivalent to about 2,5 Bcf of gas.
Coal Gasification. Synthetic gas from coal has been investigated in several pilot plants in the United States, but the commercial viability has not been demonstrated. The gas derived from coal is usually low in heating value as compared to natural gas.
Substitute Natural Gas. Substitute natural gas (SNG) can be made from liquid petroleum feedstock such as:
- Naphtha;
- Crude oil;
- Propane and;
- Butane.
Facilities exist for this process, but the Liquefied Natural Gas Projects, calculation of the cost of gas productioncost is extremely high in comparison to natural gas at its present price. SNG may well become economical in the near future as demand for all forms of energy increases.
Gas from Devonian Shale. Gas from Devonian shale formations is a potential source of gaseous fuel that could be extracted from an area of approximately 250 000 square miles of formations underlying the middle and eastern portions of the United States. Massive fracturing, advanced recovery techniques, and a higher price for the gas will have to occur before this source contributes a substantial amount of energy to the United States.
Tight Formation Gas. Gas from very low permeability formations is being produced from deposits in the Rocky Mountain states of the United States. In order to recover this gas in commercial quantities, some method is required for increasing the flow capacity of the wells. One method is to fracture the formation with a nuclear blast, but so far this technique has not proved feasible. The other method is massive hydraulic fracturing, which is the subject of much research of the present time. If either of these stimulation techniques can be perfected, recovery of the gas in place could reach 40 to 50 %.
Gas from Geopressured Aquifers. High pressure brine in geopressured aquifers may contain 30 to 40 scf of natural gas per barrel of water. In the United States, these aquifers are located in a band that extends from Florida to Texas along the Gulf of Mexico. Estimates of the gas in place range from 1 000 to 3 000 Tcf, but in 1981 no commercial method of recovering this gas had been developed.
Gas Production Operations
The engineer involved in gas production operations has one principal objective: to move the gas from some location in an underground reservoir to a pipeline that may be used to transport it to its final destination. Picture 6 shows that this involves moving the gas through a porous medium or rock formation, to the surface through casing or tubing, to separation facilities through a surface piping system, through a compressor if one is necessary to maintain sufficient flow rates, and finally through a surface line to the point of utilization.

The engineer in charge of this operation must understand both reservoir engineering and production engineering concepts, as both are included in the total producing system. He must be able to determine the gas recoverable in a reservoir and the time that will be required to recover the gas. This requires analysis of individual well performance and how this performance changes as gas is depleted from the reservoir and pressure declines. He must be capable of determining the relationship between flow rate and pressure drop in all parts of the system, the rock as well as all segments of the piping system. As pressure declines he must be able to determine the size and power of compression required to maintain production rates, and to handle liquids that form in the system, both condensate and water. All of the above design considerations require accurate values for flow rate through the system, which means that the engineer must be familiar with accurate methods to measure flow rates.
Since demand often exceeds producing or transportation capacity during the winter months, the engineer may be required to determine the most feasible method for storing gas until it is needed. This requires the calculation of the efficiency with which gas displaces water in aquifers and the performance of injection wells.
The following articles contain the technology to handle all of these engineering problems. Each component of the system is treated individually and then combined for a total system analysis. Numerous example calculations are made in order to clarify the application of the theory presented. Although some operations involved in the gas industry are not covered, such as unsteady state flow in pipelines and highly fractured reservoirs, the technology for handling day-to-day gas production operations is included in a complete and practical form.