In case of loss of insulation on a ship, you would need to refer to the specific maritime regulations and guidelines that apply to insulation standards for ships.
- Study 1
- IGC code Pressure Relief Valve (PRV) sizing
- Moss Rosenberg LNGC relief valve sizing considering pure methane conditions
- IGC code PRV required capacity
- Physical sizing of pilot-operated, Pressure Relief Valves (PRV)
- Choked flow
- Extrapolating fire conditions against PRV valve sizing
- Total relieving capacity of cargo containment system
- PRV capacity at maximum back pressure
- Moss type LNG carrier – response to over-pressure conditions
- Study 2
- Résumé
- Selected relief valve
- Cargo
- Maximum cargo tank size
- Over pressurization of cargo tank due to fire
- Increase in relief valve capacity due to over pressurization
- Existing ship
- Results
Ensure that any replacement insulation meets the required safety and performance standards for marine applications. It’s important to follow the appropriate maritime codes and standards to address insulation issues on a ship effectively.
Study 1
IGC code Pressure Relief Valve (PRV) sizing
To comply with the requirements outlined in the International Code for the Construction and Equipment of Ships Carrying Liquefied Gases in Bulk (IGC Code), each cargo tank used for the carriage of LNG must be outfitted with a pressure relieving system providing protection from over-pressure scenarios.
Each tank shall be outfitted with pressure relieving valves, with a combined total capacity sufficient to ensure that the cargo tank vapour pressure does not increase more than 20 % above the maximum allowable relief valve setting under fire conditions.
Typically, the relief valve setting pressure on LNG carriers is set at 250 mbar (gauge). Therefore, a 20 % increase above this set pressure would result in a maximum allowable tank operating pressure of 300 mbarg.
The procedure and formulae used when determining the correct capacity and size of the pressure relief valve(s) is stipulated in Chapter 8.5 of the IGC code. The output of the formula, equates to the amount of free air volume requiring release when the containment system is exposed to fire conditions.
The IGC code sizing formula is based on:
- Q – Equivalent air flow of free air, at 273 Kelvin, 1,013 bar absolute (Nm3/hr);
- G – Gas factor;
- A – External surface area (m2);
- F – Fire factor (as per definitions below).
| 1,0 | Tanks without insulation located on deck. |
| 0,5 | Tanks above deck with insulation. |
| 0,5 | Uninsulated independent tanks installed in holds. |
| 0,2 | Insulated tanks in holds. (Moss Rosenberg) |
| 0,1 | Insulated independent tanks in inerted holds. |
| 0,1 | For membrane or semi membrane tanks. (GTT Membrane) |
Actual data from a sample 140 000 m3 Moss Rosenberg LNG Carrier has been used to assist with generating realistic outputs from the formulas within this document. The design base is five spherical Cargo equipment for gas carriers carrying LNG/LPGcargo tanks, externally insulated to restrict heat ingress, independently housed within a sealed hold space containing inert gas. The maximum liquid loading capacity would be 99,5 % of the total volume, thereafter reducing by 0,15 % per day of cargo carriage.
Moss Rosenberg LNGC relief valve sizing considering pure methane conditions
- A – external surface area.
The surface area of a sphere can be equated from:
- Typical internal diameter of Moss Rosenberg cargo tank = 36 metres;
- total wetted surface area (100 %) = 4072,032 m2.
This total calculated surface area is further reduced according to the amount of heat that is absorbed during exposure to fire conditions. Based on research conducted while developing and updating, among other standards, API 2000 recommended practices, compound curves relating to the amount of specific heat flow against external surface area where produced. This early research was used when producing the IGC code.
From these curves, the exponent of 0,82 is applied to the calculated total external surface area in an attempt to closely represent the actual exposure conditions experienced in fire engulfing scenarios.
Additionally, the vessel’s hull further protects the lower hemisphere of the cargo tanks for the heat produced during fire scenarios and a steel weather cover gives protection to the upper hemisphere. The weather cover is additionally protected by a salt-water deluge system that drenches the external surface area with a film of water, restricting the amount of radiant heat absorbed. The lower hemisphere is protected by the presence of the surrounding seawater up to the vessel’s draft level, the vessel’s side ballast tanks and the supporting skirt arrangement of each individual cargo tank.
Unlike non-refrigerated tanks, where a maximum amount of specific heat influx can be achieved and vapour generation stabilized, refrigerated tanks usually contain liquids close to their boiling point. As the cargo is at boiling point, any heat influx will continue to produce significant quantities of generated vapour until either the cargo tank becomes empty of liquid or the fire is extinguished.
From the above, the surface area exposed to fire conditions can be taken as:
- A = 4072,0320,82 = 912,1 m2;
- F = Fire factor.
Fire factors give allowance for the inherent protection offered by the vessel’s structure and protection of the cargo tanks internal wetted surface areas from exposure to fire conditions. In this case, Moss Rosenberg type vessels can use the multiplier of 0,2 as their cargo tanks are carried in independents hold spaces and the exterior to the cargo tanks’ surfaces are insulated to reduce heat gain into the stored cryogenic liquid.
It can be further debated whether this value should be reduced to 0,1 as the air space within the cargo tank hold (between outside of insulation material and inside of weather cover) is maintained in an inerted condition with nitrogen gas when the vessel is in active service.
In accordance with IGC Code for independent tanks partly protruding through the open deck, the fire exposure factor should be determined on the basis of the surface areas above and below the deck. In the case of a Moss type independent tank, the dome protrudes through the tank cover. This portion of the tank is protected by fire proofing insulation approved by the administration, so for this portion of the tank the correct fire exposure factor is 0,5. Accordingly, the overall fire exposure for the tank must be calculated as follows:
Where:
- A1 – is the area of the dome;
- A2 – is the tank area minus the dome area.
However, it should be noted that A1 is less than 1 % of A2, so for the purpose of this study, the fire factor.
- F – has been taken as: 0,2;
- G – Gas factor.
The Gas factor is calculated using a supporting formula within the IGC Code sizing section 8.5. This formula takes into account the physical characteristics of the vapour being released at actual relieving conditions. Also included within this formula is the specific heat flux that will be applied to the exposed surface area.
The IGC Code has adopted the empirical data used by both the American Petroleum Institute (API) and the Compressed Gas Association (CGA) with regards to maximum radiant heat generated when exposed to pool fires. The maximum specific heat flux value has been taken as 71 kW/mtr2 when developing the below formula, this being the average value over exposure time over the entire tank area, rather than the peak value at a single location.
As it is standard engineering practice to size pressure relief valves on worst case relieving conditions, pure methane has been used to represent the liquid being carried. However, actual operational conditions would involve carriage of a liquid with less vapour generating characteristics.
| Pure Methane | L | D | Z | T | M | k | G |
| 1,3 bar – 158,4 °C | 507 | 0,680 | 0,960 | 114,6 | 16,04 | 1,372 | 0,094 |
- L – Latent heat of material being vaporised, (kJ/kg);
- T – Temperature at relieving conditions, (Kelvin);
- D – Constant based on specific heat ratio k);
- Z – Compressibility factor of gas being relieved;
- M – Molecular mass (kg/kmol);
- G – 0,094.
IGC code PRV required capacity
As per the IGC Code, pressure relief size when considering «pure methane»:
Total Air Equivalent Relief Capacity required = 17,15 Nm3/sec (79,922 kg/hr). (Density of air at relieving conditions 1,293 kg/m3).
The pressure relieving system must provide adequate capacity to relieve the above calculated value and take into account the physical layout of the discharge piping systems and any back pressure, superimposed or build up, which may affect the relieving capacity of the pressure relief valves.
It has become standard practice on LNG carriers to install pilot-operated, pressure relief valves for this duty, which sense the internal tank pressure and are less affected by «superimposed» back-pressure, and its associated effects of valve lift and chatter, than conventional spring types. Superimposed back pressure is the pressure on the outlet side of the valve before operation.
However, «build up» back-pressure resulting from friction or sonic flow, is applicable and must be considered and accounted for.
Physical sizing of pilot-operated, Pressure Relief Valves (PRV)
Using the sizing formula from a typical PRV manufacture (Fukui Seisakusho Co.), that is based on formulas and guidance taken from applicable API standards, it is possible to calculate the mass flow of free air at the relieving condition stipulated by the IGC Code, ie air at STP.
Additionally, the IGC value represents the combined total capacity of the installed LNG Carrier Pressure Relief Systemspressure relief system on each cargo tank and gives allowance for the capacity to be covered by two PRV valves sized to 50 % of this total capacity.
Where:
- Q – Relieving capacity (kg/hr);
- A – Orifice area of PRV (cm2) (inlet orifice 759,644 cm2);
- K – Coefficient of discharge (manufacturer supplied data);
- P1 – Relieving set point pressure (Patm + (Pset + 20 %)) (bar a);
- P2 – Back pressure (bar a) (Limited to 50 % of set pressure);
- k – Ratio of specific heat;
- T – Flowing (relieving) temperature (Kelvin);
- M – Molecular Weight (kg/kmol);
- Z – Compressibility Factor;
- Pset – Set Pressure (barg);
- Pacc′ – Accumulation pressure allowance = Accumulation pressure allowance = Pset + 20 %;
- B – Ratio of P2/P1.
Air density at relieving conditions (1,293 kg/m3).
| The below tabulated figures form the basis of the IGC code PRV relief requirement | ||||||||||
|---|---|---|---|---|---|---|---|---|---|---|
| Vapour | B | K | P1 | P2 | Patm | Pset | Z | T | M | k |
| Air @ STP | 0,8858 | 0,7869 | 1,313 | 1,138 | 1,013 | 0,250 | 1,0 | 273 | 29 | 1,4 |
When sizing PRV valves the effects of back pressure on capacity should be assessed. Back pressure is the summation of both «superimposed» and «build» up back pressures caused by the discharge header conditions of length and pressure.
Superimposed back pressure is the pressure present downstream of the PRV before operation. The PRV valves used on LNG vessels are of the pilot operated type, which are less affected by any downstream pressure as their activation is independent of the valve’s outlet pressure.
Build up back pressure is a summation of frictional, sonic and turbulent flows in the PRV discharge piping system. Following guidance in IMO standards, it is advised that the build up back pressure in the downstream piping should not rise above 50 % of the PRV setting pressure. Therefore, for LNG service using 0,250 bar as the set pressure, 50 % would give 0,125 bar + atmospheric pressure of 1,013 bar would give a maximum build up pressure of 1,138 bar a.
Using the manufacturer’s sizing equation, the above values and the maximum allowable back pressure of 1,138 bar, the mass flow rate per valve equals.
- Q – 47,000 kg/hr (for a 300 mm inlet and 400 mm outlet PRV);
The installation of two 300 mm inlet PRV on the 36 metre diameter spherical cargo tank would provide the required over-pressure protection as stipulated by the IGC code during exposure to fire conditions at worst case back pressure levels when considering a set pressure of 0,25 bar.
Required QIGC = 79,922 kg/hr, available QPRV = 95,000 kg/hr.
Choked flow
A further check is needed to ensure this mass flow remains below the choked flow of the outlet system. For a single phase flow choking occurs where the velocity of the gas is equal to the sonic velocity. The flow rate is absolutely independent of the discharge pressure provided this pressure remains below the choked pressure.
To calculate the choked flow the following critical flow formula can be applied:
Where:
- P1 – Inlet or upstream pressure, in this case 0,250 bar + 20 % accumulation allowance + atmospheric pressure = 1,313 bar a;
- k – Isentropic exponents at valve inlet, for air at STP conditions, k = 1,400.
From the standard formula for critical pressure, the critical pressure value would be 0,694 bar, corresponding to an inlet pressure of 1,313 bar and specific heat ratio of 1,4.
Therefore P1 can only be 1,89 times (1,313/0,694 = 1,89) greater than the pressure in the discharge header. If P1 is more than 1,89, critical flow would occur.
Read also: Contingency Plans for Liquefied Natural Gas Carrier
It is important to note that, although the gas velocity reaches a maximum and becomes choked, the mass flow rate is not choked. The mass flow rate can still be increased if the upstream source pressure (P1) is increased.
Extrapolating fire conditions against PRV valve sizing
The IGC Code PRV sizing formula allows reductions in the anticipated fire exposure due to differing levels of protection offered by varying design of cargo containment systems and the type of cargo tank involved.
he previous calculations were based on a fire factor of 0,2, this representing an insulated cargo tank installed within a hold space exposed to the radiant heat of an adjacent fire.
To assess the amount of additional vapour generated if the external cargo tank insulation was lost or became degraded, the fire factor can be increased to 0,5 to represent this scenario. However, it must be noted that it is extremely unlikely that total loss of the cargo tank insulation would occur as the damage would be restricted to a relatively small area due to the protection of the hull steelwork, ballast and hold spaces, particularly at the lower portions of the cargo tank.
Therefore, using a fire factor of 0,5 for the entire surface area of the cargo tank must be considered as an absolute extreme case.
Using the original IGC sizing formula to predict the increase in capacity required:
- New capacity = 42.87 Nm3/s (199,550 kg/hr).
Total relieving capacity of cargo containment system
From figure 1 it can be seen that three over pressure relieving options are available and applicable on Moss Rosenberg type LNG Carriers.
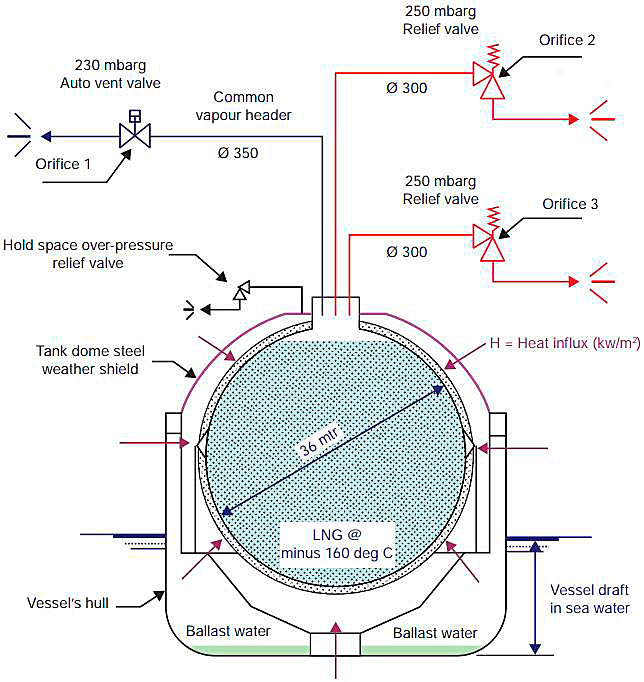
Therefore, the overall relieving capacity of a single tank is dictated by the maximum release capacity of the tank pressure control valve (orifice area 1) situated in the common vapour header and the combined capacity of the two pressure relieving valves (orifice area 1 and 2).
The capacity of each of the 300 mm or 12′′ diameter pressure relief valves, when operating at the maximum allowable tank pressure of 300 mbar g (Pset + 20 % accu′) and maximum allowable back pressure of 1,138 bar has been calculated as being 47,500 kg/hr per valve. (Orifice 2 & 3).
The relieving capacity of the attached 350 mm or 14′′ diameter common vapour header (Orifice area 1) can be calculated using the same manufacturer’s sizing formula with P1 of 1,313 bar and P1 of 1,138 bar. This outlet allows for a further discharge rate of 60,200 kg/hr.
| PRVSize | Orifice Area | Flow Capacity | |
|---|---|---|---|
| Orifice 1 (Vapour header pressure control) | 350 mm 14′′ | 962,11 cm2 | 60,200 kg/hr |
| Orifice 2 (No 1 Relief Valve) | 300 mm 12′′ | 759,64 cm2 | 47,500 kg/hr |
| Orifice 3 (No 2 Relief Valve) | 300 mm 12′′ | 759,64 cm2 | 47,500 kg/hr |
| Totals | 2481,39 cm2 | 155,200 kg/hr |
When considering a single 36 m diameter Moss Rosenberg cargo tank layout, the total relieving capacity available while remaining within the MAWP stipulated by the IGC Code would equate to:
This available capacity is almost double the requirement stipulated by the IGC Code under exposure to fire conditions represented by a 0,2 fire factor, which required a release capacity of 79,922 kg/hr.
However, when using an extreme fire factor of 0,5 the required release capacity of 199,550 kg/hr is needed, this being in excess of the capacity available at the maximum allowable working pressures stipulated by the IGC code.
To achieve the required capacity, the inlet pressure to the PRV valves needs to increase, which in turn gives a higher back pressure allowance and a greater relief capacity.
The following cases represent the increase in cargo tank pressure required to achieve the increased capacity imposed by using a fire factor of 0,5.
| Vapour | B | K | P1 | P2 | Patm | Pset | Z | T | M | k |
| Air @ STP | 0,8304 | 0,7869 | 1,533 | 1,273 | 1,013 | 0,520 | 1,0 | 273 | 29 | 1,4 |
Case 1 – tank pressure increased to 1,533 bar absolute (0,520 barg).
| Vapour header outlet (orifice area 1) | 77,450 kg/hr |
| PRV 1 (Orifice area 2) | 61,150 kg/hr |
| PRV 2 (Orifice area 3) | 61,150 kg/hr |
| Total | 199,750 kg/hr |
MAWPIGC – 300 mbar, above condition requires 220 mbar additional tank pressure.
Case 1 used all three relief possibilities, Case 2 assess the increase in tank pressure required to achieve sufficient capacity using the PRV valves only.
| Vapour | B | K | P1 | P2 | Patm | Pset | Z | T | M | k |
| Air @ STP | 0,7342 | 0,7869 | 2,163 | 1,588 | 1,013 | 1,150 | 1,0 | 273 | 29 | 1,4 |
Case 2 – tank pressure increased to 2,163 bar a (1,15 barg) (PRV valves only):
| PRV 1 (Orifice area 2) | 101,000 kg/hr |
| PRV 2 (Orifice area 3) | 101,000 kg/hr |
| Total | 202,000 kg/hr |
MAWPIGC – 300 mbar, above condition requires 850 mbar additional tank pressure.
The cargo tank over pressures calculated above remains well within the maximum pressure capabilities of the cargo tank structure.
To ensure both of the above conditions do not cause choked flow to occur in the PRV discharge header system, the following equation can be used to determine if critical flow conditions exist. If the pressure ratio across the PRV is less than, or equal to, the ratio of the specific heat, critical flow will occur representing the maximum velocity of flow.
Case 1
The calculated critical pressure ratio for case 1 equates as 0,830. As this figure is greater than the specific heat ratio of 0,528, choked or critical flow will not occur.
Case 2
The calculated critical pressure ratio for case 2 equates as 0,734. As this figure is greater than the specific heat ratio of 0,528, choked or critical flow will not occur.
PRV capacity at maximum back pressure
The graphical representation below plots a theoretical increase in cargo tank pressure (P1) against the maximum allowable back pressure (P2) and records the calculated mass flow rate of a single PRV.
It can be seen from the chart that increasing the internal tank pressure to 2,163 bar, as required in case 2, is well within the reliving capacity of the valve.
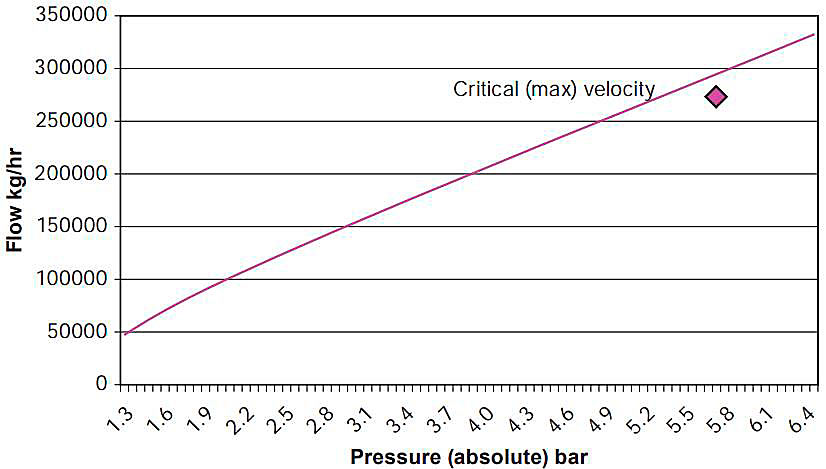
To be noted is the inlet pressure required to reach choked flow, this representing a pressure in the region of 5,3 bar absolute (4,3 bar Gauge).
Moss type LNG carrier – response to over-pressure conditions
With reference to Figure 4 – Cargo Piping Layout, it can be seen that all of the LNG cargo tanks are interconnected via a common vapour header. Each tank is individually connected to this common header via a manually operated, full-bore, butterfly valve, which remains in the fully open position while the vessel is in normal service conditions.
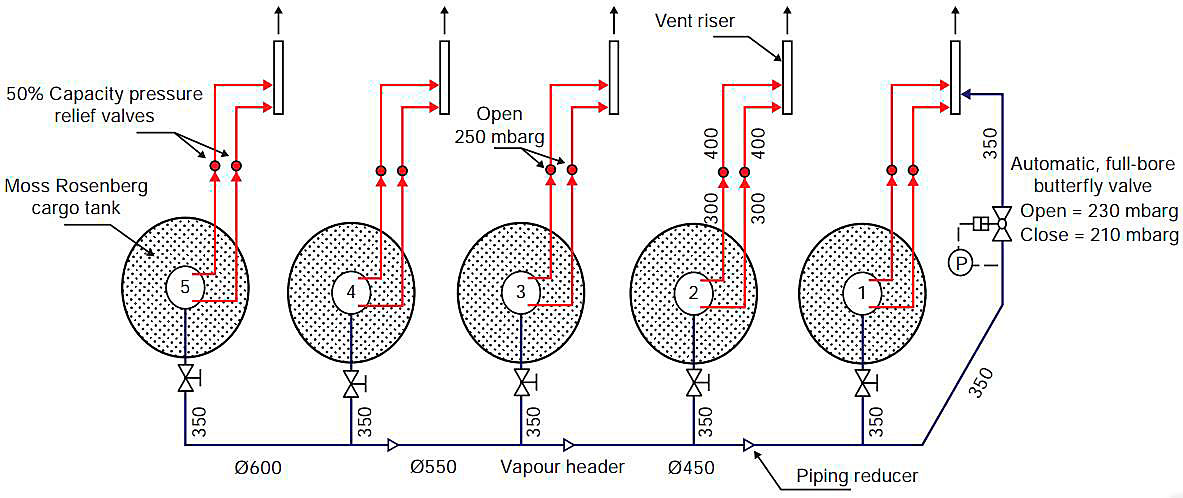
Having all cargo tank vapour spaces interconnected allows a common vapour pressure control strategy to be maintained throughout the cargo tanks, assisting with the vessel’s standard operations and its ability to burn boiled off gas (BOG) in its main propulsion, dual fuel fired, steam generating boilers or diesel engines.
Any upset witnessed to the vessel’s cargo tank vapour pressure becomes evident with a rise in vapour header pressure. The primary way of controlling any increases in tank pressure is via the vessel’s inherent ability to burn the generated BOG in the main propulsion boilers. (Some LNG carriers have the ability to reliquify the BOG and return it back to the cargo tanks, this would be considered their primary BOG control system, with a back up provided by a gas combustion unit that safely burns excess BOG).
In low steam load conditions, the vessel’s steam plant has the ability to artificially increase the steam demand, allowing excess BOG to be consumed, generating the maximum possible quantity of steam, then dumping this steam to a seawater cooled condenser where it is cooled back into a liquid state and returned to the feed system.
If in the unusual case that the vessel’s boilers were unable to consume the generated BOG, the common vapour header pressure would continue to increase over an extended time period. This header pressure is continuously monitored by the vessel’s safety systems and used as a set point for the tank pressure safety control valve, situated at the forward end of vapour header.
This automated control valve is set to fully open when the header pressure increases above 230 mbarg, and remains in this open position until the combined cargo tank pressure, and hence the vapour header pressure, has decreased to 210 mbarg.
In the event of the cargo tank pressure continuing to rise, possibly due to the vessel being unable to burn the quantity of BOG being generated, the combined tank vapour pressure would continue to rise until the pressure relieving valves, as defined in the IGC code, became active. It is an extremely rare event if an LNG carrier’s pressure relief valves are activated and it should not be considered as standard operational practice.
Depending on the scenario, the effected tank pressure would increase reaching a maximum allowable value of 250 mbarg, when the pilot operated relief valves would fully open, releasing the over pressure to atmosphere via a specifically designed, individual vent mast until the pressure has reduced to 230 mbarg, when the valve would reseat.
It should be noted and considered that the cargo tanks remain physically interconnected via the common vapour header throughout all scenarios. Therefore, any scenario causing a rapidly increasing pressure would cause all, in this case ten, relief valves to open simultaneously, effecting an equally rapid reduction in pressure.
Study 2
Résumé
During discussion at working group meetings, the task «Simplified reapplication of the IGC Code formula for loss of insulation» was requested to be considered. The requirements of the IGC Code have been applied with regard to the installation of a standard design relief valve of the size that would normally be fitted to a Moss design LNG gas carrier.
The results obtained have been to:
- Determine the maximum size of cargo tank that the relief valve can protect at the standard set pressure of 250 mbar, plus 20 % rise, in accordance with Chapter 8 of the IGC Code;
- determine the actual relief valve flow rate at the maximum size cargo tanks allowable over-pressure of 2 barg. Use this additional capacity to recalculate the fire exposure factor;
- by utilising an actual Moss LNG gas carrier, fitted with the same design and size of relief valves, determine the capacity at the allowable over-pressure of 2 barg. Again, use this capacity to recalculate the fire exposure factor.
The common vapour header, which is in use during normal operation and so interconnects all cargo tanks, has been considered for both venting through the control valve into the forward vent mast and allowing equalization between tanks when one Safety, Risks and Security Aspects in Liquefied Natural Gas Industrytank is subject to a heat flux from a fire load. The results show that the constrictive inlet pipe to the forward vent mast would restrict the flow due to choke pressure (sonic flow) occurring. The connection between each cargo tank and the common vapour header would be the element restricting other cargo tank relief valves from operating at their maximum capacity.
Selected relief valve
The relief valve selected is a Fukui Seisakusho Co., Ltd (FKI), Type PSL-MD13-131-NS1, with a 12′′ inlet size and 16′′ outlet size. The orifice area of the valve is 759,6 cm2. The supply to the pilot valve is taken directly from the cargo tanks and not from the inlet flange of the valve.
This design of relief valve has been approved by:
- UV;
- NKK;
- DNV;
- BV;
- GL;
- RINA;
- and LR.
Further details of the relief valve are shown in the FKI brochure, which forms appendix one.
In accordance with the IGC Code, a minimum of two relief valves, each sized at 50 % of the required capacity, has been considered.
Cargo
It is proposed that the worst-case cargo needs to be considered and so pure methane has been taken as the referenced cargo. While most LNG cargoes have a methane content between 90 % and 95 %, it should be noted that the constituents of Alaskan LNG is:
- 99,5 % methane;
- 0,4 % nitrogen;
- and 0,1 % ethane.
Maximum cargo tank size
Using the formula provided by FKI, the maximum flow rate of the relief valve was calculated. With the valve having a set pressure of 0,25 barg, including the allowable 20 % rise in operating pressure the capacity was calculated at 1,31325 bar a. The value obtained for air for two relief valves being: 31,506 m3/s.
Where:
- W – Valve capacity (kg/h);
- A – Valve orifice area (cm2);
- Kd – Coefficient of discharge;
- M – Molecular weight;
- Z – Compressibility factor.
Where:
- k – Ratio of specific heats;
- C – Coefficient determined by specific heats.
- Kb – Correction factor – constant back press;
- P1 – Actual relieving pressure (bar a);
- P2 – Back pressure – ambient pressure (bar a).
This value was the design flow rate through the valve but did not take into consideration the effects of the pressure losses due to the inlet (upstream) pipework to the valve and the pressure loss in the discharge (downstream) lines through to the vent mast and out to atmosphere. Using standard designs of inlet pipework and commoned discharge headers, the actual maximum flow rate for air was then calculated. The value obtained for two relief valves being: 28,146 m3/s.
Using the above value of 28,146 m3/s and the formula provide in Section 8.5 of Chapter 8 of the IGC Code, the maximum tank area and diameter was determined using a gas factor for pure methane. The values obtained being; area of 7,419 m2, which equates to a diameter of 48,6 m.
Where:
- G – Gas factor for cargo at relieving conditions;
- L – Latent heat of cargo at relieving pressure;
- D – Constant based on relation of specific heats;
- Z – Compressibility of gas at relieving pressure;
- T – Absolute temperature at relieving pressure;
- M – Molecular mass of product.
Where:
- A – External surface area of tank (m2);
- Q – Minimum required discharge of air (m3/s);
- F – Fire exposure factor (see list below);
- G – Gas factor.
Over pressurization of cargo tank due to fire
Using the maximum cargo tank the effects of over pressurization of the cargo tank were considered. Guidance was obtained from Moss Maritime on the actual over-pressure that the cargo tank could be subject to at design conditions.
The details provided were:
| Design allowable vapour pressure | 2,0 barg |
| Over-pressure before deformation | 3,5 barg |
| Over-pressure before yield point | 5 – 6 barg |
| Over-pressure before tensile failure | 8 – 9 barg |
It was confirmed that the above pressures would be applicable to any size of cargo tank as the scantlings of the shell plate are sized for the tank’s actual diameter.
Increase in relief valve capacity due to over pressurization
Having now fixed the maximum size of cargo tank at 48,6 m, the effect of over pressurization and the subsequent increase in relief valve capacity was considered.
The increase in relief valve capacity was recalculated in 0,1 bar increments until chock pressure (sonic velocity) on the downstream (discharge) line occurred. The results are shown in the graph that forms Figure 5. Choke pressure occurred at a relieving pressure of 4,38 barg.
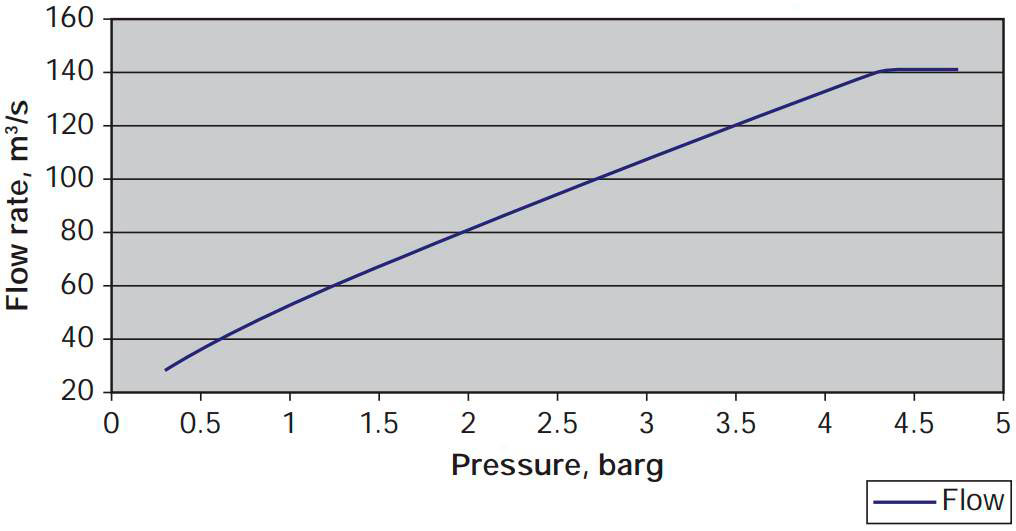
In addition to the design maximum allowable vapour pressure of 2 barg, which is applicable with the vessel not subjected to the heavy seas that would cause dynamic loads and sloshing, it is considered realistic for the tank to be able to accept an over-pressure up to the point before deformation, this equating to 3,5 barg. Therefore, these two specific pressures have been used to determine the additional capacity of the relief valves. These values in turn have been used to determine the oversizing factor of the relief valves. This factor has been determined by recalculation of the fire exposure figure using the increase in capacity.
- Relief valve flow at allowable over-pressure in accordance with the IGC Code’s of 0,3 barg.
- Relief valve flow – 28,146 m3/s.
- At design allowable over-pressure of 2,0 barg. Relief valve flow 80,80 m3/s.
- At deformation over-pressure of 3,5 barg. Relief valve flow 120,07 m3/s.
- At discharge vent line choke pressure of 4,33 barg. Relief valve flow 140,93 m3/s.
- Tank diameter fixed at 48,6 m and area of 7,419 m2. ′G′ changes and depends on pressure within the cargo tank.
At the IGC Code’s allowable over-pressure of 0,3 barg:
- Q – 28,146 m3/s;
- G – 0,0943;
- Fire factor – 0,2.
At design allowable over-pressure of 2,0 barg:
- Q – 80,80 m3/s;
- G – 0,1008;
- Fire factor – 0,537 (2,69).
At deformation over-pressure of 3,5 barg:
- Q – 120,07 m3/s;
- G – 0,1049;
- Fire factor – 0,767 (3,84).
At discharge vent line choke pressure of 4,33 barg:
- Q – 140,93 m3/s;
- G – 0,107;
- Fire factor – 0,883 (4,42).
Existing ship
An existing ship, using the above relief valves, was then considered. This ship (name not given because of confidentiality requirements) has a tank diameter of 40,46 m, which equates to an area of 5,131 m2. All other aspects with regard to inlet pipework and discharge arrangement are as before.
Tank diameter fixed at 40,46 m and area of 5,131 m2. As previously, ′G′ changes and depends on pressure within the cargo tank.
At IGC Code’s allowable over-pressure of 0,3 barg:
- Q – 28,146 m3/s;
- G – 0,0943;
- Fire factor – 0,271 (1,35).
At design allowable over-pressure of 2,0 barg:
- Q – 80,80 m3/s;
- G – 0,1008;
- Fire factor – 0,727 (3,64).
At deformation over-pressure of 3,5 barg:
- Q – 120,07 m3/s;
- G – 0,1049;
- Fire factor – 1,038 (5,19).
At discharge vent line choke pressure of 4,33 barg:
- Q – 140,93 m3/s;
- G – 0,107;
- Fire factor – 1,195 (5,97).
Results
For an existing ship using the subject relief valve, the system has an over capacity at the maximum design pressure of 2 barg of 364 %. At the deformation over-pressure of 3,5 barg the over capacity of 519 %.
It is important to note that the above figures are intended only to demonstrate the overcapacity of the relief valves using the IGC criteria but do not take any credit for the additional relieving capacity provided by the vapour header.
Under fire conditions the relief valves on the other tanks will also be able to operate up to the choke pressure of the flow through the common header tank outlet (normally 350 mm diameter). This also increases the flow.