Discover comprehensive insights into the LNG carrier market, including fleet trends, ownership, vessel technology, the FSRU and FLNG sectors, bunkering, shipping market dynamics, and the S&P market.
Explore the latest developments and innovations shaping the future of LNG transportation.
LNG Carrier Fleet Trends
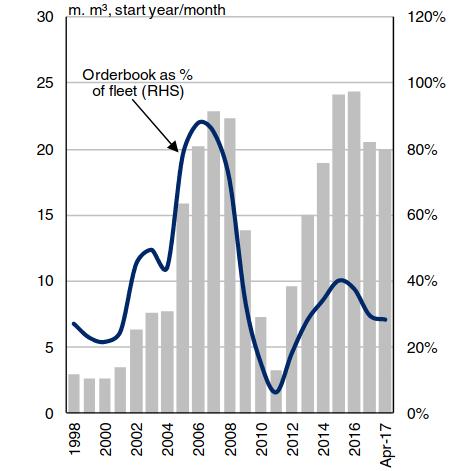
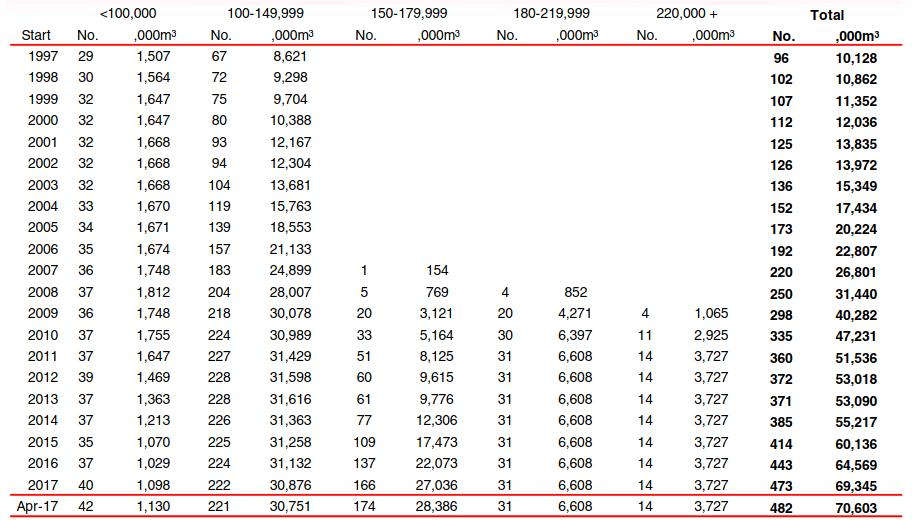
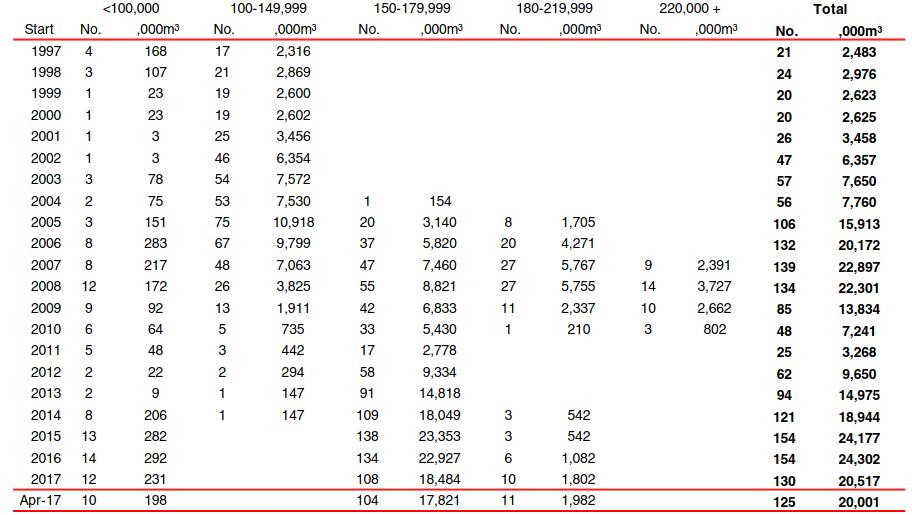
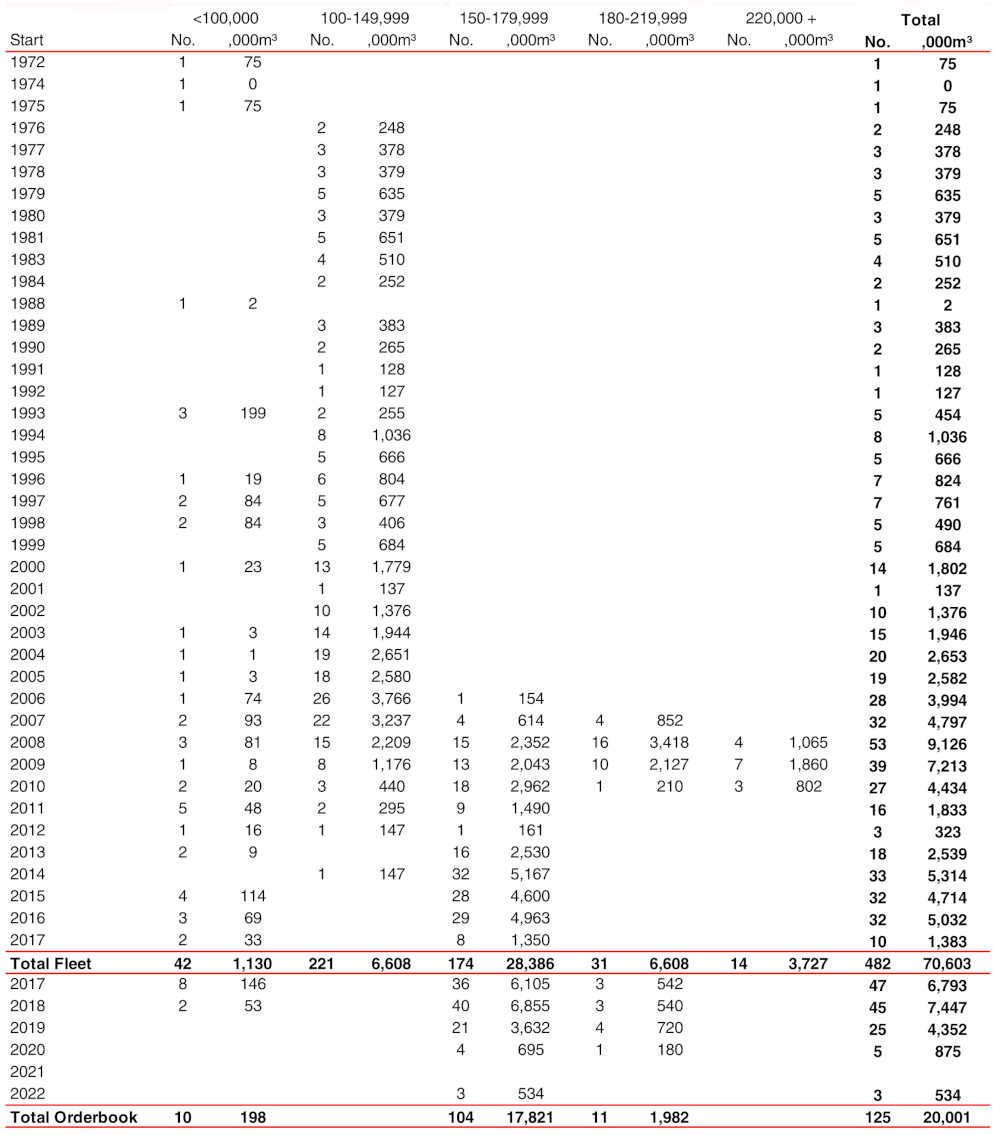
The LNG carrier fleet continued to grow rapidly in 2016 and early 2017, reaching 482 vessels of a combined 70,6 m m3 at the start of April 2017. Meanwhile, due mainly to weak contracting activity, the orderbook in the sector has been on a downward trend since the start of 2016. As of 1st April there were 125 LNG carriers of 20,0 m m3 on order, equivalent to 28 % of the fleet in capacity terms and down from 38 % at the start of 2016.
Fleet Development
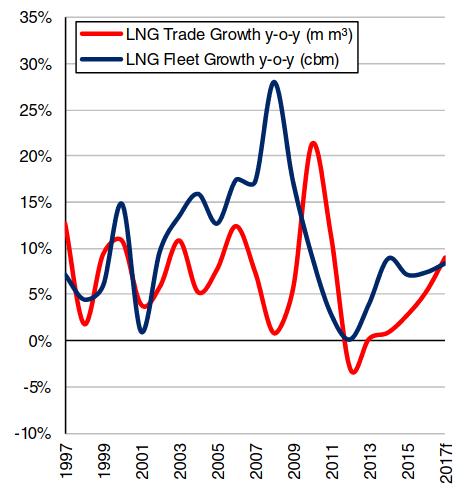
Driven by firm ordering in the period 2011 to 2014, the LNG carrier fleet has grown rapidly in recent years. In full year 2016 the fleet grew by 7,4 % in m3 terms, matching the pace of growth in 2015.
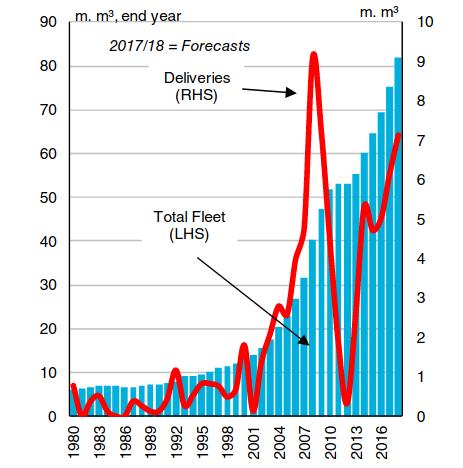
The rapid expansion in global natural gas demand has been mirrored by the fleet, with LNG carrier capacity doubling since 2008. In recent years, fleet growth has almost exclusively been driven by vessels of 150 000 m3 and above. These ships accounted for 54 % of fleet capacity as of 1st April 2017, up from 21 % at the start of 2009.
Deliveries
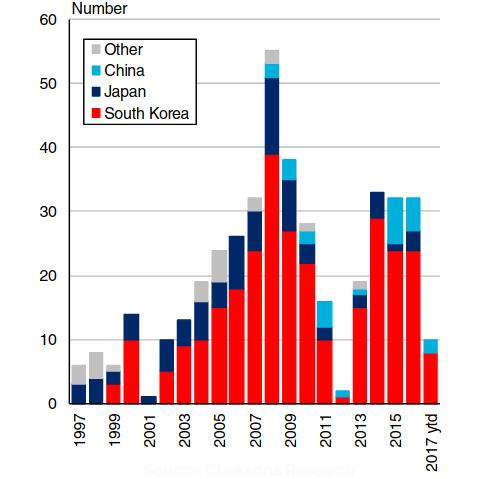
Global shipyard output in the LNG sector has remained relatively steady since 2014 in capacity terms, with 32 vessels of a combined 5,0 m m3 reported delivered in 2016.
However, the volume of deliveries was significantly smaller than the scheduled start-year orderbook, with “non-delivery” reaching a record 33 % in capacity terms. It was reported last year that the delivery dates of a number of LNG carriers were postponed in line with delays to a number of LNG export projects.
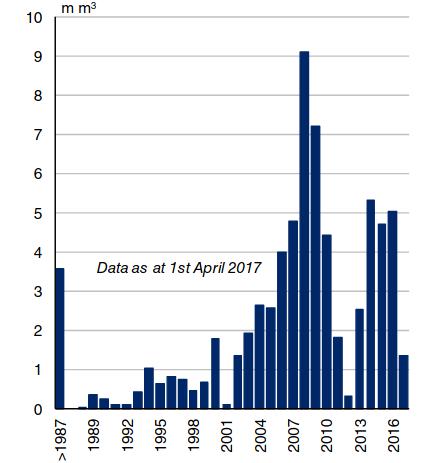
In Q1 2017, a total of 10 LNG carriers of 1,4 m m3 were reported delivered into the fleet. Deliveries are expected to remain firm in 2017, with a total of 6,2 m m3 currently projected to be delivered in the full year. While deliveries are expected to remain below the record 9,2 m m3 of capacity delivered in 2008, deliveries in 2017 are nevertheless project- ed to reach the third highest total on record.
Demolition
The combination of a relatively young age profile and a high average age of demolition means that LNG scrapping has remained very limited. In 2016 two ships of 0,3 m m3 were reported sold for scrap- ping, with an average age of 39 years.
Both of these vessels were reported to have been sold to Turkish buyers for “green recycling”. There are currently 24 LNG carriers in the fleet that are over 35 years of age, of which many are currently re- ported to be laid up. A small number of these ships are also currently due to be converted into FSRU or FLNG units.
Orderbook & Contracting
In line with trends in the wider global orderbook, the size of the LNG carrier orderbook has been on a downward trend since the start of 2016. Although it is still equivalent to 28 % of the fleet in capacity terms, significantly higher than in the other volume sectors, the LNG orderbook has reached its lowest level since July 2014, standing at 125 units of 20,0 m m3 at the start of April. This represented a decline of 12 % year-on-year in capacity terms.
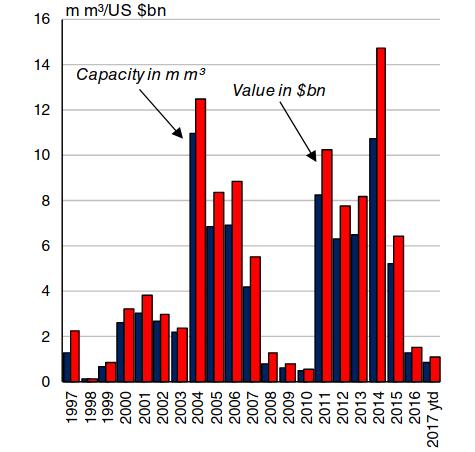
Following a number of years of firm contracting, just eight LNG carriers were reported ordered in 2016, the lowest number since 2010, with a combined capacity of 1,3 m m3. This was driven by delays to a number of projects, reducing vessel requirement, and a number of owners turning to the pool of vessels available on the spot market. In the first quarter of 2017, five LNG carriers of a combined 0,9 m m3 were reported ordered (two of which were LNG/Regas units). All of these orders were placed at South Korean yards, with Daewoo winning a contract in February for a pair of 173 400 m3 vessels.
Newbuilding activity is expected to remain limited in the short term, given the challenging project sanctioning environment and lack of interest in speculative ordering.
Outlook
Rapid growth in the LNG carrier fleet is expected to continue in the short term, due to firm ordering from 2011 to 2014, and a projected decline in “non-delivery” of tonnage. In full year 2017 the LNG fleet is currently forecast to grow in capacity terms by 8,7 % to reach 75,4 m m3, followed by further growth of 8,6 % in 2018.
In the medium term growth is likely to slow: 71 % of orderbook capacity is currently scheduled for delivery before the end of 2018. Ordering activity has failed to pick up significantly in the year so far and appears unlikely to do so in the short-term, with challenges facing a number of proposed LNG export projects and few owners showing an interest in speculative orders.
As a result, fleet growth is expected to slow in the medium term, albeit to a higher rate than is projected across other volume sectors.
LNG Carrier Owners, Flags & Class
As of April 2017 the LNG carrier fleet was distributed across 88 owners. This figure has almost doubled in the last 10 years, there being 54 LNG owners in 2007.
The average size of LNG owners fleets have also increased slightly over the last decade, from an average of four vessels per owner in 2007 to five in 2017.
Owner Types
Historically, the two main types of LNG carrier owner have been independent public companies and major energy companies. However, independent private owners have been increasing their share of the LNG carrier fleet, whilst the share of the fleet owned by oil majors has fallen.
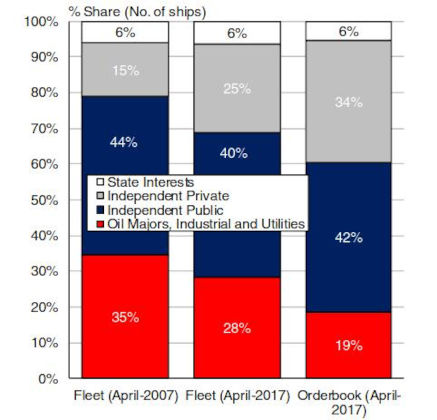
Independent private owners have tripled the size of their fleet over the last ten years, causing their share of the LNG carrier fleet to rise from 15 % in 2007 to 25 % in 2017, in terms of capacity. Meanwhile, the number of vessels owned by oil majors has remained at around 40 vessels.
Top Owners
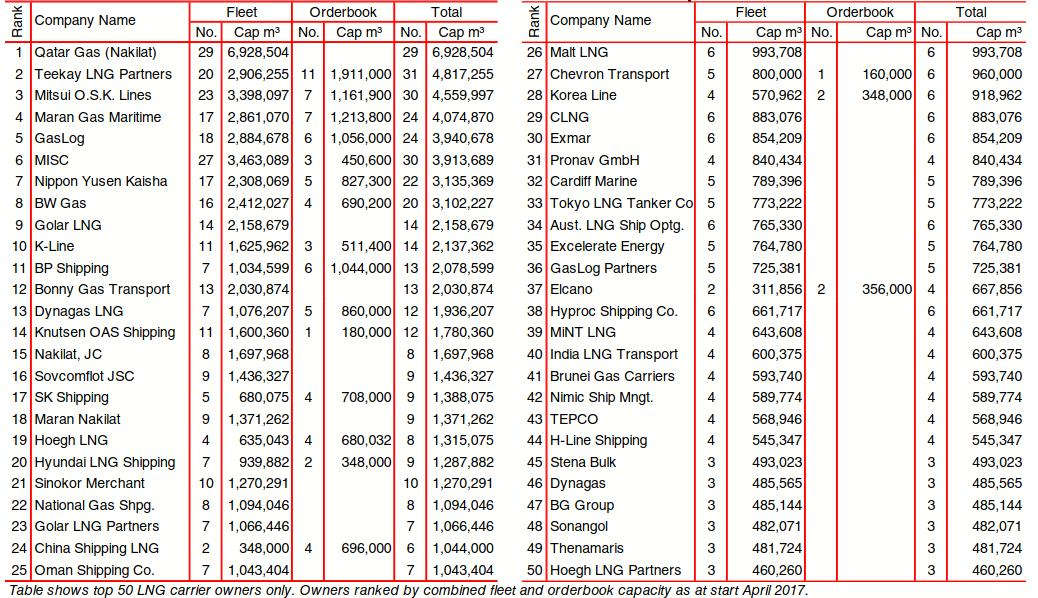
At the start of April 2017, Qatar Gas (Nakilat) remained the largest owner by capacity, with a total of 29 ships of a combined 6,9 m m3 in their fleet. Despite not adding tonnage to their fleet since 2010, Nakilat’s fleet is currently twice as large, in capacity terms, as its nearest counterpart, Teekay LNG Partners.
The top ten LNG owners account for 44 % of total fleet capacity, making the LNG market one of the least fragmented shipping sectors in terms of ownership.
Flag
The 88 owners of the LNG carrier fleet flag their 482 ships among 30 flag states. Nearly a quarter of vessels are flagged under the same nationality as their ownership, whilst the remainder are with international flags.
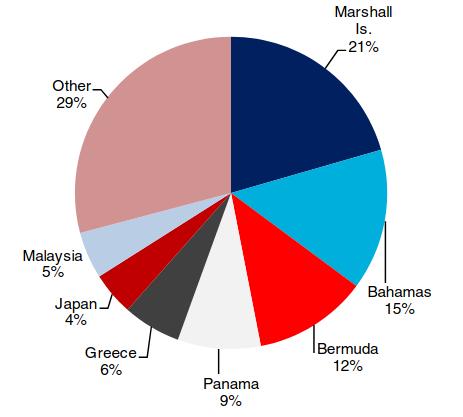
The top three flag states (the Marshall Islands, Bahamas and Bermuda) have maintained their dominance, accounting for 48 % of the fleet in terms of capacity, with 22 % of the fleet flagged under the Marshall Islands ensign.
Class
As of the 1st of April, Lloyd’s Register (LR) remains the class society with the most LNG tonnage 143 vessels are classed with LR, representing 29 % of the fleet.
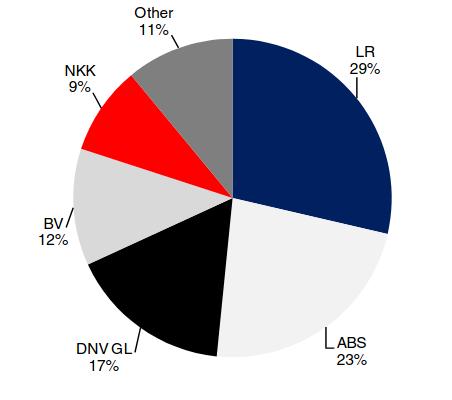
American Bureau of Shipping is ranked second, classifying a total of 110 LNG carriers and DNV GL third with 88 vessels.
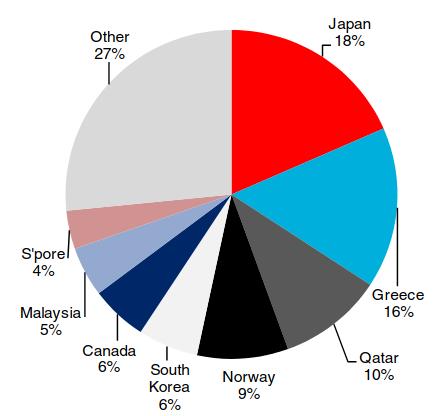
LNG Carrier Builders
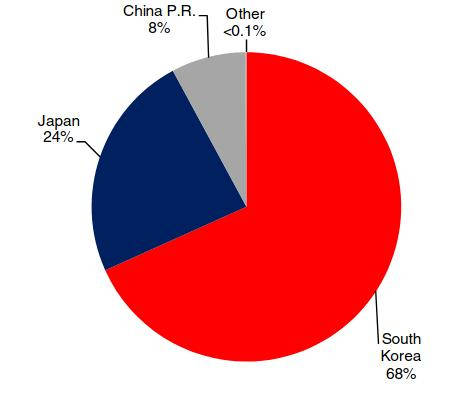
South Korea has been the dominant builder country within the LNG carrier sector since the early 2000s, with vessels also on order at a limited number of yards in China and Japan.
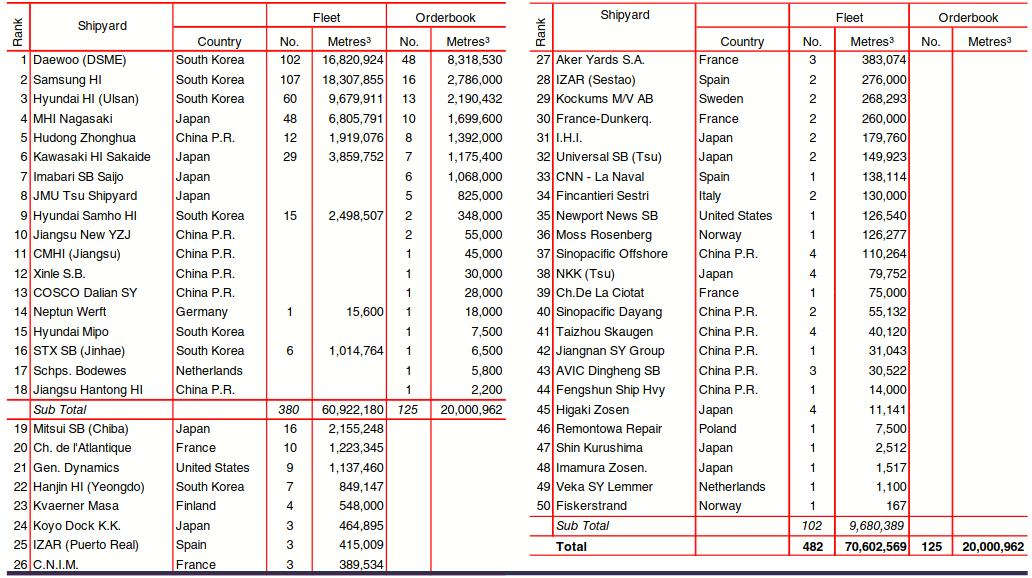
While some shipyards in countries including France and the US have historically been key LNG carrier builders, very few yards outside of the “Big 3” builder countries have been active in the sector in recent years. As of 1st April 2017, a total of 18 shipyards have LNG carriers on order.
Korea
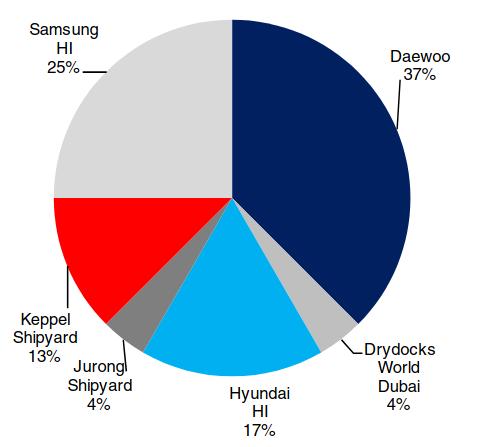
A total of 81 LNG carriers of a combined 13,7 m m3 were on order at South Korean yards as of 1st April 2017, representing 68 % of global orderbook capacity. The “big 3” yards of Samsung HI, Hyundai HI and Daewoo have a combined orderbook of 77 vessels.
This total is dominated by Daewoo, which currently has 48 LNG carriers on order, equivalent to 38 % of the global total.
Daewoo also has relatively long orderbook cover, with 14 vessels due for delivery in 2019 (of 25 globally).
Japan
A number of Japanese yards remain prominent in the LNG sector, although they account for a much smaller share of the orderbook than in the 1990s.
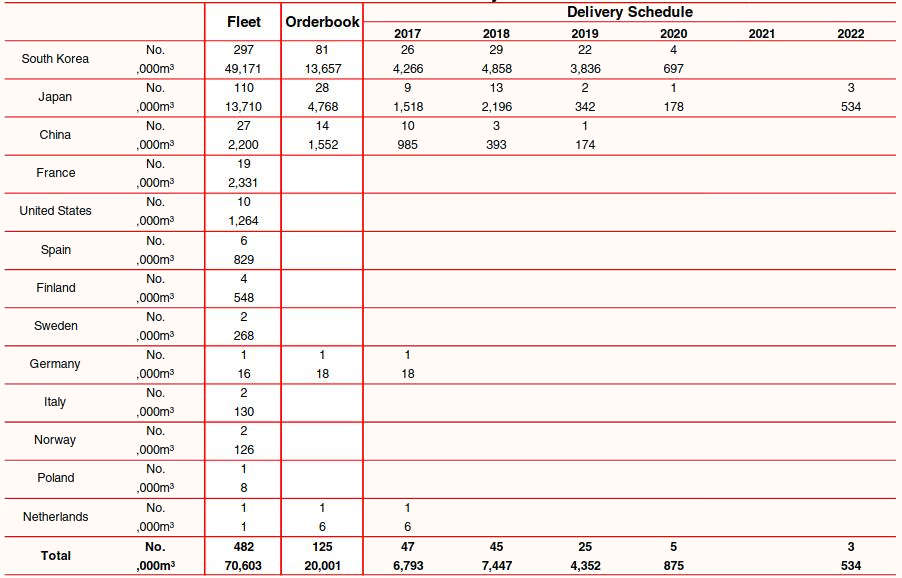
A total of 28 LNG carriers of 4,8 m m3 are currently on order at Japanese yards, 24 % of the global total and slightly above the 19 % share of Japanese-built vessels in the fleet, in capacity terms. There are four Japanese yards with LNG carriers on order, though only two are reported to have units on order for delivery after 2018.
China
The first LNG carrier delivery from a Chinese yard was not made until 2008 and China retains a fairly small share of output in the sector, accounting for 8 % of the global orderbook in capacity terms (14 ships of 1,5 m m3). Hudong Zhonghua accounts for 90 % of this total in capacity terms and is the only Chinese yard with a vessel of above 45 000 m3 on order. Chinese yards have with just one LNG carrier currently due for delivery after 2018.
Other
In capacity terms, just 8 % of the current fleet was built outside of South Korea, Japan or China. There are just two LNG carriers on order outside of the “big 3” builder countries:
- an 18 000 m3 unit being built at Neptun Werft in Germany;
- and a 5 800 m3 LNG bunkering vessel under construction at Bodewes Shipyard in the Netherlands.
LNG Carrier Vessel Technology
Driven in part by the high value of assets and the many complications in transporting liquefied natural gas, technology has evolved quickly in the LNG carrier sector in recent years in comparison to other areas of shipping. There have been shifts over time towards vessels that use LNG boil-off technology and more advanced containment systems, as well as developments in ice-class and regasification technology.
Vessel Propulsion
Steam turbine engines were traditionally the main method of LNG carrier propulsion, using a combination of regular marine fuel and LNG boil off gas. However, steam turbine engines are due to be installed in just 5 % of vessels on order, with owners now favouring more efficient alternatives. Initially this shift was primarily towards dual fuel, Dual-fuel diesel electric/Tri-fuel diesel electric (DFDE/TFDE)diesel electric engines, which can use LNG boil-off technology as well as HFO and marine diesel.
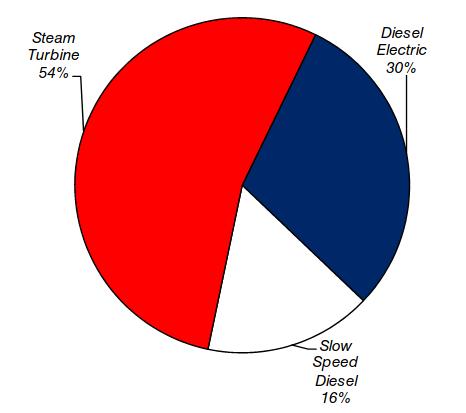
These engines feature improved thermal efficiency of around 40-45 % (while burning gas), compared to 30 % for steam turbine engines. As of 1st April, a total of 144 LNG carriers in the fleet were powered by diesel electric engines (equivalent to 30 % of the fleet), while 42 % of vessels on order are due to use this technology.
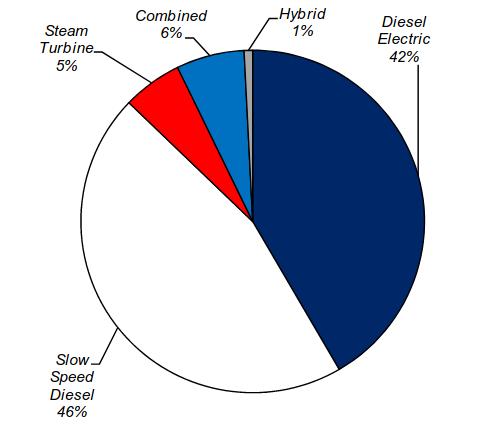
Two-stroke engines were previously reserved for the very largest ships, particularly Q-Max and Q-Flex vessels due to their higher power requirements. However, new two-stroke systems have become more popular in the past five years and this has driven an increase in the proportion of vessels on order that will use slow speed diesel engines (both two-stroke and four-stroke) to 46 %, the largest proportion of any engine type. This change was first driven by the introduction of MAN Diesel’s M-type electronically controlled gas injection (ME-GI)ME-GI engine, the first design to combine the increased power of two-stroke engines with improved flexibility in switching between using HFO and LNG.
The thermal efficiency of ME-GI engines is reported to be around 50 %, compared to 40-45 % for diesel electric models. They also release a negligible amount of unburned methane compared to other systems; “methane slip” is likely to come under greater scrutiny in future, given the potency of methane as a greenhouse gas. Wartsila has also entered the dual fuel, two-stroke market with its Gas and diesel low-pressure two-stroke engine (X-DF)X-DF engine. Although this engine is believed to be marginally less efficient than a ME-GI design it meets the IMO’s Tier III NOx standards without the need to fit a scrubber. There are currently 57 LNG carriers on order which will use slow speed diesel engines, mainly ME-GI systems, compared to 78 vessels in the fleet.
Containment System
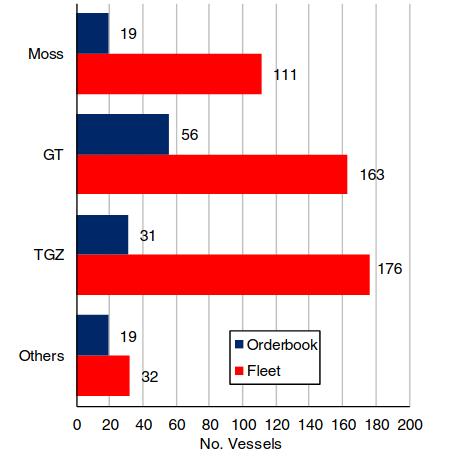
While new containment systems are continually being developed, a small number of types are currently dominant within the LNG carrier fleet and orderbook. The Moss system was historically dominant within the fleet and retains a small market share, with 19 vessels on the orderbook due to be fitted with free standing Moss aluminium tanks. However, the majority of vessels now use membrane containment systems developed by French company Gaztransport & Technigaz (GTT), which use insulation built directly into the ship’s hull. A reported 71 % of the current fleet is fitted with systems supplied by GTT (also accounting for 70 % of the LNG carrier orderbook).
There have been a number of developments in recent years that may introduce more competition into the LNG containment system market. Two vessels currently due to be delivered in 2017 are being fitted with Kogas KC-1 containment systems, developed in conjunction with South Korea’s three major shipbuilding groups. However, since these vessels were ordered in 2015, no more orders that will use KC-1 systems have been reported, with owners generally choosing more familiar GTT-built containment systems.
Ice-Class Technology
As of 1st April 2017, there were a total of 46 LNG carriers in the fleet with ice classification (13 of which have 1A or 1AS notation), as well as 17 ships on order (all with 1A or 1AS notation). Ships on order at or built by Daewoo for the Yamal LNG project accounted for 15 of the vessels on order, as well as one vessel in the fleet, the “Christophe de Margerie”.
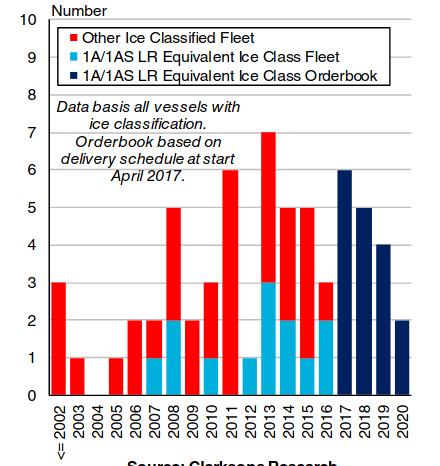
All of these ships will have Arc7 and LR “1AS” notation, the highest of any vessels in the fleet (aside from specialist icebreakers). The Arc7 vessels sail in “stern-first” mode when travelling through ice fields and are designed to break ice up to 6,6 ft thick, though the first ice trials of the “Christophe de Margerie”, delivered in 2016, indicate that actual performance may be stronger. Once operations begin, these vessels will carry LNG from the Yamal LNG terminal, travelling eastwards through the Russian Arctic in summer and westwards via the Barents Sea during winter.
The FSRU Sector
Floating regasification technology is playing a growing role in the wider LNG industry. As the global LNG markets have opened up and supply has increased, prospective importers have been attracted by the lower cost and quicker construction time of a Floating Storage and Regasification Unit (FSRU) compared to a land-based regasification terminal. While some of the first FSRUs were converted from LNG carriers, purpose-built units have become more popular in recent years.
Note: on figures 15, 16, 17, 18 FSRU fleet data includes FSRUs classified as regasification units within the LNG carrier fleet, and dedicated FSRUs.
As the concept has gained traction and the technology has been developed, more importers appear to be favouring FSRU solutions, particularly in smaller or seasonal markets. Regasification units are seen as more flexible and cost-effective, and can also serve as a temporary solution while permanent onshore facilities are constructed, and have the potential to be redeployed elsewhere once construction is completed.
The FSRU sector includes many units which are classified as part of the LNG carrier fleet (owing to their ability to discharge LNG as a gas or trade as traditional LNG carriers), as well as a small number of units which are more committed offshore structures designed for long-term usage.
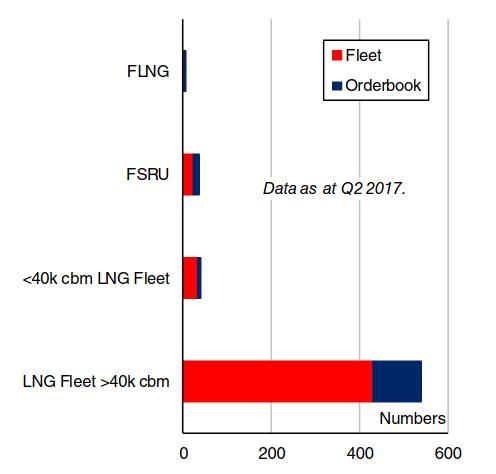
Fleet
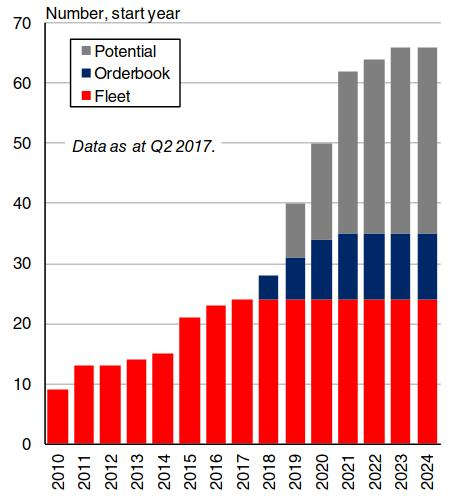
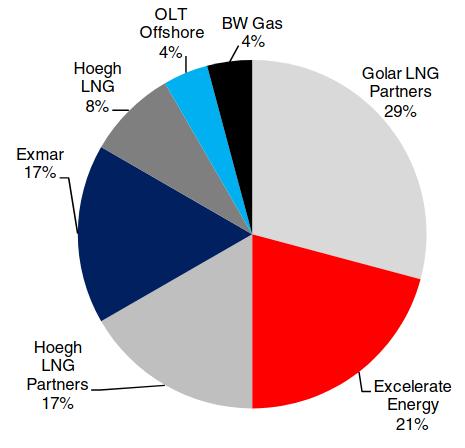
At the start of April, there were 24 FSRUs in the fleet, 18 of which were classified as regasification units within the LNG carrier fleet, and six of which were dedicated FSRUs. The 24 units were owned by seven companies, with Golar LNG Partners accounting for the largest number (7 units), followed by Excelerate Energy with 5 units, whilst Exmar and Hoegh LNG Partners each had 4 units.
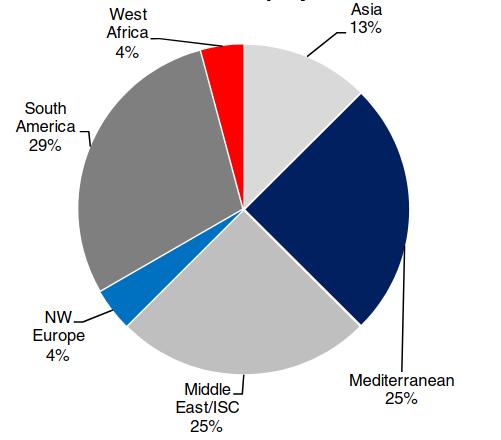
The current FSRU fleet is deployed widely, with South America accounting for the largest share with 7 units deployed across Brazil, Argentina and Trinidad. Six units were deployed in the Middle East/ISC, six in the Mediterranean, three in Asia, and one each in Europe and West Africa.
Just one FSRU was delivered in 2016. The “Hoegh Grace”, built by HHI for Hoegh LNG Partners, is now installed at the port of Cartagena in Colombia under a 20 year contract, and reportedly received its first LNG cargo in November 2016 from the Port Fortin plant in Trinidad and Tobago. This followed the delivery of two FSRUs in 2015, including the “Golar Tundra”, now installed offshore Ghana, and the “BW Singapore”, which was the second unit to be deployed in Egypt.
Orderbook
Recent months have seen increased interest in the FSRU sector, and in Q1 2017, four orders for FSRU units were placed (two of which are classified as regasification units in the total LNG carrier orderbook). This followed the contracting of just one FSRU in 2016. The orders placed in Q1 comprised two 170 000 m3 units for Hoegh LNG, one of which is reportedly intended for deployment in Pakistan. Meanwhile, Kolin Construction ordered one 170 000 m3 unit for potential deployment in Turkey, whilst Indonesian owner Jaya Samudra contracted one 26 000 m3 unit.
Overall, at the start of April 2017, there were 13 FSRUs on order, 6 of which were scheduled for delivery during 2017. The “BW Integrity” has subsequently been delivered and is expected to commence operations in Pakistan in the summer. The “Hoegh Giant”, also delivered since the start of Q2, is scheduled to begin a 20-year contract in Ghana in mid-2018, and has been chartered out on a short-term contract until then.
The remaining four units scheduled to be delivered in the remainder of 2017 include Golar LNGs “Golar Nanook” unit which is contracted to be deployed offshore Brazil for 25 years as part of Golar Power’s Sergipe Power Project. Meanwhile, MOL is expected to take delivery of the “GNL del Plata”, which is ear- marked for deployment off Uruguay under a 20 year charter. However, the project has run into some difficulties associated with elevated costs.
Outlook
There is currently substantial interest in the regasification sector, and the outlook is relatively positive. Although competition from low cost fuels, such as coal, present a threat to gas demand, natural gas is expected to become increasingly important in the global energy mix. Additionally, low gas prices have led a number of prospective importers (including many smaller nations) to look to LNG imports, and in particular regasification units.
The increasingly “mainstream” nature of floating regasification technology has meant that floating regasification units are being considering more and more. Indeed, units are being mooted for deployment in a number of nations across the world, including in:
- Indonesia,
- India,
- China,
- Vietnam.
Furthermore, as LNG becomes more commoditised, the relative flexibility of floating regasification units is also expected to support further interest and expansion in this sector.
The FLNG Sector
Reflecting the expectation for continued growth in global gas demand, offshore gas fields far from shore, in deeper environments and harsher and more difficult conditions, are expected to need to be exploited. A number of field operators have turned to Floating Liquefied Natural Gas (FLNG) unit solutions as a method of producing from stranded gas fields while potentially avoiding the high costs associated with onshore LNG liquefaction projects.
Fleet and Orderbook
The FLNG sector has been under pressure for some time, although in early 2017 there were signs of more positivity, including some FIDs and vessel orders. Following its delivery in 2016, the first FLNG unit, “PFLNG Satu”, produced its first LNG from the Kanowit field in late 2016 and commenced commercial operations in early 2017, with the first cargo loaded onto an LNG carrier in April. Meanwhile, the “Exmar FLNG Barge 1” was delivered in early 2017, although employment has reportedly yet to be secured.
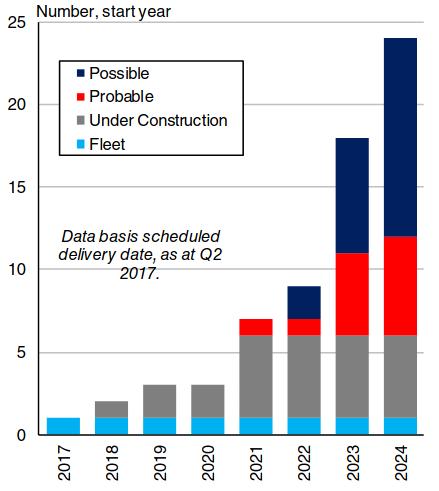
There were also four FLNGs on order at the start of April 2017. Golar’s “Hilli” which is under conversion at Keppel in Singapore is scheduled for delivery by the end of the year. The unit is to be chartered to Perenco for work offshore Cameroon on the Kribi field. Meanwhile, the Shell-owned “Prelude” FLNG, which is scheduled to be deployed on the Prelude field offshore Australia in 2018, remains under construction at Samsung HI.
Construction on the “PLFNG 2” unit, owned by Petronas and expected to be deployed on the Sabah field, was recently restarted and the unit is scheduled for delivery in 2020. Lastly, in February 2017, it was confirmed that Golar’s “Gandria” LNG carrier would be converted into an FLNG unit for delivery in 2020, representing the first FLNG contract since 2014. The unit is currently earmarked to be employed by OneLNG and Ophir Energy at the first phase of the Fortuna project offshore Equatorial Guinea. However, this is subject to FID by OneLNG and Ophir, which is currently expected to be approved before the end of 2017.
As of the latest updates, the FID for the Fortuna project was never approved, and the project was effectively shelved.
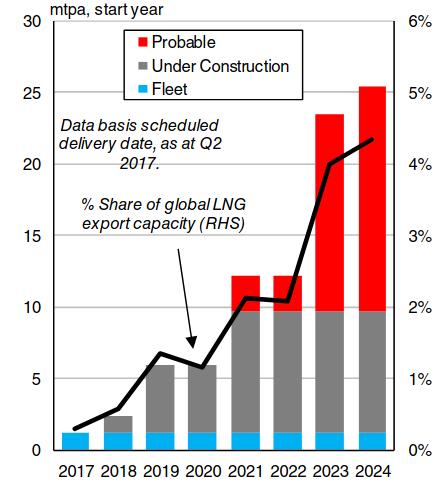
Since the start of April, a further FLNG unit has been ordered, with FID taken on Eni’s Coral South project offshore Mozambique in early June 2017. The first phase of the project is expected to utilize a 3,4 mtpa FLNG unit, with the potential for further units to be deployed if there is additional development.
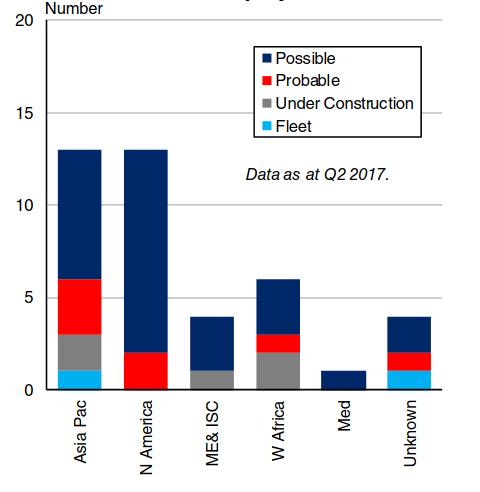
Potential Projects
At the start of April 2017 there were around 35 additional possible FLNG projects at various stag- es of development. It is expected that FLNG solutions will play an increasingly important part in the gas production story into the long-term.
However, the weaker gas price environment of recent years has placed significant pressure on a number of projects, with several subject to delays, either in terms of construction of units or of project sanctioning. This has been particularly evident in higher cost regions such as Canada and Australia. For instance, the Browse project in Australia, which was expected to utilise up to three FLNGs, is now expected to supply gas to existing liquefaction capacity in the region.
However, there is some positivity in the sector, particularly regarding small projects, with some projects such as the NewAge FLNG project in the Congo expected to receive FID in 2017. Furthermore, some operators with projects at the FEED or pre-FEED stage are considering the use of FLNG solutions, such as at the Scarborough project.
In early 2017, Sevan reportedly won a FEED contract for Scarborough, which may indicate that a cylindrical FLNG unit could be deployed at Scar- borough. However, it remains to be seen whether the project will deemed economically viable, given current low gas prices. In the longer term, there are a number of possible projects that could employ FLNGs, including the Port Delfin project in the US Gulf, which could eventually utilise four FLNGs with a total capacity of 13,0 mtpa. Meanwhile, the Orca project in Canada, could employ up to six 4 mtpa FLNGs.
Outlook
The outlook for the FLNG market has softened in line with the decline in global gas and energy prices and there are only a limited number of projects that currently appear economically viable in the next few years. That being said, FLNGs are increasingly being seen as viable options for smaller, shallow water projects in several regions. As a result, it is expected that FLNGs will play a greater role going forwards, with the development of more complex or “stranded” offshore fields likely to be required in the long-term, particularly as gas demand grows.
LNG Bunkering
Using LNG as a fuel has emerged in recent years as a potential “catch-all” solution to stricter regulation of vessels emissions. While LNG bunkering infrastructure is still relatively limited outside a small number of global hubs, this infrastructure is expanding significantly. However, it is likely that more development is needed in this area before owners opt for LNG fuel technology in large numbers across a wider range of vessel types.
Concept Development
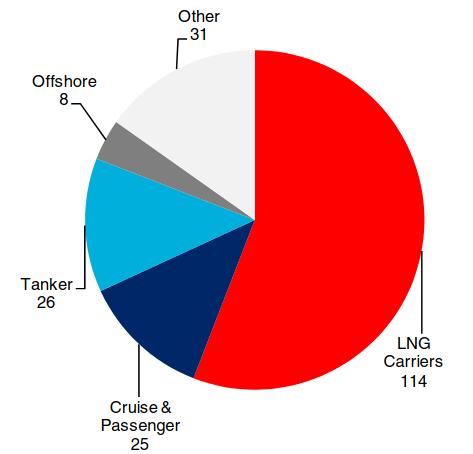
As of 1st April 2017, a total of 342 vessels in the global merchant fleet were equipped with engines capable of using LNG as a fuel (either as a primary or dual fuel). The majority of these ships were LNG carriers (238 vessels), able to use boil-off technology. Meanwhile, 204 vessels on the current orderbook are being built with LNG capable engines, of which 114 are LNG carriers.
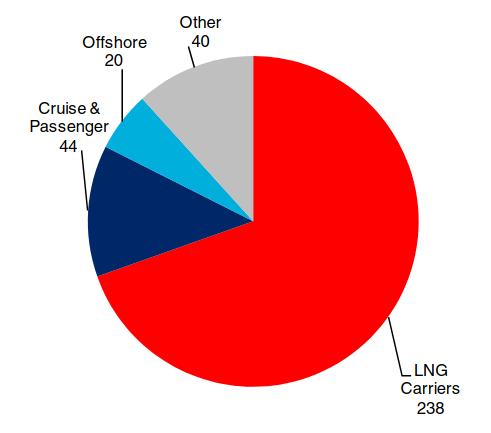
The LNG fuelled cruise ship fleet is set to expand rapidly over the next few years, with 8 LNG capable cruise vessels on order compared to just one in the existing fleet. Elsewhere, there are also 26 tankers on order that will use LNG as a fuel, triple the number in the current fleet, including four Aframax tankers ordered at Hyundai Samho HI.
LNG bunkering is currently available at a range of ports in Europe, as well as a smaller number of ports in North America and Asia. Over 40 ports globally are reported to have LNG bunkering facilities, nearly half of which have dedicated LNG bunkering terminals, including the ports of Rotterdam and Bilbao.
Read also: Demand, Supply, and Market Outlook of Liquefied Gas Global Trade
Many other ports in Northern Europe also have truck-to-ship transfer or ship-to-ship transfer facilities for LNG (including Antwerp, Hamburg and Southampton). A further 38 ports have announced plans to offer LNG bunkering, with a reported 36 LNG bunkering terminals currently under construction or proposed. However, outside Northern Europe where the use of LNG as a fuel has proved particularly popular with ferries operating short-sea routes, the spread of LNG bunkering remains limited.
Beyond Europe, LNG bunkering facilities are generally less widespread. In North America, LNG bunkering facilities have been installed at ports including Los Angeles and Jacksonville, while a contract has also been signed to install a terminal at Cristobal, close to the Panama Canal. In Asia, Singapore (the world’s largest bunkering port) completed its first LNG bunkering operation in March and plans to become an LNG bunkering hub by 2020.
Meanwhile in China, LNG bunkering terminals are under construction at ports along the Yangtze river, as well as at sea ports including Shanghai. Elsewhere, there are confirmed plans to build LNG terminals at South Korean ports such as Busan and Incheon.
Regulatory Environment
The expanding scope of emissions regulation in the shipping industry has been key in increasing the attractiveness of LNG as a marine fuel. In October 2016 the IMO announced its decision to implement a global 0,5 % sulphur cap at the start of 2020, aiming to sharply reduce the volume of SOx emissions from the shipping industry. Further, the North Sea and Baltic Sea are due to be adopted as NOx Emission Control Areas by the IMO, effective from the start of 2021.
The shipping industry has also begun to face greater scrutiny over CO2 emissions. Although the IMO has stated its opposition to regional measures, the EU has voted to include shipping in its Emissions Trading Scheme (ETS) unless a comparable global policy is adopted by 2021. LNG has appealed to some owners as a “catch-all” solution to these regulatory issues.
Outlook
Although the use of LNG as a fuel has continued to grow, a number of factors have limited this expansion. Low oil prices have reduced the incentive to switch from traditional marine fuels, countering the impact of regulation. The availability of bunkering facilities is another limiting factor. Away from certain hotspots, primarily located in Northern Europe, ports offering LNG bunkering are fairly scarce, making it an impractical choice of fuel for ships on the vast majority of deep sea routes (aside from LNG carriers using boil-off gas).
However, the cost of building LNG capable ships has declined considerably in recent years and interest amongst owners is increasing. A number of owners are choosing to build vessels with “LNG ready” designs that can be retrofitted at a later date. There are a large number of ports with facilities currently under construction or planned, which will widen the applicability of LNG as a fuel in the future. Although the costs remain significant, stricter environmental regulation is likely to push more owners to build LNG capable vessels, as the pressure to use cleaner fuels continues to grow.
LNG Shipping Market
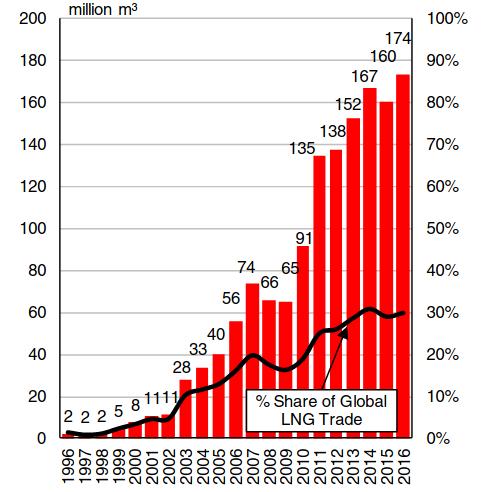
The LNG fleet is split in its employment between long-term timecharter requirements relating to particular projects, and the spot and short-term market. While around 70 % of LNG trade remains accounted for by long-term contracts, the spot and short-term share of global trade has increased considerably since 2000, when long-term trade accounted for 97 % of total LNG volumes.
Market Structure
The dominance of long-term timecharters in the LNG market is rooted in the high cost of developing infrastructure. Historically, operators wished to lock in freight costs, with carriers tied to particular terminals and routes, and freight paid on an indexed basis. LNG shipping market competition was limited to ship charters expiring, and vessels on order not tied to projects. As a result, LNG carrier operators have typically been provided with less volatile, more predictable revenue flows than in other shipping sectors.
However, short-term LNG trading was boosted following the 2011 Fukushima disaster which led to the shutdown of Japan’s nuclear capacity and a subsequent surge in gas demand, requiring greater activity in the short-term market. Meanwhile, a number of traders have also become more involved in the LNG market, whilst regional price differentials and the emergence of a greater number of importing and exporting nations have all supported the growth of short-term LNG trading.
Short-Term Market Review
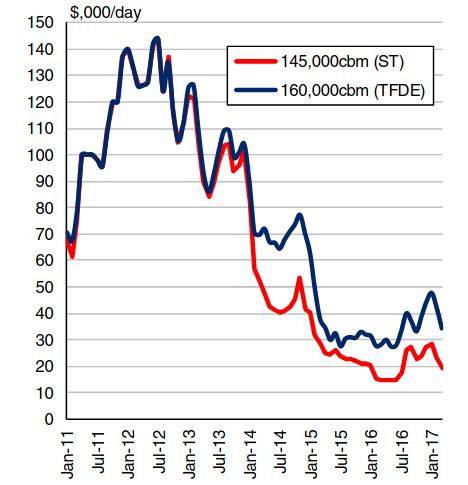
Following a slight decline in 2015, LNG volumes traded on a short-term basis rose to 174 m m3 in 2016, equivalent to 30 % of global LNG trade. Whilst this should have been supportive of an improvement in the short-term shipping market, there were a number of factors that led to challenging market conditions in the first half of 2016. Firstly, continued rapid LNG carrier fleet growth in 2014 and 2015 led to significant supply side pressures.
Second to this, unplanned outages at liquefaction terminals including in Yemen and Angola led to a more limited supply of cargoes, and thirdly, the relatively narrow regional gas price differentials limited opportunities for inter-basin trading. As a result, the spot rate for a 160 000 cbm LNG carrier averaged just $28 962/day in 1H 2016, compared to $36 038/day in full year 2015. However, market conditions did improve in 2H 2016, partly supported by the ramp-up of activity at new liquefaction terminals in Australia and the US and the return of some cargoes from Angola. By January 2017, the rate for a 160 000 cbm LNG carrier had reached $48 000/day.
Nevertheless, pressure remains on the short-term LNG carrier shipping market, with rates generally easing back during Q1 to reach around $30 000/day in April. The market balance was undermined in the early part of this year by a number of factors, including thin demand for tonnage in the Atlantic basin, the redelivery of a number of ships which had been secured on multi-month charters with a range of optional extensions, and the continued short duration of many charters. By mid-June, the guideline spot rate for a 160 000 cbm LNG carrier had improved slightly to around $40 000/day.
Outlook
There remain a number of challenges to the LNG carrier market outlook, including the scale of the supply overhang which has built up in recent years, as well as the fact that some vessels on the orderbook are not tied to long-term projects, and could bolster supply in the short-term shipping market upon delivery. However, the short-term shipping market is still expected to gradually improve over the coming years.
The start-up of new export projects and re-start of some facilities is expected to help remove some tonnage re-let into the short-term market by producers or gas majors. Additionally, rising activity in both the Atlantic and Pacific basins in the rest of 2017 is expected to help decrease prompt tonnage availability.
Meanwhile, a notable increase in the average distance of shipped LNG cargoes has already been apparent in the early part of 2017, supported partly by rising US exports to Asia and the Middle East. Rising trade on long-haul routes is expected to be a key driver of demand growth in the short-term. In the longer-term, prospects for growth in short-term LNG trade volumes also appear positive, with importers increasingly seeking flexibility in contracts and trading houses playing a more prominent role.
Overall, market conditions remain difficult at present, but 2016 now appears to have represented the bottom of the LNG carrier shipping market, and utilisation in the sector is currently projected to gradually improve again over the coming years.
LNG Carrier S&P Market
Newbuilding Market
The LNG carrier newbuilding market has been very quiet since late 2015, with only a small number of contracts confirmed since then. The 2011-15 period saw a total of 240 LNG carriers ordered, whilst in 2016, only 8 orders were confirmed (including one LNG bunkering vessel). So far in 2017, the LNG carrier newbuilding market has remained relatively subdued, although ordering activity has picked up slightly.
In Q1 2017, 5 orders were placed, including three c. 170 000-180 000 m3 standard LNG carriers, and two LNG carriers with regasification capability. A further two dedicated FSRUs were also ordered in Q1, taking the total number of FSRU orders in the first three months of 2017 to four. Additional orders placed more recently included a contract for two LNG carriers in April, and four small-scale units in May.
Overall newbuilding activity for standard c. 180 000 m3 LNG carriers continues to be limited by the weak project sanctioning environment. Low gas prices continue to place pressure on the development of new projects, with only a handful of projects receiving FIDs since the commodity price downturn in mid-2014, limiting additional requirement for new LNG carriers.
Many of the small number of vessels which have been ordered in recent years have been tied to projects already under construction, with interest in speculative ordering largely remaining unattractive owing to the weak LNG carrier market conditions. The relatively low charter rate environment and surplus availability of LNG carrier tonnage has also led some project operators to elect to charter in LNG carriers for project business rather than place newbuilding orders.
Meanwhile, interest in small-scale LNG shipping does appear to have been increasing recently, with the first small-scale projects now in operation, including in Indonesia, Dubai, Lithuania and Jamaica, and a number of newbuilding orders reported in the year to date. The small-scale LNG sector remains embryonic, but a wide range of designs are being explored by shipyards, and further gradual developments in the sector are likely in the coming years as availability of LNG grows and trade patterns diversify.
The LNG carrier newbuilding market has also been characterised by rising interest in FSRUs in recent years. Increasing LNG supply, combined with the continued low gas price environment and improvements in regasification technology have supported ongoing discussion of developing floating regasification projects, with a wide range of countries reported to be interested in pursuing FSRU technology to facilitate LNG imports.
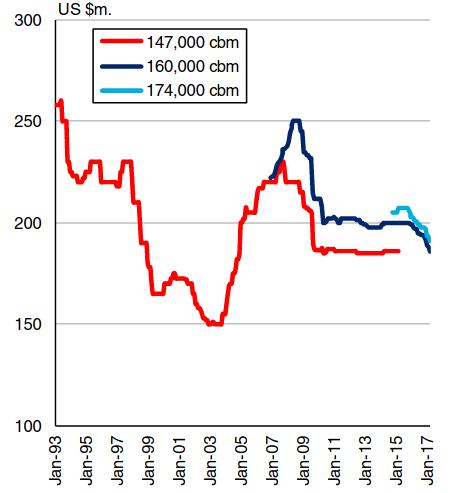
LNG carrier newbuilding prices have generally declined over recent years, reflecting the subdued newbuilding interest for both LNG carriers and other major ship types. At the end of March 2017, the guideline newbuilding price for a 174 000 m3 LNG carrier stood at $191 m, down 1 % compared to the start of the year, and 7 % lower than at the beginning of 2016. By the end of May 2017, the guideline price had fallen further to $187 m.
LNG carrier contracting appears unlikely to pick up significantly in the short to medium-term, reflecting expectations that a continued relatively weak gas price environment is likely to exert ongoing pressure on development of new projects. Speculative ordering is also likely to remain relatively limited whilst the earnings environment remains weak.
However, with gas, and LNG, expected to account for a growing proportion of the global energy mix into the long-term, a gradual improvement in gas price levels as demand rises should support an eventual return to higher project sanctioning (including in some higher cost regions as well as FLNG solutions in some cases), supporting increased LNG carrier contracting.
Secondhand Market
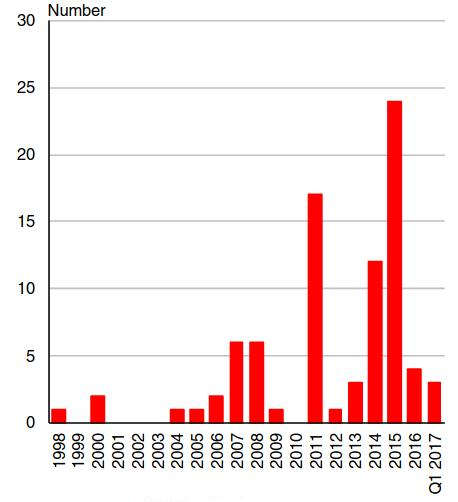
Historically, liquidity in the LNG carrier sale and purchase market has been relatively limited, largely reflecting the typically long-term nature of vessel employment contracts. While the number of LNG carrier sales rose to 25 in 2015, many of these transactions were accounted for by ships moving between different companies operating under the same parent group. In full year 2016, only four LNG carriers were sold secondhand, whilst the number of transactions in 2017 to date has remained limited.
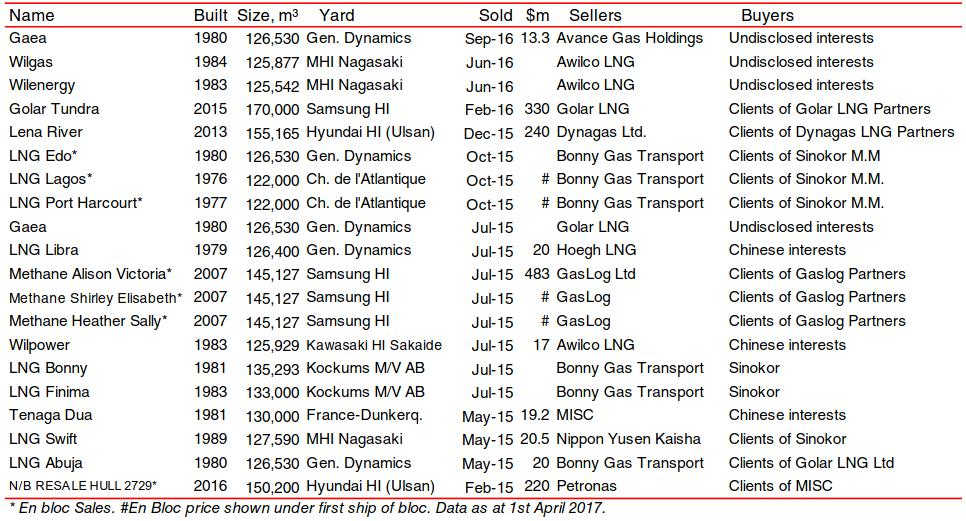
Vessels sold in 2016 included two veteran c. 125 000 m3 LNG carriers which will reportedly be used for storage purposes. Meanwhile, in April 2017, South Korean owner Sinokor was reported to have purchased three 1970s-built c. 126 400 m3 Jones-Act certified LNG carriers from General Dynamics.