Explore the dynamics of LNG global trade with in-depth analysis of gas markets, demand, supply, and trade patterns.
Understand historical growth, current trends, and future outlook for LNG exporters and importers across Asia/Pacific, Atlantic, and Middle East regions.
Gas In The Global Energy Markets
Along with coal and oil, natural gas is one of the so-called “Big Three” fuels that service global primary energy demand, accounting for an estimated 24 % of the global energy mix (and 28 % of fossil fuel consumption) in 2016. Between the year 2000 and 2016, global gas consumption increased by a CAGR of 2,4 % to reach 3,5 tr m3.
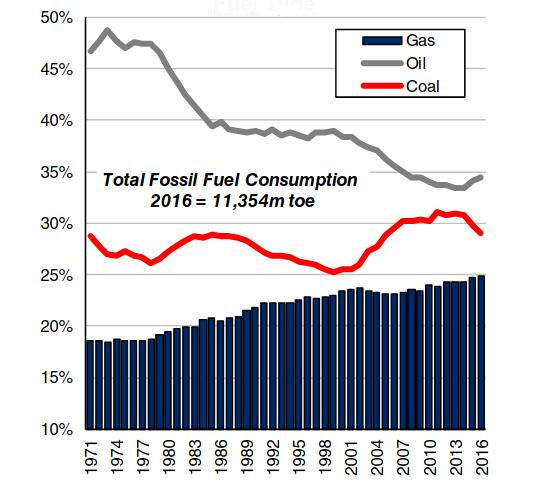
In comparison, global oil demand grew by a CAGR of 1,4 % over the same period. Global gas consumption is also projected to increase at a comparatively rapid pace in the long term, by around 1,5-2,0 % p. a. out to 2040, according to major forecasting agencies such as the IEA, whereas global oil demand is projected to increase by around 0,5-1,0 % p. a. over the same period and coal by just 0,4-0,6 %. As such, gas is expected to continue to account for an increasing share of the global energy mix.

A number of factors are behind this fairly positive outlook for natural gas. In broad terms, economic growth, particularly in non-OECD Asian countries, is expected to yield growing industrial utilisation of gas (for example in the construction and petrochemical sectors), as well as greater power generation and domestic heating gas usage.
Environmental policies are also expected to reinforce gas demand growth globally, as developing economies such as China seek to improve air quality by reducing (or at least slowing the growth of) coal-fired power generation in favour of gas; and as many developed economies seek to transition to a low carbon future, using natural gas as relatively less carbon intensive “bridging fuel”. On the supply side, some gas projects are challenged at present due to oversupply and the weaker commodity price environment but in the long term, abundant resources and relatively low extraction costs look set to favour greater gas usage, with onshore shale gas plays and offshore gas fields accounting for growing shares of global gas production.
Gas Demand
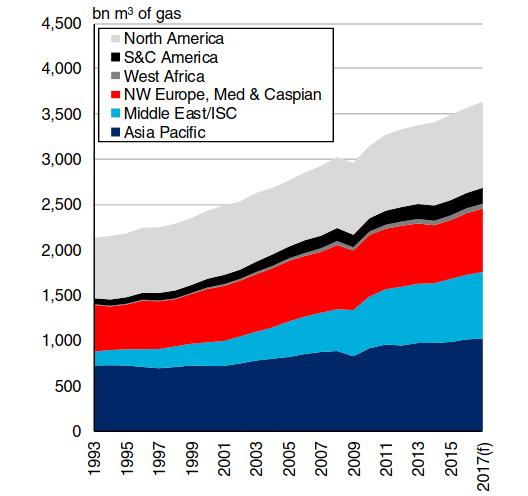
In 2016, world natural gas consumption increased by 1,8 % to an estimated 3,5 tr m3, compared to 2,0 % growth in 2015. Non-OECD natural gas demand grew by 2,5 % in 2016. Chinese gas demand growth picked up in 2016 after a relatively soft 2015, increasing by 5,4 %, though this was still muted compared to rapid average growth of 12 % in 2009-15. Indian gas demand growth firmed in 2016 too, reaching 7,3 % (versus 2,0 % in 2015) as cheap LNG imports offset supply-side constraints arising from gas production decline in the offshore KG-D6 block.
However, overall non-OECD gas demand growth was held back by falling demand elsewhere. In Brazil, the end of a multi-year drought enabled hydro-electric facilities to come back online, displacing some gas-fired power generation. Meanwhile, OECD gas demand growth in 2016 was led by the US, where industrial utilisation of cheap and abundant shale gas, notably in fertiliser production, was a significant factor behind demand growth of 1,9 %. In many other OECD countries, gas demand can be highly variable y-o-y due to residential heating demand fluctuating according to the length and intensity of winter conditions. Gas demand growth in most European OECD counties in 2016 was thus relatively subdued y-o-y after robust growth in 2015 due to a harsh winter. Global gas demand is projected to rise by 2,8 % y-o-y in 2017, to stand at 3,65 tr m3, mainly due to continuing robust growth in developing countries such as China and India, and firm growth in the US.
Gas Supply
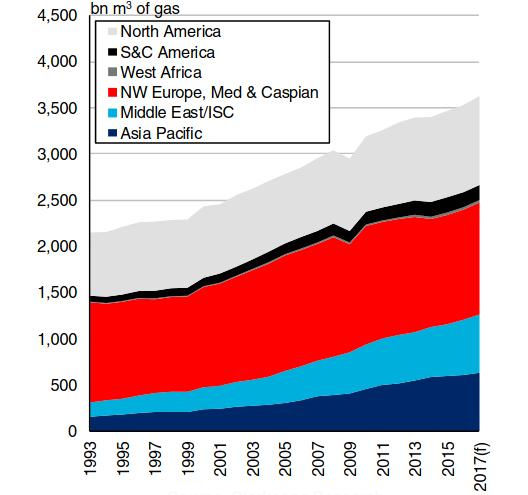
Following growth of 2,4 % in 2015, global natural gas production rose 2,2 % in 2016 to reach an estimated 3,56 tr m3, of which 31 % was Offshore terminal for transshipment of liquefied gasproduced offshore. The main sources of gas production growth in 2016 were the Middle East and Central Eurasia, notably from the South Pars field off-shore Iran and the onshore Galkynysh field in Turkmenistan. Total gas production in the US, the world’s largest gas producer, actually declined by 0,5 % y-o-y in 2016 (to 754 bn m3) as a result of reduced shale drilling in the weaker commodity price environment. Elsewhere, Australia was expected to be a major source of (offshore) gas production growth but as a result of start-up slippage at key projects such as Wheatstone LNG, growth in total Australian gas output was limited to 7,2 %, with production rising to 73 bn m3.
Global gas production is projected to increase by 2,0 % y-o-y in 2017, to reach 3,64 tr m3. Australian output is forecast to grow 38 % to 100,8 bn m3 due to major LNG-oriented projects coming onstream, with Australia projected to account for over a third of growth in global gas production. In Egypt, start-ups including WND Ph. 1 are projected to boost gas production by 25 % y-o-y to 54 bn m3. US shale gas production is also set to increase in 2017 as drilling picks up again. Total US gas production is projected to grow 1,8 %, to reach 767 bn m3, equivalent to 21 % of global gas production.
Natural Gas Trade
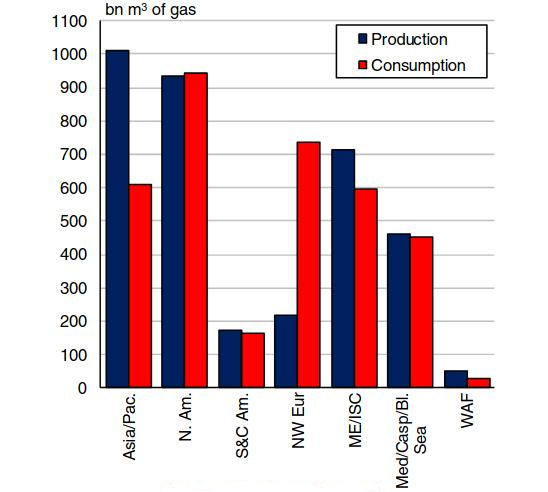
The majority of natural gas is produced and consumed within the same region (around 70 %), with the remaining volumes traded either via pipeline or as LNG. In 2016, around 70 % of natural gas trade was undertaken via pipeline. Given expectations for relatively robust growth in gas demand in the future, The International Trade LNG and LPGglobal natural gas trade is forecast to grow firmly in the coming years, partly reflecting the attraction of natural gas as a cleaner energy source and the increased commoditisation of natural gas.
Pipeline Trade
Global pipeline trade stood at 737,5 bn m3 in 2016, up by 4 % on the previous year. Russian exports via pipeline accounted for around a quarter of global natural gas pipeline exporters, standing at 191 bn m3 in 2016, relatively steady y-o-y, as some European importers have sought to diversify supply away from Russia following recent tensions. Growth in world pipeline trade in 2016 was principally accounted for by rising US-Mexico volumes, greater intra-European trade, and increased Italian imports from Algeria.
Further attempts by European countries to diversify gas supply include the construction of the Trans-Anatolian Gas Pipeline (TANAP), which will connect to the Trans Adriatic Pipeline (TAP) (which runs from Turkey to Italy, through Greece and Albania), will supply Azeri gas to Europe and Turkey. TANAP is scheduled to deliver gas to the Turkish market in 2018 and to connect to the TAP by 2020. Furthermore, in early April 2017, Israel signed a preliminary agreement with Italy, Greece and Cyprus to pipe natural gas to Europe via a subsea pipeline to be constructed across the Mediterranean. European natural gas importers have also increasingly looked to LNG to reduce reliance on Russian piped gas, with Lithuania and Poland commencing LNG imports in 2014 and 2016 respectively.
Meanwhile, Russia has sought to look to markets other than Europe with regards to expanding pipeline exports. For instance, the Power of Siberia pipeline, which is currently under construction, is intended to supply gas from Siberia to China. Commercial operations are scheduled to start by 2021, with CNPC having agreed to buy 38 bn m3 of natural gas per year. However, there are concerns over the longer-term future of this project.
Elsewhere, as international relations with Iran have improved in recent years a number of pipeline projects have been proposed, most notably the Peace Pipeline, which is intended to transport gas from Iran to Pakistan. The project has faced a number of political and financial difficulties and it is far from clear whether the pipeline will be completed. Indeed, reports suggest that Iran may cancel the project due to lengthy delays. Meanwhile, the so-called Friendship Pipeline which would supply Iraq and Syria with Iranian natural gas has been put on hold due to ongoing conflict in both receiver nations.
LNG Trade
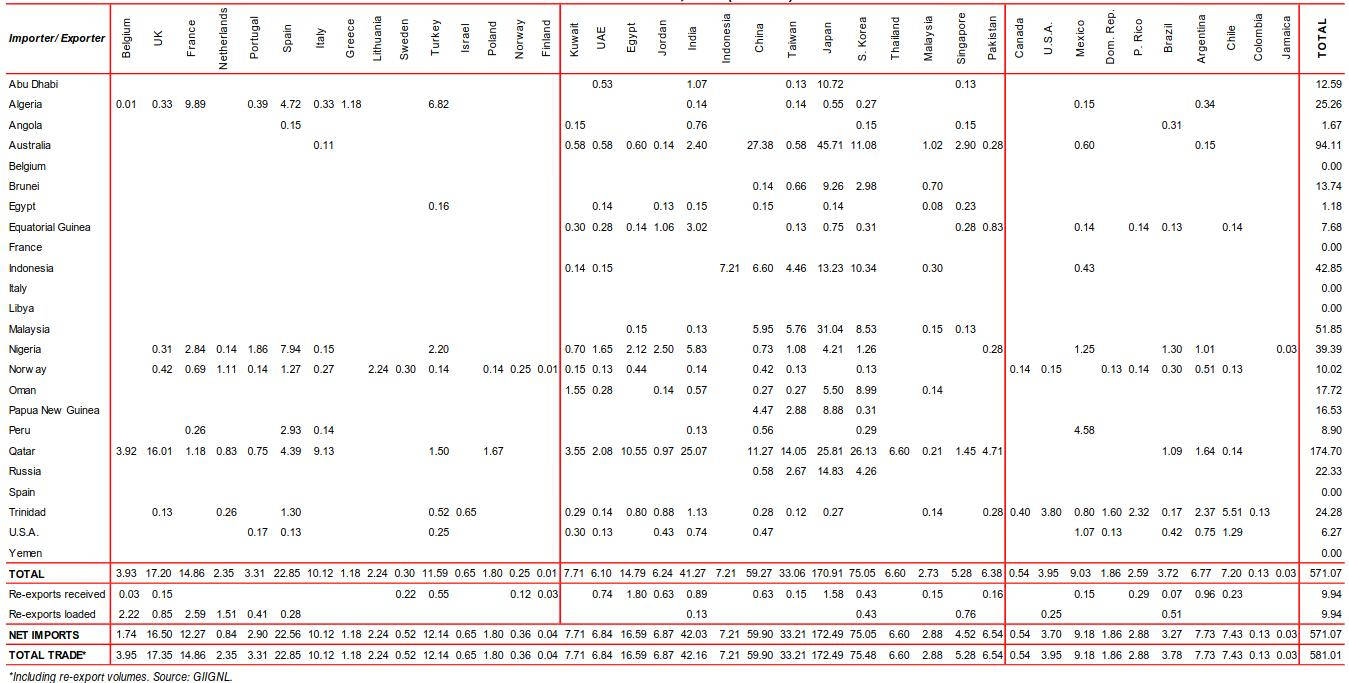
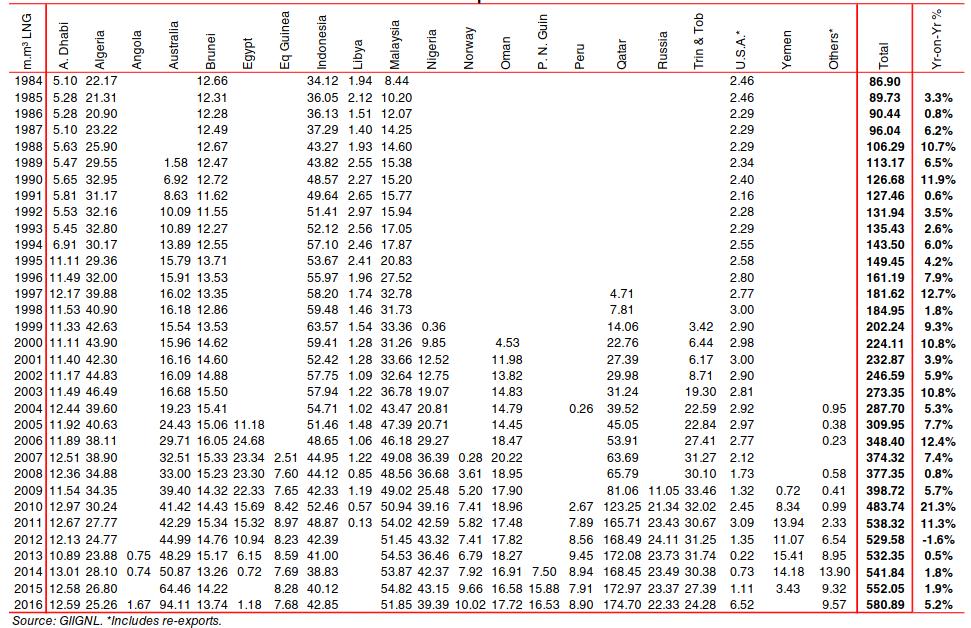
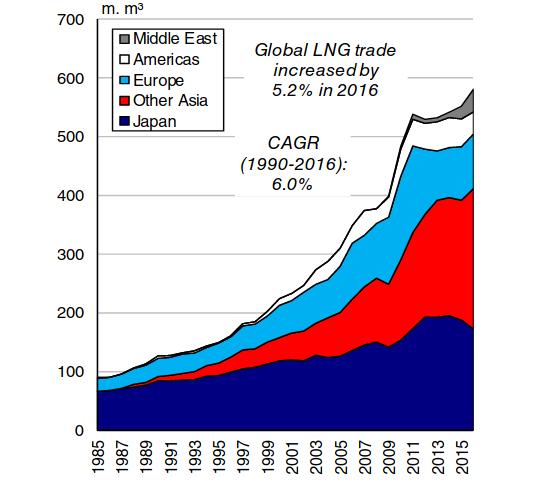
In 2016, global LNG trade stood at 580,9 m m3, an increase of 5,2 % y-o-y (although in terms of tonnes LNG trade rose 7,4 %). Whilst pipeline trade remains the principal method of transporting natural gas, LNG has become more important in global natural gas trade in recent years. As LNG supply has grown and gas prices have fallen, a number of nations have sought to import natural gas via LNG rather than via pipeline, whilst the development and increased usage of FSRU technology has also meant that some countries have been able to begin importing LNG relatively more quickly and potentially at a lower cost than by constructing Equipment and cargo system of LNG onshore terminalsland-based terminals. Overall, LNG transport represented 32 % of world natural gas trade in 2016, compared to 26 % in 2005.
Into the medium and longer-term, LNG trade is expected to play an increasingly important role in global natural gas trade. According to the IEA, LNG trade will account for 70 % of the growth in natural gas trade between 2014 and 2040, which would take LNG’s share of global natural gas trade to over 50 %.
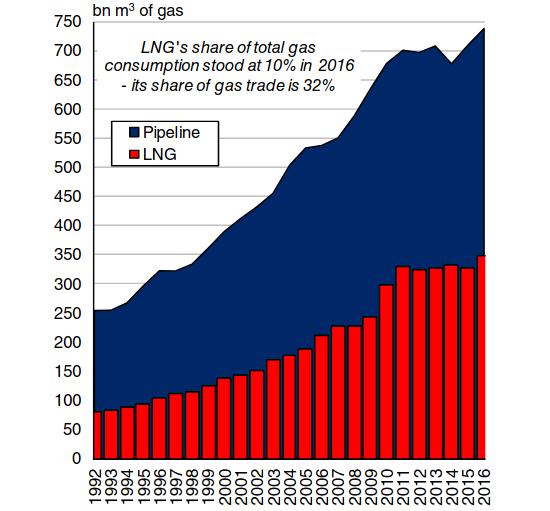
This trend is expected to be driven by two main factors. Firstly, there is likely to be limited support for expansion of gas pipeline networks, particularly given the relative availability of LNG.
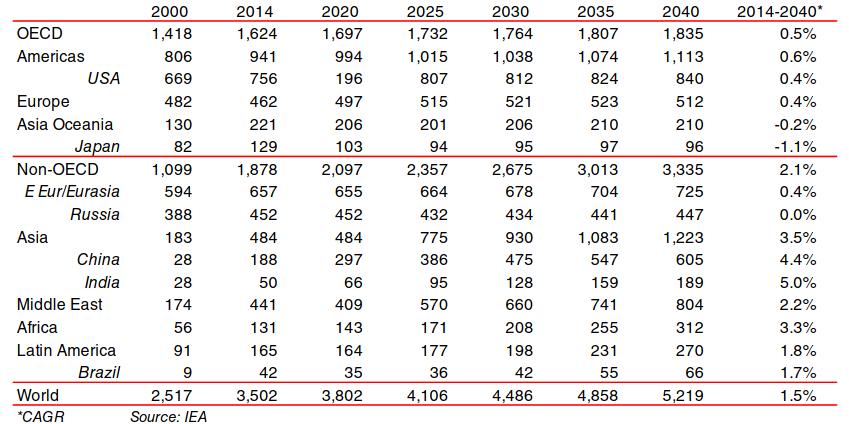
Secondly, the attractiveness of FSRUs to smaller importers in particular is likely to enable a growing number of countries to participate in LNG trade, continuing the trend seen in recent years which has already seen the number of LNG importing nations grow from 20 in 2006 to 39 in 2016. FSRUs are already playing a growing role in LNG trade, with 24 FSRUs in the fleet at the start of April 2017, and another 13 vessels on order. Meanwhile, a gradual increase in adoption of FLNG solutions in the long-term could also help to lower capital costs for some export projects.
LNG Trade Overview
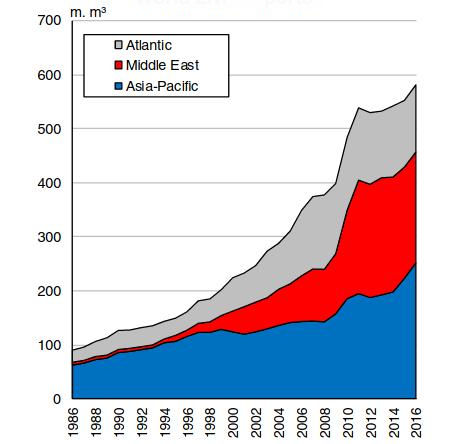
LNG trade has grown significantly over recent decades, becoming increasingly diverse and less dominated by long-term supply contracts over time. In the late 1990s, LNG trade totalled less than 200 m m3, with 98 % of volumes accounted for by long-term agreements between suppliers and buyers. During the 2000s, the share of LNG trade accounted for by spot or short-term trading increased, supported by the increasing commoditisation of LNG (partly reflecting greater interest by trading houses), increased flexibility in contracts, as well as the rapid emergence of new importers. By 2016, LNG trade stood at 581 m m3, with only 70 % of volumes accounted for by long-term contracts.
Historical Trade Growth
The first LNG shipment was in 1959, with rising demand in Japan driving expansion in the 1970s. Over the next few decades, more countries began to participate in LNG trade, and by 2016, 39 countries imported LNG, supplied by 18 exporters (or 29 including countries which re-exported cargoes). Historically, LNG trade has increased robustly, growing by an average rate of around 6 % per annum in 1984-16.
However, there have been distinct phases of growth, with volumes expanding on average by 16 % p. a. in 2010-11, before growth slowed to an average of 1 % p.a. in 2012-15. 2016 marked a return to more robust levels of growth, with volumes expanding by 5%.
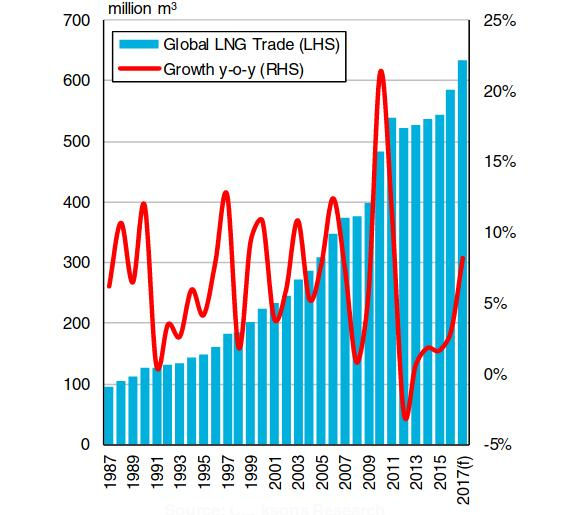
However, the average distance of LNG trade decreased in 2016 as a result of fast growth in intra-Pacific and intra-Middle Eastern trade, with overall LNG trade in terms of tonne-miles falling slightly y-o-y.
LNG Trade Patterns
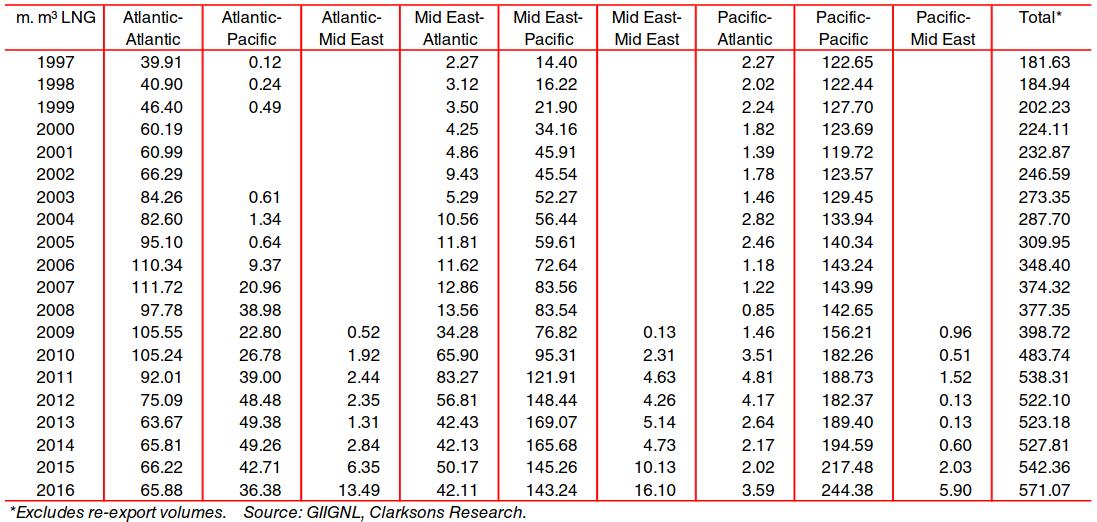
Breaking down LNG trade into regional flows between the Asia/Pacific, Atlantic and Middle East regions, the largest trade remains intra-regional shipments between Asian exporters and importers, followed by Middle Eastern exports to Asia.
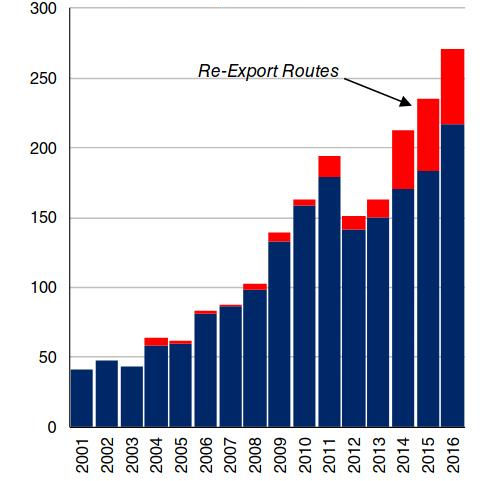
While the Middle East remains a dominant export region, imports into the Middle East have also grown, providing a key source of global trade growth in 2016. Overall, the pattern of LNG trade today is significantly more diverse and complex than even a few years ago, with LNG shipped on a total of 271 routes in 2016, up from 60 in 2006.
Outlook
Growth in global LNG trade is currently projected to accelerate in 2017 to 9 %, reflecting the significant volume of liquefaction capacity expected to start up, particularly in Australia and the US.
Average shipping distances are also expected to increase, supported by rising US exports to Asia and the Middle East. Trade patterns are also likely to diversify further in coming years, largely reflecting the wide range of countries which have expressed an interest in International trade of Liquefied Natural Gas in maritime industrystarting to import LNG.
LNG Exporters
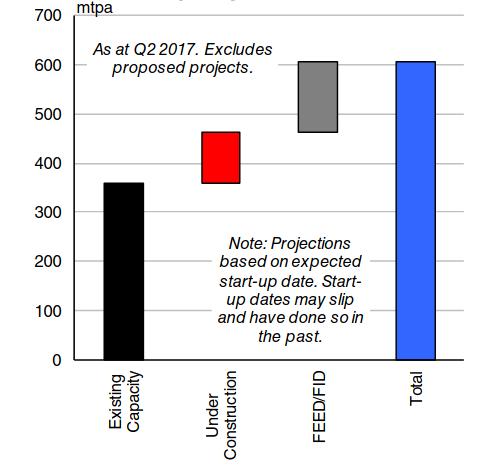
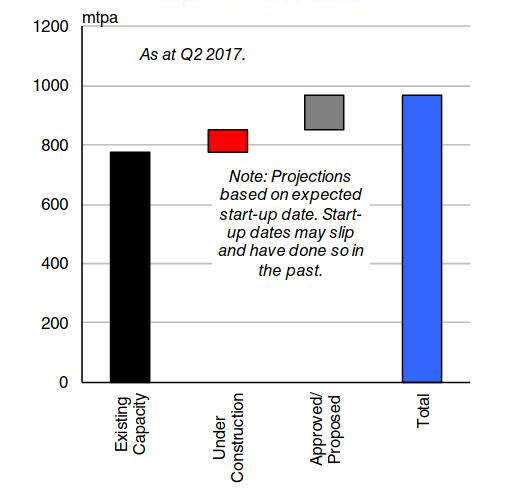
At Q2 2017, global nameplate liquefaction capacity stood at 360 mtpa, comprised of 108 liquefaction trains. The implied utilisation rate of global liquefaction capacity stood at around 80 % in 2016.
Asia/Pacific
LNG exports from the Asia/Pacific region expanded 12,7 % to total 251,6 m m3 in 2016, equivalent to 43 % of global LNG trade. This growth was principally driven by the continued expansion of LNG exports from Australia following the ramp up of operations at the APLNG, Gorgon LNG and Darwin LNG facilities, as well as the commencement of operations at the second train of the Gladstone LNG project.
All told, Australian liquefaction capacity expanded by 23,3 mtpa in 2016, supporting a 46 % y-o-y expansion in Australian LNG exports to 94,1 m m3. Meanwhile, exports from Indonesia and Papua New Guinea rose by 7 % and 4 % respectively in 2016 to 42,8 m m3 and 16,5 m m3.
Atlantic
LNG exports from the Atlantic basin rose 0,9 % in 2016 to 124,4 m m3. Exports were supported by the start-up of shipments out of the Sabine Pass terminal in the US Gulf, with volumes from the region totalling 6,5 m m3. Meanwhile, Nigerian LNG exports came under pressure from continued disruptions in the Niger Delta region, and fell 9 % in 2016.
Read also: Liquefied Natural Gas Commercial Considerations
Conversely, operations at the beleaguered Angola LNG facility recommenced in 2016. Elsewhere, continued issues with feedstock availability presented headwinds for LNG exports from Trinidad and Tobago, with shipments down 11 % in 2016 to 24,3 m m3 and gas output falling by 5 %. Atlantic Basin re-exports rose 7 % to 8,6 m m3, on the back of a near trebling in French re-exports.
Middle East
Total Middle Eastern LNG exports fell for the third consecutive year in 2016, by 0,3 %, to 205,0 m m3. However, Qatari exports increased 1,0 % in 2016 to 174,7 m m3, further cementing the nation’s status as the largest LNG exporter.
Following a sharp decline in 2015, LNG exports from Yemen ceased in 2016 due to the ongoing civil war and unrest in the country, with force majeure declared on exports in April 2015. Meanwhile, exports from the UAE remained broadly steady y-o-y at 12,6 m m3 whilst shipments out of Oman rose by 7 % to stand at 17,7 m m3, in spite of issues stemming from firm domestic gas demand.
Re-Exports
Global re-export trade increased by 2,7 % in 2016 to stand at 9,9 m m3. Once again Europe remained the key load region for re-exports, accounting for nearly 80 % of cargoes loaded. Given the decline in global LNG prices and the narrow differentials between regional benchmarks, cross-basin arbitrage opportunities remained relatively limited.
Brazil re-joined the fold of LNG re-exporting nations, taking the total number of re-exporting nations in 2016 to 11. On the importer side 21 nations received LNG re-exports, five for the first time. The Middle East and Asia remained the largest destination for re-exports together importing 7,2 m m3 of re-exported volumes.
Outlook
As at Q2 2017, a total of eight LNG liquefaction projects with a combined 31,4 mtpa capacity were scheduled to come online in the rest of 2017, with a further 54,8 mtpa of capacity expected to be added in 2018-19.
Start-ups in Australia and US are scheduled to continue to dominate, and following the commencement of operations in early 2017 of the third liquefaction trains at Gorgon LNG in Australia and Sabine Pass in the US, a further five projects in these nations are scheduled to commence in 2017.
A fourth train at Sabine Pass is expected to start up in 2H 2017, whilst the 5,75 mtpa Cove Point project in the US is also scheduled to begin exports. In Australia, two 4,5 mtpa trains at Wheatstone are scheduled to come online, as is the 8,5 mtpa Ichthys LNG plant.
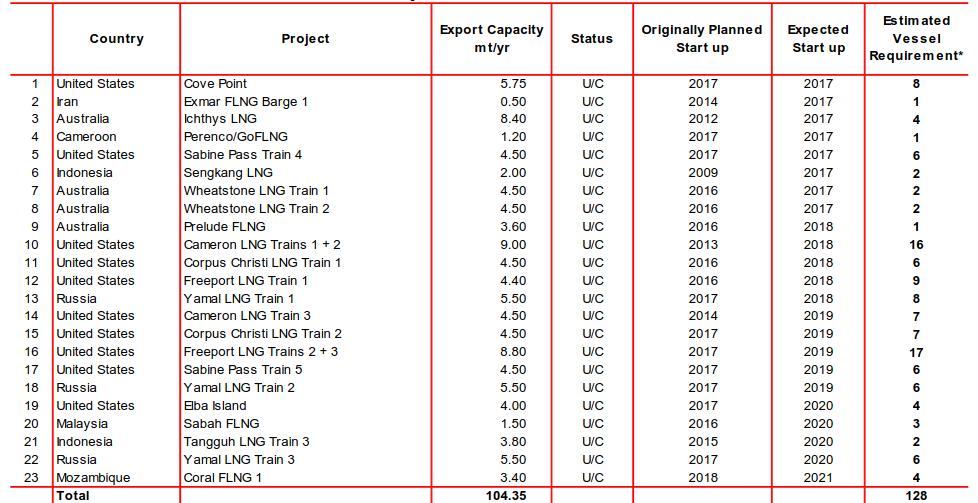
* Project Status: U/C = projects currently under construction; FEED = projects at the Front End Engineering and Design phase; Proposed = projects mooted, prior to FEED stage
While exports from Australia and the US are expected to grow firmly in 2017, Qatar is expected remain the world’s largest LNG supplier. The fallout in June 2017 between Qatar and a number of countries including Egypt and the UAE had raised questions over the potential effect on the LNG market. However, the overall impact currently appears to be limited.
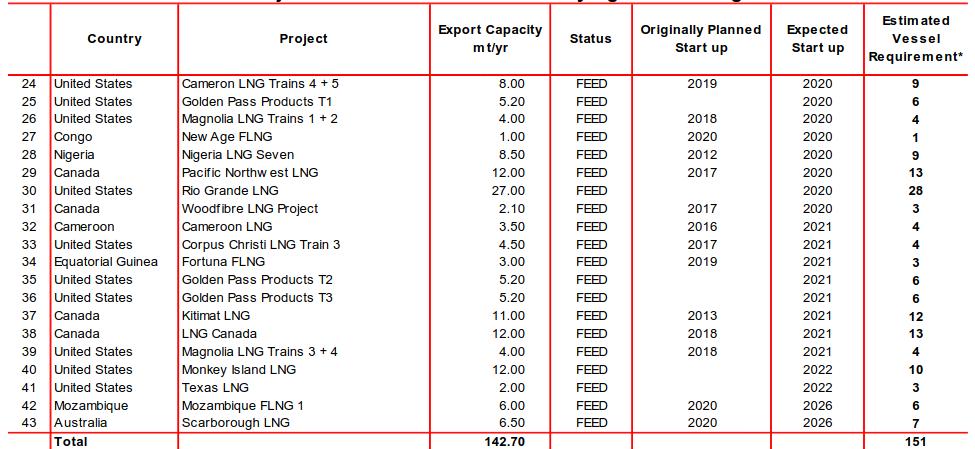
* Project Status: U/C = projects currently under construction; FEED = projects at the Front End Engineering and Design phase; Proposed = projects mooted, prior to FEED stage
Most Egyptian imports from Qatar are sourced via third party traders so may not be significantly affected, whilst the volume of LNG shipped from Qatar to the UAE is limited.
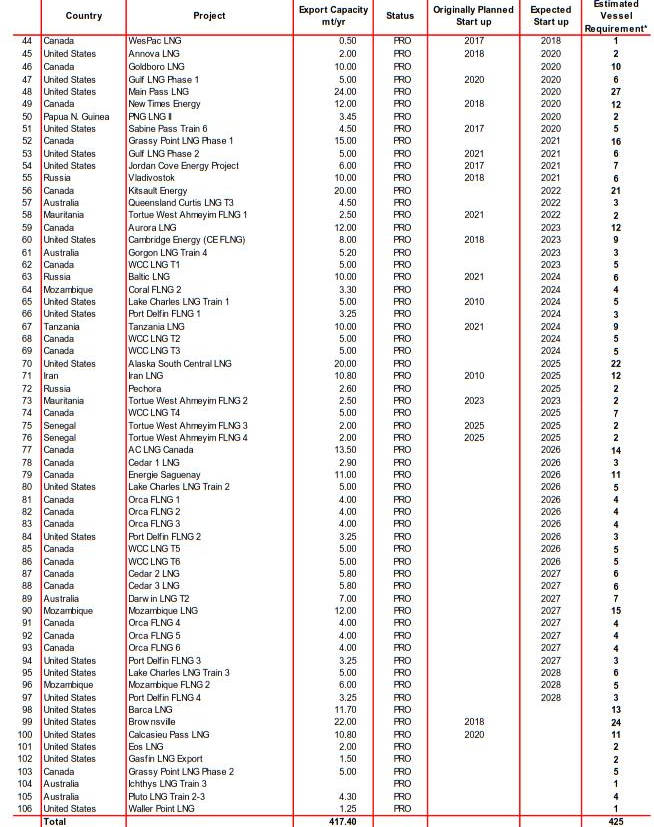
* Project Status: U/C = projects currently under construction; FEED = projects at the Front End Engineering and Design phase; Proposed = projects mooted, prior to FEED stage
A larger impact could result from the cessation of Qatari gas flow to the UAE via the Dolphin pipeline, although this outcome appears to be unlikely.
LNG Importers
In 2016, 39 countries imported LNG, compared to 17 ten years previously. At the start of April 2017 there were a total of 135 regasification terminals of a combined 776,4 mtpa. Global utilisation of nameplate regasification capacity stood at 32 % in 2016.
Asia/Pacific
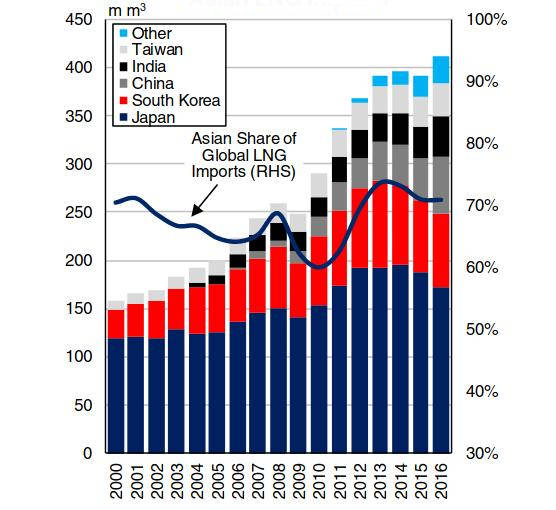
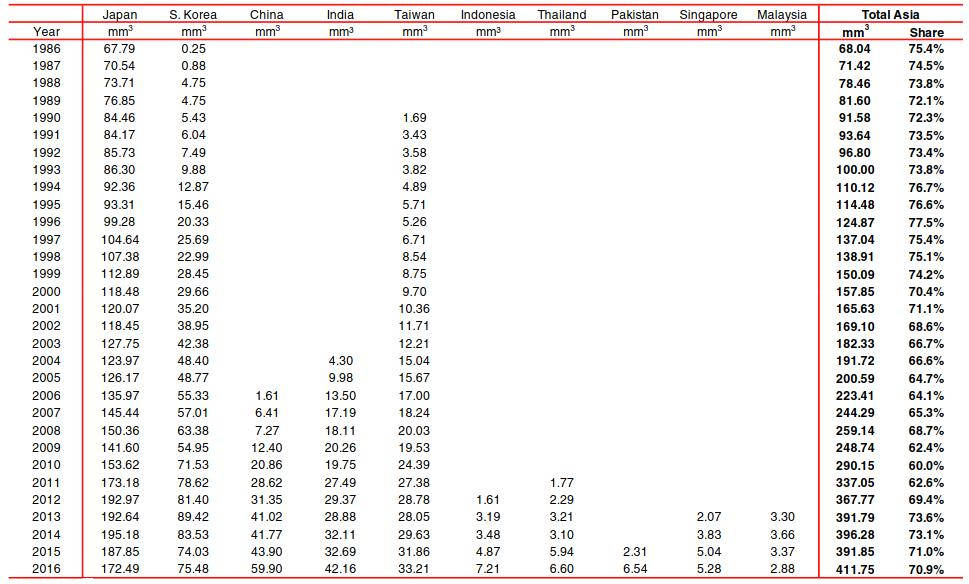
LNG imports into the Asia/Pacific region increased by 5,1 % in 2016 to top 400 m m3 for the first time, standing as they did at 411,8 m m3. Japan remained the largest importer of LNG, although volumes into Japan slumped 7 % in 2016 to 174 m m3, as gas demand declined due to increased nuclear and renewable power generation as well as soft economic conditions.
In spite of this, two new Japanese regasification terminals with a combined capacity of 4 mtpa opened in 2016, taking total Japanese import capacity to 207,3 mtpa. Meanwhile, Korean imports rose 2 % to 75,5 m m3, reportedly partly supported by some inventory building. In non-OECD Asia, Indian imports surged 31 % to 42,9 m m3 in 2017. This was supported by firm growth in domestic gas demand on the back of low prices, with one major importer renegotiating a contract in order to capitalise on lower LNG costs.
Meanwhile in China, on the back of a continued push towards cleaner fuels, increased supply from countries such as Australia, and the opening of two regasification terminals with a combined capacity of 5 mtpa, Chinese LNG imports rose 36 % in 2016 to 59,9 m m3. Elsewhere, Pakistani LNG imports nearly trebled y-o-y to 6,5 m m3 as imports via the “Exquisite” FSRU ramped-up.
Atlantic
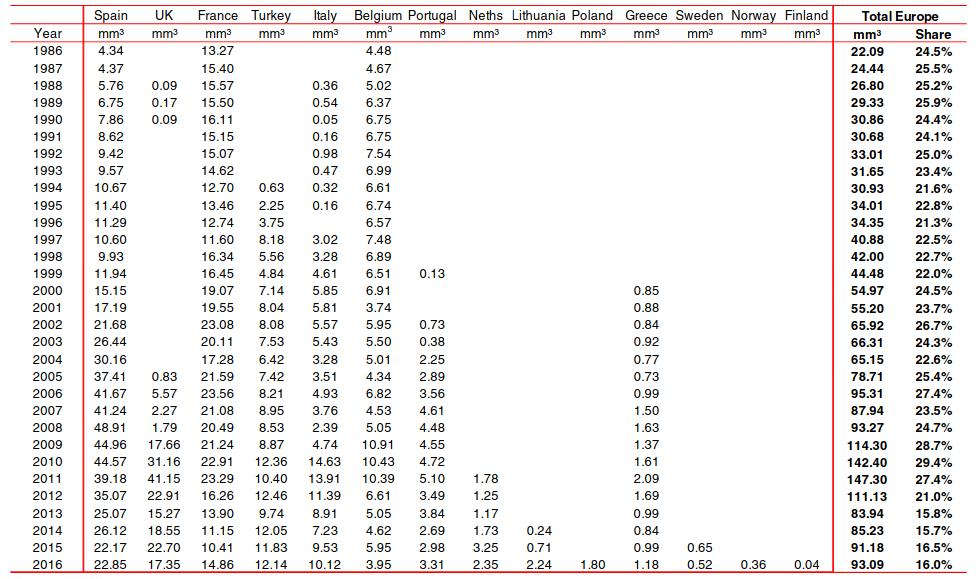
Following an uptick in 2015, total European imports increased again in 2016 by 2,1 % to 93,1 m m3. This was despite declines of 70 % and 27 % in Belgian and UK imports respectively, partly due to greater pipeline volumes, particularly into the UK.
By contrast, Lithuania and Turkey both increased their LNG imports notably in 2016 to 2,2 m m3 and 12,1 m m3 respectively.

Furthermore, Finland, Norway and Poland all imported LNG for the first time in 2016, with Polish LNG imports totalling 1,8 m m3, serviced by the 3,6 mtpa Swinoujscie facility.
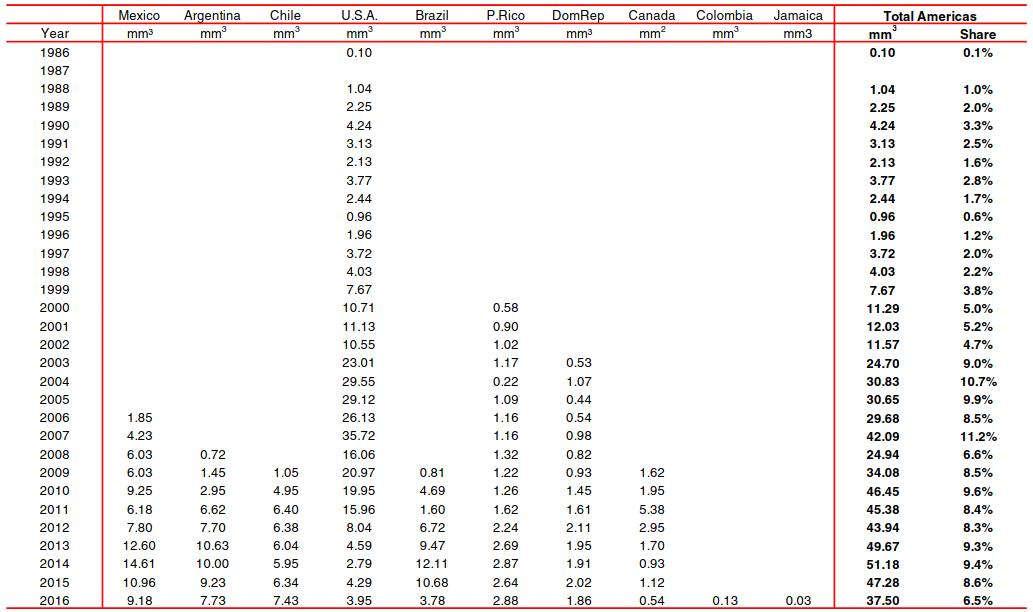
Across the Atlantic, LNG imports into the Americas declined by 18,7 % in 2016 to 37,5 m m3, the lowest level since 2009. This was principally due to a 69 % drop in Brazilian LNG imports to 3,8 m m3 as demand for gas fell on the back of increased hydroelectric power output. Elsewhere, Colombia imported LNG for the first time in 2016, via the “Hoegh Grace” FSRU. Similarly, Jamaica also imported a cargo of LNG for the first time in 2016, via the “Golar Arctic” FSRU.
Middle East
In 2016, Middle Eastern LNG imports nearly doubled y-o-y to 38,7 m m3. Egyptian imports more than trebled to 16,6 m m3 in 2016, supported by continued robust gas demand of 4,5 %. Additionally, LNG exports restarted from the Idku terminal in 2016, further boosting Egyptian LNG import requirement.
Meanwhile, Jordanian imports via the “Golar Eskimo” FSRU ramped-up in 2016 to total 6,9 m m3 as Jordan continues to make up the supply deficit from a lack of Egyptian gas imports with LNG.
Imports into the UAE rose by 55 % in 2016 to stand at 6,8 m m3, partly supported by increased gas demand as well as the start-up of operations at two FSRUs. Meanwhile, Kuwaiti LNG imports rose by 15 % to stand at 7,7 m m3 in 2016.
Outlook
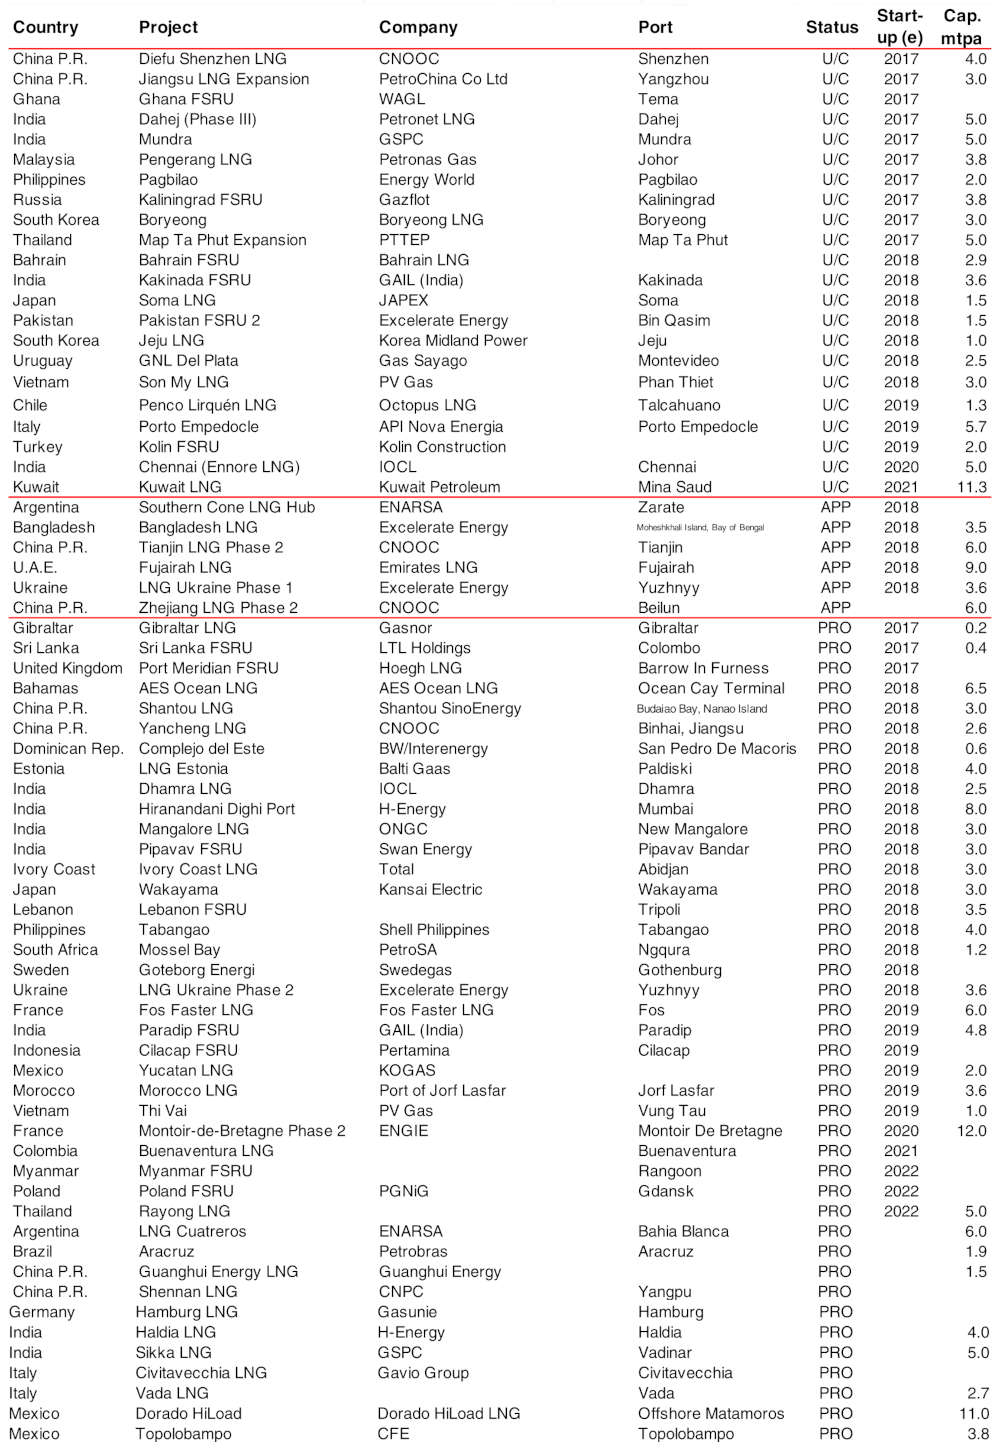
In 2017, global LNG imports are projected to increase by 8,9 %, whilst global regasification capacity is expected to increase by 35,2 mtpa, with a total of 22 projects currently under construction. A significant proportion of this regasification capacity under construction is located in Asia and the Middle East, with these regions expected to remain the focus of growth in imports. Chinese and Indian LNG imports are expected to rise 28 % and 25 % respectively in 2017, supported by continued growth of gas demand, expansion of regasification capacity and, particularly in the case of China, further focus towards cleaner energy.

However, Japanese LNG imports are expected to remain under pressure, with further nuclear reactor restarts expected in 2017 and the economy likely to remain under pressure. Elsewhere, European LNG imports are expected to recover somewhat in 2017, boosted by continued low LNG prices and a look to move away from coal-fired power generation in several countries.
It is likely that LNG prices will remain depressed, which although potentially detrimental to export growth further ahead, should continue to incentivise nations to look to LNG in the short to mid-term, which should both expand the trading network and boost volumes.
