It has always been difficult to incorporate the effect of environmental conditions into an economical evaluation. This article describes the influence of weather conditions to the LNG shipping costs.
- Summary
- Nomenclature
- Introduction
- LNG Chain
- Exploration and Production
- Liquefaction
- Shipping
- Storage and Regasification
- Operational Profile and Design
- Trade
- Schedule
- LNG Carrier Design
- Capital and Running Costs
- Capital Costs
- Running Costs
- Voyage Costs
- Scenario Simulations
- Operational Scenario
- Results Simulations
- Voyage Costs – Steam Turbine
- Voyage Costs – Diesel Engine
- Economical Evaluation
- Conclusion
Summary
This study shows that scenario simulations can be a valuable tool to get an idea about the uncertainties concerning power demand and roundtrip duration due to wind, waves and current. This article presents the procedure and results of an economical evaluation of an LNG carrier with two different propulsion plant configurations.
The evaluation is firstly performed without weather influences. Subsequently, the weather influences are incorporated by using scenario simulations.
Nomenclature
- MMBtu – Million British thermal units. 1 MMBtu natural gas equals approximately 0,019 tonnes LNG;
- Tcf – Trillion cubic feet. 1 Tcf natural gas equals approximately 21 million tonnes LNG;
- mtpa – Million tonnes per annum;
- tonnes – Metric ton (1 000 kg).
Unless otherwise stated, all prices mentioned in this article are given at the price level of 2003.
Introduction
In the last couple of years several studies have been made to analyse potential economic and environmental benefit of alternative propulsion systems as diesel-electric, gas turbine driven power plants (both with utilisation of boil-off gas) or low speed diesel engines in combination with reliquefaction plants.
A significant simplification in most feasibility studies is the fixed voyage duration and fixed propulsion load. The influence of varying weather conditions on a particular route are generally not taken into account. However, the constantly changing wind, waves and (tidal) currents play a major role in the reliability of the service as well as the fuel consumption and thereby influence the revenue-making potential of a new concept.
Maritime Research Institute Netherlands developed a new generation of scenario simulation tools that offer the opportunity to solve the above problem in a more detailed and realistic way. In these simulations several years of operational service are carefully mimicked and account for the weather on the adopted route, a scenario for the way the master sails the ship (including risk avoiding behaviour) and the hydrodynamic characteristics of the design.
In the present case study an LNG carrier equipped with a low speed diesel engine in combination with a reliquefaction plant is compared with a conventional steam turbine powered LNG carrier. The simulations are made on the Qatar – US East Coast trade where the Suez Canal passage is a complicating factor. The results of the study are presented in terms of transport capacity, reliability, required freight rate and rate of return.
LNG Chain
Exploration and Production
This stage covers the exploration, development and production of natural gas fields. Most of the time natural gas is discovered during the search for oil. LNG projects require large gas reserves to produce for at least 15 to 20 years. According to BP’s statistical review of world energy the proven reserves of natural gas are 5 501 Tcf (2003). The worldwide natural gas consumption has grown from 86,0 Tcf in 2000 to 91,4 Tcf in 2003.
For short distances natural gas is transported by pipeline. The turning point lies around 1 100 nautical miles for Offshore supply chain of Liquefied Natural Gasoffshore pipelines and 2100 nm for onshore pipelines over longer distances shipping LNG is generally cheaper.
The basic price of natural gas is around 0,50-1,00 US$/MMBtu.
Liquefaction
Liquefaction is the process of cooling down natural gas to a liquid state (-161 °C at atmospheric pressure). The volume in liquefied state is reduced around 600 times, which makes it feasible to transport LNG by ship. The global liquefaction capacity is expected to increase from 6,6 Tcf in 2003 to approximately 9,4 Tcf in 2007.
The cost of liquefaction amount to 0,80-1,20 $/MMBtu.
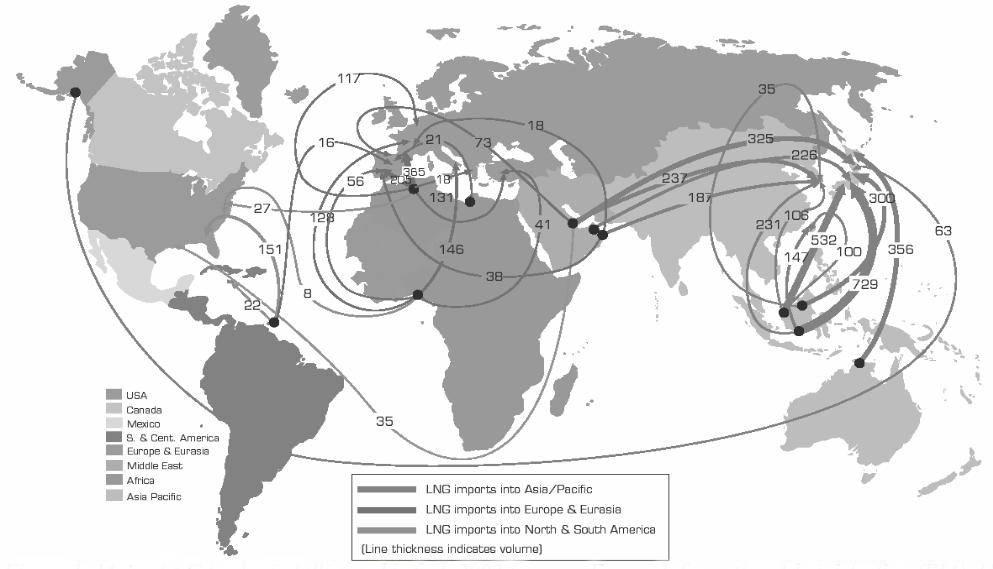
Shipping
In 2002, 12 countries shipped 5,4 Tcf natural gas (Picture 1). The largest LNG exporter is Indonesia (21 %) followed by Algeria (17 %), Malaysia (14 %) and Qatar (13 %).
According to LNG One World the current fleet consists of 164 LNG carriers with 81 vessels on order. The cargo capacity of most newbuildings is between 135 000 and 145 000 m3 LNG. The applied cargo containment systems are generally the spherical (Moss) design or the membrane design. At the moment two third of the all newbuildings are equipped with Cargo Containment Systems of LPG and LNGmembrane type cargo tanks. According to Fairplay, the newbuilding cost of an LNG carrier is roughly 150 to 190 million dollar.
LNG carriers have traditionally been propelled by steam turbine power plants, mainly because the cargo boil-off can be used as fuel and of course because of its reliability. A great disadvantage of steam turbine propulsion is the very low efficiency.
In general the transportation costs increase linearly with distance. The unit cost of transport is a function of the capital cost, the financing terms, the rate of return and the distance to be covered.
For a typical Middle East to Far East project the transportation costs are about 0,9–1,0 $/MMBt.
Storage and Regasification
LNG is unloaded from the LNG carrier to the import terminal. An import terminal is equipped with storage tanks with a capacity of at least one or two LNG carrier cargos. From the storage tanks the LNG is regasified and transported by pipeline to the consumers. The costs of storage and regasification are estimated at 0,3-0,5 $/MMBtu.
Operational Profile and Design
Trade
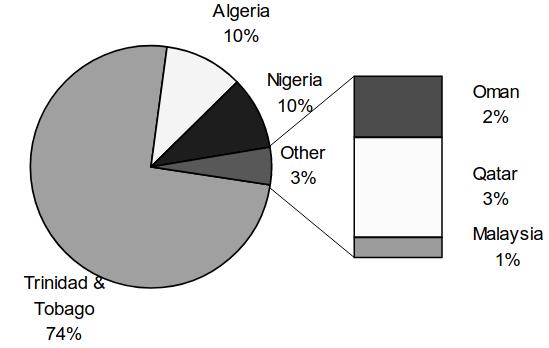
According to EIA, it is expected that overall US gas demand will increase from 22,5 Tcf in 2002 to around 31,4 Tcf in 2025 (+40 %). The US domestic natural gas production and the Canadian pipeline imports are not likely to meet this increase. For this reason it is expected that LNG imports will increase significantly in the coming years. In 2003 most LNG imports originated from Trinidad & Tobago, Algeria and Nigeria (Picture 2). These exporting countries are preferred to Oman, Qatar and Malaysia mainly because of the distance advantage.
However, for the present study it is chosen to evaluate a relatively long route between Qatar and the northeast coast of the US. This route is selected for the following reasons:
- The reserves of Qatar are almost 15 % of the total proven reserves of the world. It is expected that export will increase significantly when the new liquefaction trains become operational in 2004-2006.
- Due to the increasing natural gas demand in the US prices will rise and it becomes feasible to import LNG from distant exporting terminals.
- The Suez Canal is an expensive and logistic barrier on this route, which makes it an interesting case.
- The weather conditions on the transatlantic crossing will require a more complete approach because it is expected that the reliability and fuel consumption will be influenced significantly by wind, waves and current.
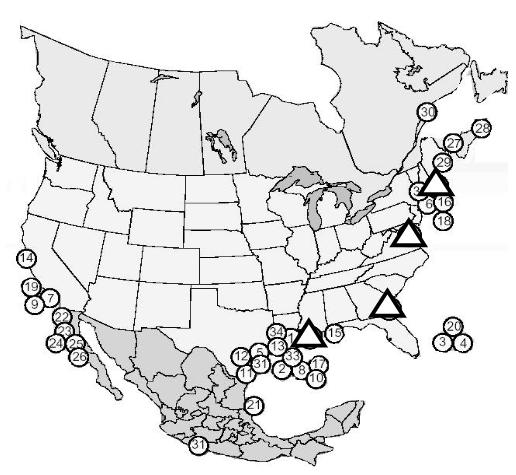
In the figure below the four existing US importing terminals are denoted by the triangles. The numbered circles denote the planned import terminals. Everett is the most northern existing terminal. This terminal or one of the nearby planned terminals is chosen as importing terminal.
Schedule
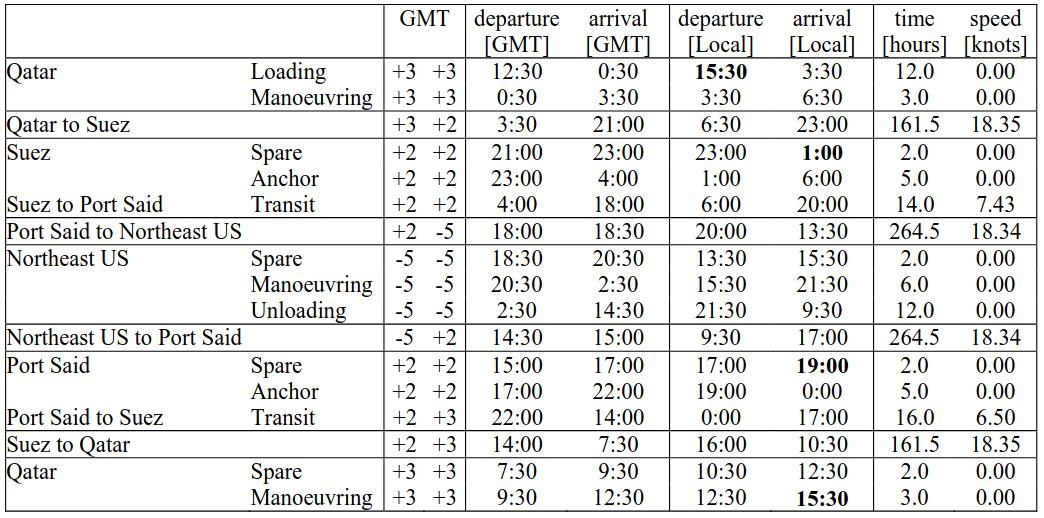
The schedule, which is adopted between Qatar and the northeast US coast, is given in Table 2. The total roundtrip time is 39 days which equals 9,23 roundtrips per year when 5 non-workable days per year are taken into account.
The route is cut in two by the Suez Canal which introduces two additional fixed arrival times. Arriving late at Suez or Port Said cause at best a considerable surcharge or at worst a day’s delay because there is only one departure from each side of the canal (LNG carriers which are not gas free have to take the first convoy in both directions).
In addition the arrival time at Qatar and starting loading LNG (both bold-printed in the schedule) should match when roundtrips are made on a regular basis.
At first glance it appears that there is not much spare time incorporated in the schedule, but the scheduled speed is 18,35 knots while the trial speed is around 21 knots at 90 % MCR. Accordingly it could be possible to catch up delays up to one day without missing the Suez Canal slot provided that the weather conditions are good. Furthermore, it is possible to arrive up to two hours late at Suez or Port Said if a surcharge is paid. The applied manoeuvring time of three hours per arrival are estimates only, and are not based on detailed information of the local situation.
LNG Carrier Design
It is chosen to evaluate a conventional membrane type LNG carrier with a nominal cargo capacity of 145 000 m3. The main dimensions of the vessel are given in Table 1. The boil-off rate in loaded and ballast condition is approximated at 0,12 % respectively 0,06 % of nominal cargo capacity per day.
| Table 1. Main dimensions | ||
|---|---|---|
| Length over all | [m] | 286,00 |
| Length perpendiculars | [m] | 274,00 |
| Breadth | [m] | 43,35 |
| Depth to main deck | [m] | 26,00 |
| Draught | [m] | 11,38 |
| Deadweight | [tonnes] | 71 809 |
| Gross tonnage | [tonnes] | 98 261 |
| Displacement | [m3] | 102 170 |
| Cargo capacity | [m3] | 145 000 |
The design is evaluated for two propulsion plant configurations. It is assumed that the engine room length, and therefore the cargo capacity, is equal for both alternatives.
The first alternative is equipped with a steam turbine as prime mover. Two dual fuel boilers supply steam for the turbine (29,0 MW at 83 RPM) and the two turbo generators (2×3 500 kW). The adopted efficiencies are respectively 0,88, 0,35 and 0,25.
The second alternative is equipped with a 2-stroke diesel engine with a nominal output of 31 MW at 76 RPM. For the electrical power three 4-stroke generator sets are installed (output 3×2 800 kW). The adopted efficiencies are 0,51 (167 g/kWh) and 0,46 (183 g/kWh).
The differences in efficiency are striking, 0,31 against 0,51 for the prime mover and 0,22 against 0,46 for the electrical power supply.
The fuel consumption is calculated at the highest engine efficiency i. e. the increase in specific fuel oil consumption at partial load is not accounted for.
Capital and Running Costs
Capital Costs
The building cost of the design equipped with a steam turbine are estimated at $160 M.
The building cost of the alternative design, equipped with a diesel engine, are more difficult to predict. By subtracting the costs of the steam turbine propulsion system and adding the costs of the two-stroke diesel engine, generator sets and Birth of the Reliquefaction, Design and Operation of the Reliquefaction LPG Plantreliquefaction plant a first estimate is obtained. The specific costs of the steam turbine propulsion system are estimated at 600 $/kW (estimate based on land-based power plants). For the 29 MW installation the cost amount to $17,3 M.
The specific costs of the two-stroke main engine and the generator sets are estimated at respectively 290 $/kW and 580 $/kW. The corresponding costs are $9,0 M and $5,0 M.
The costs of the onboard reliquefaction plant are related to the capital costs of BP’s Trinidad liquefaction train of 165 $/mtpa. The reliquefaction capacity is based on a nominal boil-off capacity of 0,15 % per day and 100 % redundancy. The total costs are estimated at $11,1 M.
The total buildings costs of the diesel engine alternative are estimated at $167,7 M (+4,8 %).
Running Costs
The running costs include the crew, insurance, docking, special survey and management costs. Usually, the maintenance and lubrication oil costs are incorporated in the running costs as well. In the current analysis it is chosen to put these costs in the voyage costs because they are dependent on the engine load.
The crew costs – to the amount of $4,0 M per year – are based on a crew of 39 persons (24 officers and 15 crew). A first estimate of the insurance, docking, special survey and management costs, to the amount of $1,5 M per year.
Voyage Costs
Scenario Simulations
Previous studies show that key assumptions are made with respect to engine load and vessel speed. The fuel consumption and reliability is heavily dependent on both parameters. The environmental conditions change not only on an hourly basis but also per sea area. For this reason it is expected that assuming a constant engine load and speed will not give a representative estimate of the fuel consumption and reliability.
Simulating a large number of voyages during several years will avoid this difficulty. In these simulations the sustained speed as well as ship motions are calculated on the basis of the actual weather conditions (wind, waves and current). When the ship motions are not tolerable the speed will be reduced and, if possible, the delay occurred will be recovered in a later stage of the voyage.
The primary result is the distribution of fuel consumption and duration of the individual voyages. This approach leads to an improved starting point for the evaluation of both alternatives.
The flow chart per simulated voyage is given in Picture 4.
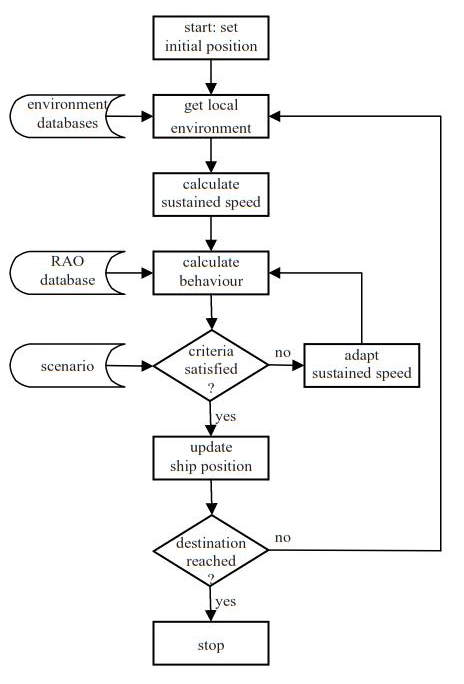
Operational Scenario
Reliability is essential in LNG shipping, for this reason a just in time scenario including voluntary speed reduction is adopted. In this scenario it is always tried to arrive in time. Delays, caused by involuntary speed loss or voluntary speed reduction, are recovered when possible.
Involuntary speed loss denotes the speed loss due to the increased power demand in wind and waves. Voluntary speed reduction denotes speed reduction by the master due to intolerable ship behaviour.
In the simulations the relative velocity at the bow is the only criterion on which is effectively decided to reduce speed. The relative velocity at the bow is a good measure for the probability of keel and bow flare slamming. A threshold value of 9,0 m/s is adopted.
In the simulations not more than 90 % MCR is allowed and the minimum allowable engine load is 30 % MCR. The present scenario simulations do not include the issues listed below.
- Delays due to e. g. terminal congestion or engine failure.
- Engine load dependent specific fuel oil consumption.
- Added resistance due to steering and drift angle.
- Effect of shallow water on resistance and ship motions.
- Effect of seawater and air temperature.
- Fouling of hull and propeller.
Results Simulations
1 050 roundtrips are simulated in a period of 4 years, which equals more than 100 years simulation time. If it is assumed that 4 years weather date is a representative sample of the climate, the simulations provide reliable “lifetime” statistics.
The average wave height on the Qatar to Suez route is 0,7 m with extremes of 2,6 m (this wave height is exceeded in 1 % of the time). The wind speed is around Beaufort 3. The schedule on this route is met at 100 % of the time.
However, the Port Said – US east coast leg show a less favourable climate. The average wave height is around 1 m higher and a wave height of 6 m is exceeded in 1 % of the time. On this route the sustained speed and brake power are highly variable depending on the local weather conditions.
In Picture 5 a time series of the sustained speed is given.
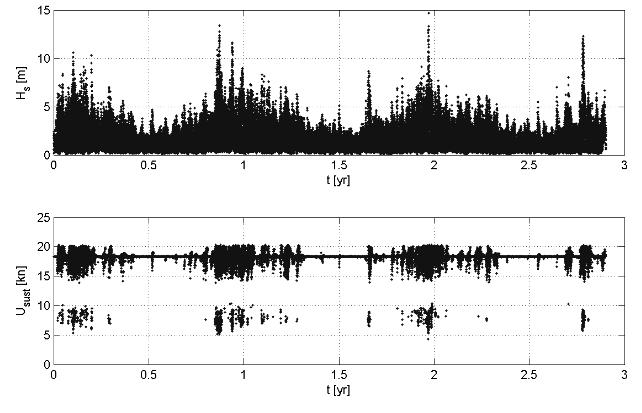
During the summer season (0,5, 1,5 and 2,5 year) the scheduled speed of 18,35 kn is maintained almost continuously. The points just below the 18,35 kn line denote the involuntary speed loss, the points between approximately 5 and 10 denote “voluntary” speed loss and the points above 18,35 kn denote the attempts to meet the schedule.
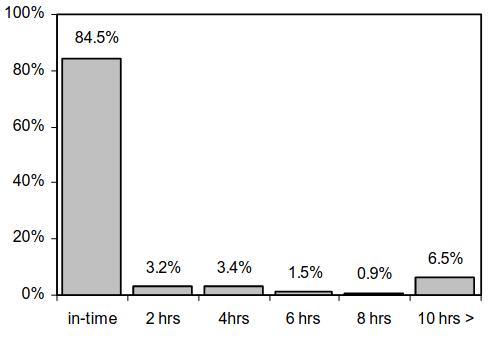
The reliability of the service is high. Nevertheless 15-20 % of the crossings from Port Said to the US east coast show a delay of more than the incorporated spare time of 2 hours (Picture 6). This delay has to be recovered on the return voyage to Suez. In only 1,2 % of the roundtrips it is not possible to meet the schedule of 39 days (i. e. out of the eighty roundtrips one roundtrip last 40 days).
It has to be noted that the differences in reliability between the diesel engine and steam turbine alternative are mainly caused by the higher power available of the diesel engine.
Due to the high reliability, it might be interesting to evaluate a tighter schedule. Saving one day at each side of the Suez Canal seems possible. However, based on the results from Port Said to the US east coast it can be concluded that the decrease in reliability is considerable (Table 3). For this reason the results are not presented in the article.
| Table 3. Reliability in terms of fraction of in-time arrivals at import terminal US east coast | |||
|---|---|---|---|
| Alternative | Total | Summer | Winter |
| Steam, 39 days | 79,7 % | 96,9 % | 60,9 % |
| Steam, 37 days | 48,9 % | 74,1 % | 21,2 % |
| Diesel, 39 days | 84,5 % | 98,0 % | 69,7 % |
| Diesel, 37 days | 67,6 % | 90,3 % | 42,7 % |
Voyage Costs – Steam Turbine
The voyage costs consist of harbour and canal costs, fuel costs and in the present study also of maintenance and lubrication oil costs. The maintenance costs of the steam turbine and boilers are negligible. The harbour dues are estimated at $90 000 per arrival. The transit costs of the Suez Canal are substantial and are based on Suez Canal Net Tonnage of the LNG carrier (about 84 100 SCNT). The transit costs are estimated at $420 000 in loaded and $360 000 in ballast condition.
The electrical power demand:
- Manoeuvring: 5 000 kW;
- Loading: 3 900 kw;
- Discharging: 6 000 kW;
- At sea: 1 500 kW.
The fuel consumption is calculated from the electrical power demand, the required power to the propeller and the amount of boil-off gas.
The transport capacity is calculated on the basis of a cargo tank filling level of 98,5 % of the nominal capacity in loaded condition and 2,0 % in ballast condition. The boil-off is 2 370 tonnes LNG per roundtrip and the transport capacity 64 200 tonnes per roundtrip.
Read also: Rules for Safe Transportation of Cargoes by Sea on the Cargo Ship
Without weather influences the heavy fuel consumption is 1 930 tonnes per roundtrip. When adopting an HFO price of 150 $/ton, the fuel costs amount to $0,29 M per roundtrip.
When the weather conditions are taken into account the above figures are affected.
The number of roundtrips per year is almost equal (from 9,230 to 9,218 roundtrips per year), and the boil-off costs hardly increase.
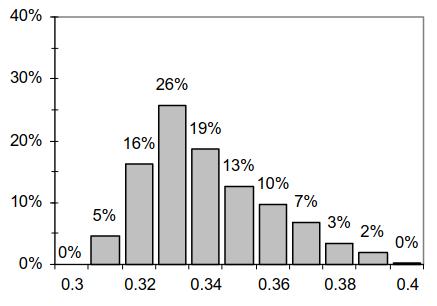
Compared to the fuel consumption without weather influences the fuel costs are increased by 17 % to approximately $0.34 M per roundtrip. Picture 7 shows that the spread in fuel consumption is substantial. The increase in fuel consumption is not only caused by the influence of wind, waves and current but also by the pressure to meet the schedule.
Voyage Costs – Diesel Engine
The harbour and canal costs are equal to the costs as given in paragraph above. The transport capacity, however, is larger because boil-off gas is reliquefied. The annual transport capacity is 607 000 tonnes (against 592 500 tonnes for the steam turbine alternative).
The electrical power demand is equal to the first design alternative apart from the additional power demand of the reliquefaction plant which is estimated at 920 W/kg*h.
Estimates of the maintenance costs and lubrication oil consumption and costs are given in the table below.
| Table 4. Specific diesel engine costs | ||
|---|---|---|
| Main Engine | ||
| System oil | 72 kg/d | 700 $/tonnes |
| Cylinder oil | 1,5 g/kWh | 800 $/tonnes |
| Maintenance costs | 1,0 $/MWh | |
| Generator sets | ||
| Lubrication oil | 1,0 g/kWh | 700 |
| Maintenance costs | 2,5 $/MWh | |
Without the effect of the weather, the lubrication and maintenance costs amount to $45 900 per roundtrip and the fuel costs amount to $0,45 M per roundtrip.
Including the weather effect, the average fuel costs per roundtrip are increased by 6 % to $0,51 M. The average maintenance and lubrication oil costs are $47 200 (+3 %).
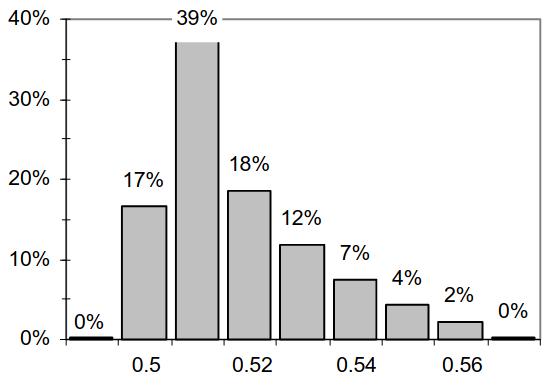
Just as the steam turbine alternative, the spread in fuel costs of the diesel engine alternative is large. Statistically, the fuel costs per roundtrip exceed $0,54 M around one roundtrip per year.
Economical Evaluation
The following financing parameters are used in the evaluation from MPT consult MPT consult, “Summary of gas turbine propulsion, a comparative performance study”, Swedenx and this book Aalbers, A, “Evaluation of ship design alternatives”, 34th WEGEMT School, The Netherlands 2000x:
- Lifetime 20 years;
- A loan percentage of 60 % of the building costs at an interest rate of 6,5 %;
- The building price is paid during the construction in several instalments. The total pre-financing costs are considered to be 3,5 % of the building price;
- The residual value is estimated at 8 % of the building costs.
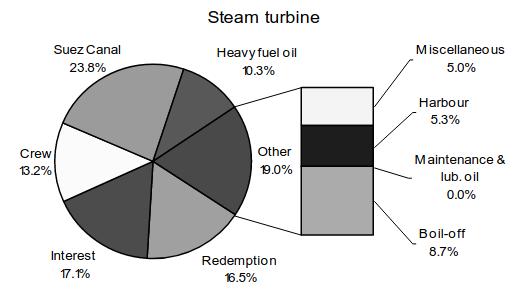
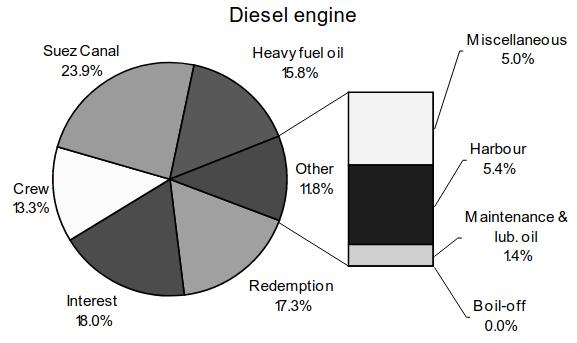
The above figures show the cost distributions for both alternatives and are valid for year five. The insurance, docking, special survey and management costs belong to miscellaneous costs. The capital costs (redemption and interest) take around one third of the total costs. Furthermore, the Suez Canal costs are significant, taking almost 24 % of annual costs.
It could be worthwhile to investigate into possibilities for fuel saving, because the fuel costs contribute substantially to the annual costs (19 % for the steam turbine alternative and almost 16 % for the diesel engine alternative).
The annual transport capacity of the diesel engine alternative is 2,4 % higher than the steam turbine alternative (607 000 respectively 592 500 tonnes per year). The transport capacity is hardly influenced by taking into account the weather influences because it turns out that delays can easily be recovered during a roundtrip.
The shipowner is basically interested in a high profit. Therefore, the required freight rate (RFR) is not the most suitable criterion to judge the design alternatives because the RFR takes only the costs into account.
The internal rate of return (IRR) is more appropriate for this purpose as it stimulates the generation of additional income. The IRR is defined to be the discount rate that makes the net present value of the cash flows equal to zero.
In Table 5 we present the required freight rates and the calculated rate of return, where the IRR is based on an estimated income of 1,35 $/MMBtu. The values between brackets are referring to the results from the scenario without weather influences.
| Table 5. Comparison of RFR and IRR for both alternatives with and without water influence | ||
|---|---|---|
| RFR [$/MMBtu] | IRR [%] | |
| Steam | 0,923 (0,907) | 20,5 % (21,6 %) |
| Diesel | 0,895 (0,886) | 21,7 % (22,3 %) |
What can be concluded from Table 5? The differences between both alternatives seem to be small. However, in the case of weather influences being included, the use of diesel seems to be 3,03 % cheaper than the use of steam. In the case of weather influences not being included that difference is only 2,3 %. Small differences per unit generate huge amounts on a yearly basis.
This can be translated into similar results while looking at the internal rate of return. Taking into account weather influences and using diesel engines will generate an IRR of 21,7 %, being 5,9 % higher than in the case of using steam. In the case of weather influences not included, the difference amounts to 3,2 %.
While interpreting these results we have to stress that the above mentioned results are very sensitive to the LNG/HFO price ratio.
Conclusion
It has always been difficult to incorporate in this kind of scientific work the effect of environmental conditions into an economic evaluation. In most cases power demand was increased with a fixed proportion, or even omitted completely.
With this article we try to show that that scenario simulation could be a valuable methodology. The uncertainty concerning the information about power demand and trip duration due to wind, waves and current, can as such be included in the calculations.
From the simulations presented in this article we can calculate important differences concerning internal rate of return and required freight rates. The reliability is high. Out of the eighty roundtrips, only one roundtrip showed a delay of one day. However the reliability on the Port Said – US northeast coast leg can be a point of concern in the winter season.
The results presented in this article are interesting and invite for additional and even more detailed empirical research. One application could be to alter the schedule, increase the speed and as such also the transport capacity supplied. A consequence of this strategy will be a decrease of the reliability, especially in the winter season. Such an effect could be unfavourable because of the higher gas demand and the corresponding smaller buffer capacity in winter.