Natural gas infrastructure plays a critical role in ensuring the reliable delivery of energy to millions of consumers worldwide. The development of natural gas infrastructure involves the construction of pipelines, storage facilities and processing plants that support the entire supply chain. Modernizing natural gas infrastructure is essential to meet growing demand and enhance safety standards. Investments in natural gas infrastructure can reduce emissions and improve overall energy efficiency. Governments and private companies are focusing on expanding natural gas infrastructure to support cleaner energy transitions.
- Perspectives on Natural Gas
- Key Natural Gas Priorities and Challenges
- Deep Trek – Technology Needed to Dramatically Decrease Cost of Drilling Below 20 000’
- Natural Gas Infrastructure Program
- REGAS LNGC
- LNGC-RV Conclusions
- Alternative Market For LNGC-RV
- Summary for LNGC-RV
- Gas-to-Liquid (GTL)
- GTL Characteristics
- Transportation Costs for GTL
- Compressed Natural Gas (CNG)
- Cran & Stenning’s Coselle
- EnerSea’s VOTRANS
- Knutsen PNG Concept – Pressurized Natural Gas
- Trans Ocean Gas
Innovations in natural gas infrastructure, such as advanced monitoring systems and automation, are transforming how the industry operates. Upgrading natural gas infrastructure helps prevent leaks and minimizes environmental impact. The resilience of natural gas infrastructure is vital during extreme weather events and fluctuating market conditions. Collaboration among stakeholders is necessary to ensure the sustainable growth of natural gas infrastructure. Ultimately, the continued advancement of natural gas infrastructure will drive economic development and energy security worldwide.
Perspectives on Natural Gas
The following text will provide a brief overview of U. S. energy needs over the next twenty years. This overview is based upon a U.S. government publication called National Energy Policy, dated May 2001, produced by Office of Natural Gas & Petroleum Technology.
In the next 20 years:
- Oil demand will increase by 45 percent.
- Electricity demand will increase by 40 percent.
- Natural gas demand will increase by 39 percent.
- Overall energy demand is projected to grow from 98 quads to 136 quads. This represents a grand total of 38 quads, or the equivalent of 6 346 000 000 barrels of oil, of additional supply. (1 quad = 167 000 000 barrels of oil).
Figure 1 shows the expected increase in gas demand over the next 20 years, with the heaviest increases coming from the industrial, and electrical generation sectors.
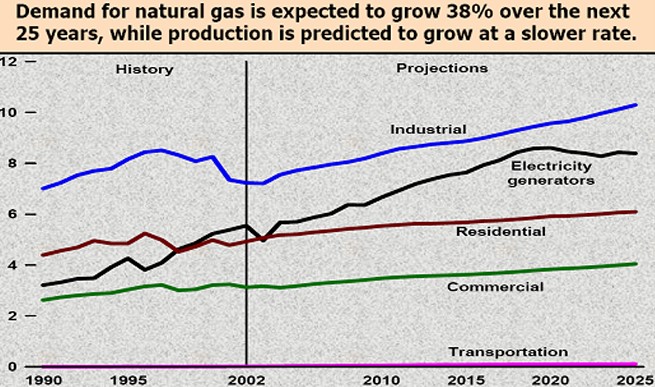
Figure 2 depicts the disparity between domestic gas consumption and the rate of production. The difference must be met with imported gas.
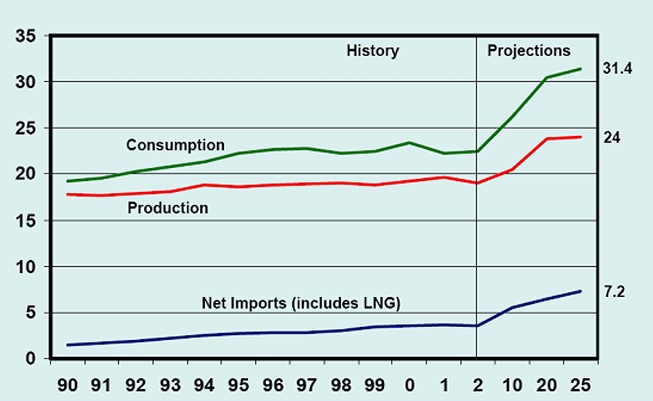
It is predicted that much of the imported gas will come from both Traditional and New Sources; with traditional, in this case, referring to established or approved sources.
Figure 3 shows the breakdown of these sources.
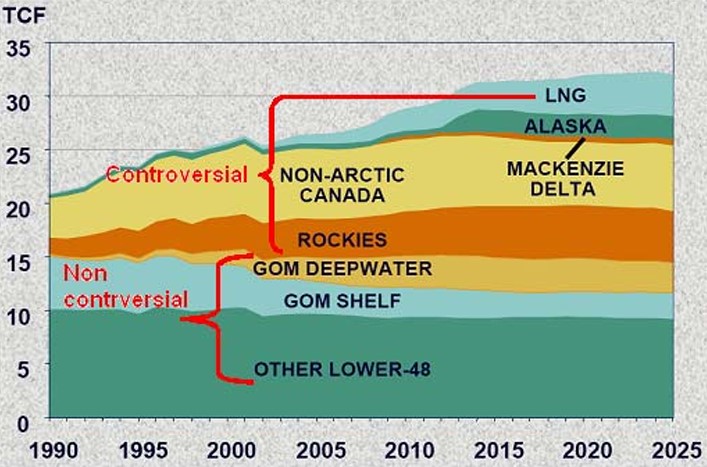
Of particular interest, are the sources shown in the upper half of the chart:
- Rockies.
- Non-artic Canada.
- Mackenzie Delta.
- Alaska.
Given today’s environmental temperament, a good portion of these sources may not be developed in sufficient time to meet the ever-growing demand. This, in turn, will place increasing emphasis on ship borne Environmental management of ships during transportation of LNG/LPG gasestransportation of LNG from more distant sources – hence the current trend to more than double the world’s LNGC fleet over the next fifteen years.
In particular, the Mackenzie Delta, Alaskan North Slope, and the Alaskan Natural Wild Life Refuge (ANWR) are under severe pressure from environmentalists to contain their operations or, with ANWR, to not even explore. Environmentalists also, do not want any additional pipelines across northern Canada.
Figure 4 depicts the U. S. Natural Gas Resource Base.
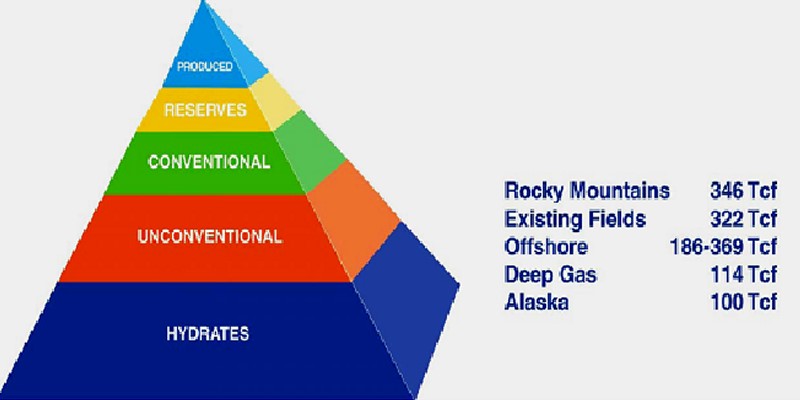
The interesting point is that at least 14 % of future production is based upon expected advances in technology. However, at least as of this date, there has yet to be found a practical way to reclaim the vast amounts of methane hydrates present along our coasts.
Given the rate at which technology develops from the research to the final production stage, one can anticipate a long waiting period before we see any practical or profitable methane hydrate reclamation.
Figure 5 illustrates the dependence on non-conventional wells to meet the bulk of future demand. Whether these non-conventional wells require new technology or special environmental considerations has not been made clear by the source.

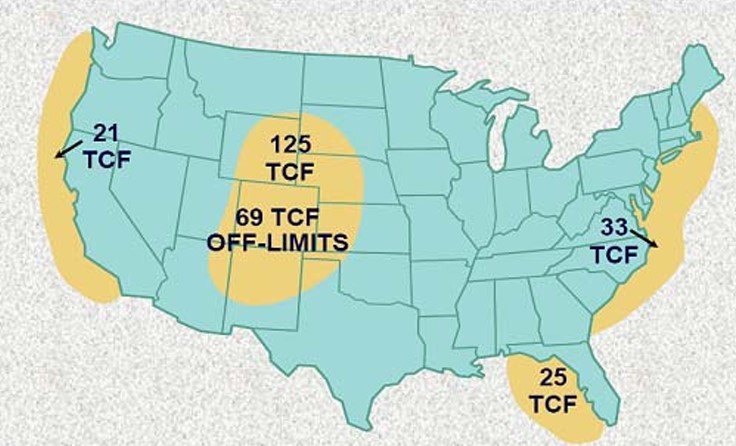
What is clear, as illustrated by Figure 6, is that the U. S. currently has approximately 163 Tcf of gas reserves. Much of the Nation’s oil and gas resource base resides on federal lands and along sensitive coastal zones. A large portion of this is not open to exploration and development.
It is also planned that there will be additional Arctic Pipeline Projects to deliver much needed gas to the lower 48 states.
Given the controversy that was encountered by the Trans-Alaska Pipeline (TAP), we may have to wait a long time before any of this gas is utilized.
Figure 7 illustrates the projected lengths of the proposed pipelines – both of which are longer than the original TAP.
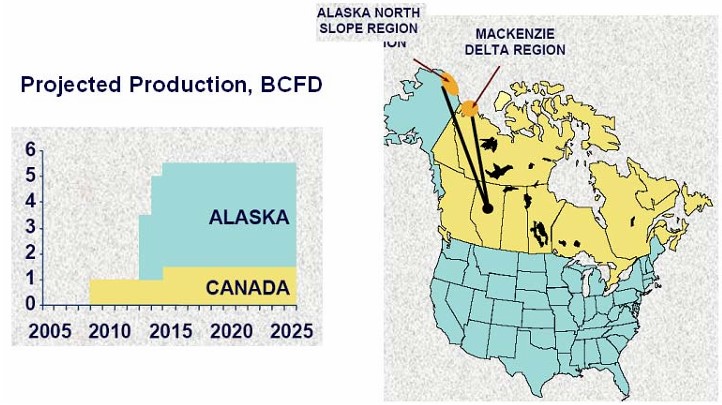
The left portion of figure over indicates that if the pipelines can be built, and if the North Slope and Mackenzie Delta can be developed, then we may realize a production capacity of approximately 5,5 Bcf.
The projected connection point in Edmonton, Canada would tie into existing pipelines and then send the gas to the lower 48. According to the chart, Canada should be producing gas by 2008.
All of the preceding information points out the fact that unless there are some major breakthroughs – both in technology and in environmental restrictions – then the bulk of the U. S.’s gas needs will come via LNGC’s arriving at existing and newly proposed terminals. All of this gas, with the exception of a small portion coming from the Alaska, will come from foreign sources.
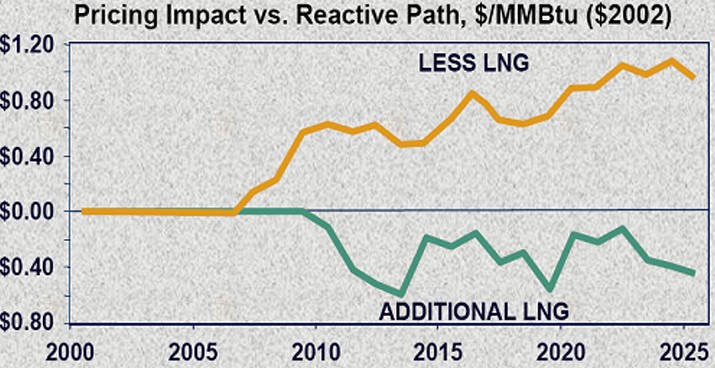
Figure 8 illustrates how increased imports can help lower the price of gas in the U. S. Much of this pricing is simple supply-and-demand. However, other economic factors such as the price of oil, distances shipped, royalties paid, etc. may effect the baseline or threshold price of the gas.
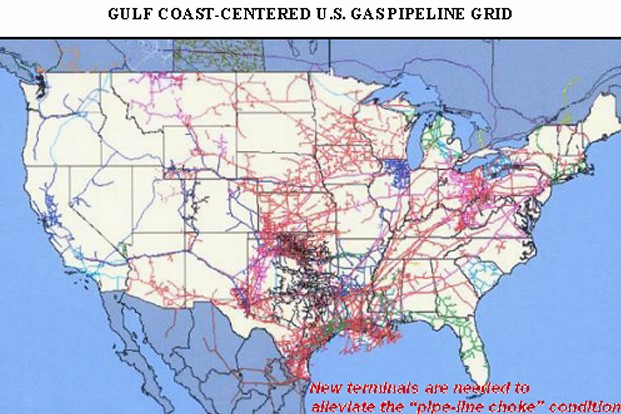
The next figure depicts the U. S. energy/gas problem in another light. The U.S. is “pipeline choked“. In essence, this means the existing pipelines are operating a maximum throughput. Thus, without new pipelines, the much-anticipated gas from northern Canada and Alaska may not reach its intended customers. Figure 9 shows the congestion along the southern coastal regions of the U.S. – all other areas face similar problems. Putting new pipelines requires special environmental approval and local community approval, which may not be forthcoming.
One plan for alleviating the pipeline choked condition is to increase the number of U. S. LNG terminals. Currently, only four exist in Boston, Massachusetts; Cove Point, Maryland; Savannah, Georgia, and Lake Charles, Louisiana. Putting new terminals in at the extremis of existing piping grids will greatly smooth out the flow during peak demand periods.
Figure 10 shows the existing, approved, planned, and proposed terminals for the U. S. coastal zones.
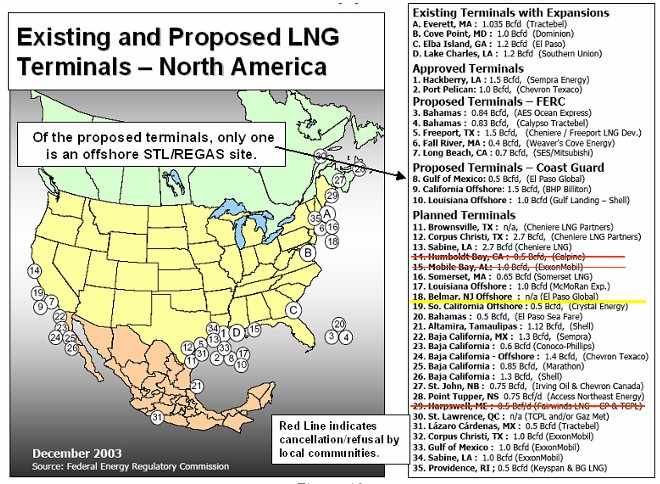
Of note, the red lines through the list indicate terminal that have been turned down by local communities.
Realistically, many of the planned terminals may never get built. The reasons are:
- Environmental and local community opposition.
- Alternative technology such as El Paso/Excelerate Corp.’s Energy Bridge/Regas technology, and offshore terminal(s).
- Alternative technology such as floating, offshore terminals.
- Alternative technology such as salt-dome storage utilizing the “Bishop Process“.
The latter three options represent a significant cost and time savings when compared to building an on-shore multi-tank storage facility. All of these options will be discussed elsewhere in this presentation.
Key Natural Gas Priorities and Challenges
1) Current supply options are:
- Rocky Mountains – environmentalists and local communities are watching this area closely.
- Alaska – there is already an existing trade, which exports LNG to Japan (Phillips Marathon). Further development in northern Alaska has been hampered by opposition both in congress and by environmentalists.
- LNG (imports) – a practical alternative to the Rocky Mountains and Alaska, but increasing imports requires a significant increase in the number of receiving terminals.
2) Technologies for delivering energy to Americans:
- El Paso/Excelerate Corp’s Energy Bridge/Regas technology set for operation by Jan 2005.
- Bishop Process and Salt Dome Storage undergoing field-testing.
3) Future energy supply are:
- Gas hydrates – vast quantities of methane on the ocean floor are equal to more than two times all the known energy supply, but there is currently no means to economically retrieve it.
- Long-range, high-risk research – extra-deep drilling (“Deep Trek” – 20 000 feet and lower) shows promise, but requires special technology.
Deep Trek – Technology Needed to Dramatically Decrease Cost of Drilling Below 20 000’
1) Issue:
Excessive costs to drill deep wells due to low penetration rates, hard rock, high temperatures, and corrosive fluids.
2) Research focus:
Revolutionary technologies to allow breakthrough reductions in deep drilling costs.
3) Expected benefits by 2015:
- Drilling time reduced by 33 %.
- 30 Tcf economically recoverable gas.
Natural Gas Infrastructure Program
Based upon the preceding information, it is anticipated that the following will have to be done to the existing infrastructure, which includes:
- transmission;
- distribution;
- and storage;
in order to meet the growing demand in U. S. energy needs:
1) Infrastructure program goals are:
- Maintain/enhance Pipelines in Marine Terminals: Key Considerations for Handling Liquefied Gaspipeline system reliability and integrity.
- Improve storage well deliverability reservoir management, advanced storage concepts (salt domes), gas measurement and metering.
- Reduce environmental impact (salt domes).
- Enhance interdependencies between gas and electric systems.
- Develop technical foundation for future gas delivery systems and storage facilities.
2) Delivery reliability program areas:
- Inspection technologies.
- Remote sensing.
- Materials development.
- Operational technologies.
3) Storage program areas:
- Advanced storage concepts (Energy Bridge/Regas, salt domes, and floating terminals).
- Storage well deliverability enhancement.
REGAS Technology, for reference:
1) All existing LNG terminals have REGAS technology. This is needed to deliver the gas to the consumer in a usable state.
2) All future LNG terminals will also need REGAS technology for the same reasons as do the existing terminals.
3) The variable in REGAS technology is product flow rate.
4) Pressure will modulate around flow but can range from 200 bar, as in dedicated Bishop Process, or 100 bar, as with LNGC-RV’s (RV – ReVaporization), or something greater, or perhaps even less.
5) LNGC–RV’s, and Floating Terminals can be relocated, so it would seem to be appropriate to have the greatest flow/pressure capability as practicable.
REGAS LNGC
Regasification is the process of turning LNG back into a vapor so that it can be used by customers/consumers. With regard to “REGAS” technology, it is merely the placement of the means to vaporize LNG, at production rates of 10 MMcf/d–690 MMcf/d, on an LNGC.
With regard to LNGC–RV’s and the Bishop Process, the LNG is pumped to a high pressure (100 to 200 bar) and heated past its critical state and then sent ashore as a high-pressure fluid. This high-pressure fluid will not revert back to a liquid even with subsequent pressure drops in the distribution system.
As indicated in Figure 11 shipboard REGAS involves outfitting a conventional LNGC with Suction Pot, HP Discharge Pump(s), HP Vaporizer(s), Dedicated Salt Water Pump(s), a means to connect to consumer pipeline (or salt dome) a Submerged Turret Loading (STL) system or HP discharge line at cargo manifold.
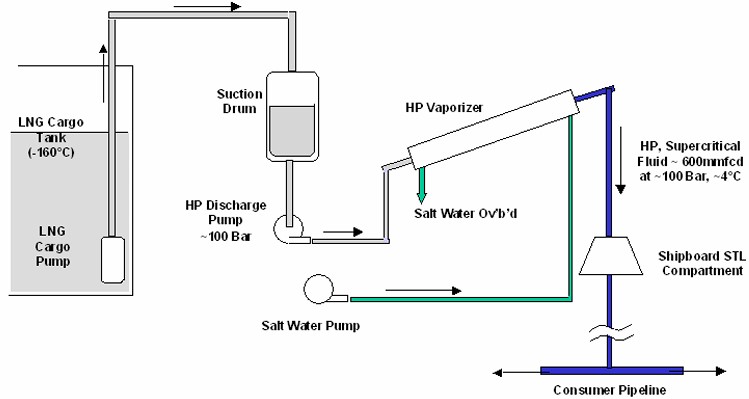
An LNGC–RV can discharge at rates of 10 MMcf/d–690 MMcf/d at a pressure up to 100 bar.
Depending upon customer demand, the rate can go as low as 10 MMcf/d and pressure as low as 40 bar.
LNGC’s with REGAS capabilities can:
1) Discharge as normal LNGC’s at a conventional terminal.
2) Can discharge directly into consumer pipeline(s) either at a terminal with HP send-out line.
3) Can discharge directly into consumer pipeline(s) either at a STL offshore facility.
4) Can discharge directly to proposed salt-dome storage facilities.
Currently, the first LNGC–RV has been delivered in January of 2005. Future contracts contemplate the construction of three more LNGC-RV’s.
The first LNG deep-water discharge port will be in the Gulf of Mexico’s West Cameron Block, approximately 100 miles from the coast of Louisiana.
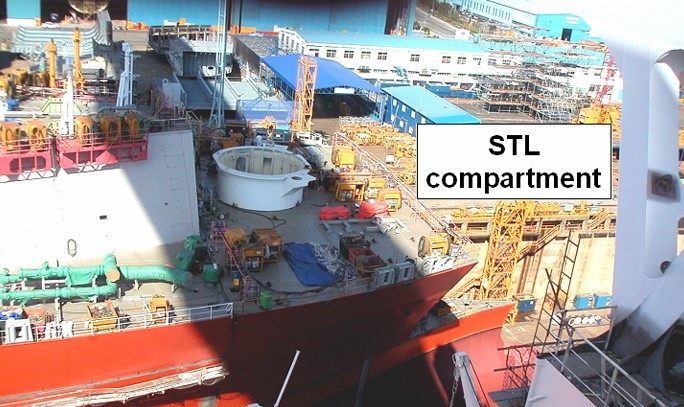
Figure 12 provides a general view of an LNGC–RV, complete with a small moon-pool to accommodate the Submerged Turret Loading System (STL).

Figures 13 and 14 depict an LNGC–RV approaching and connecting to an STL.
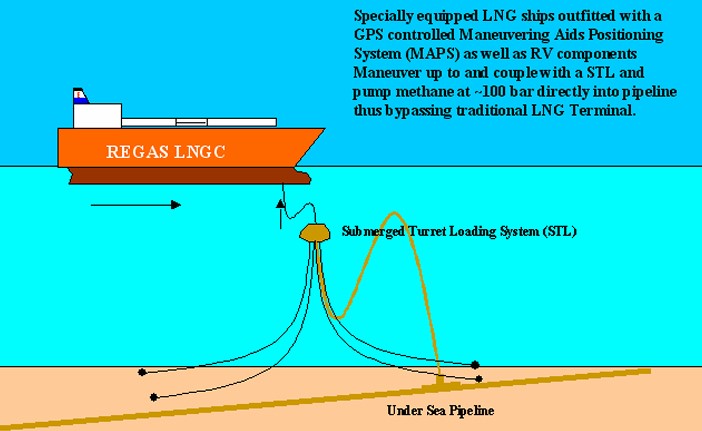
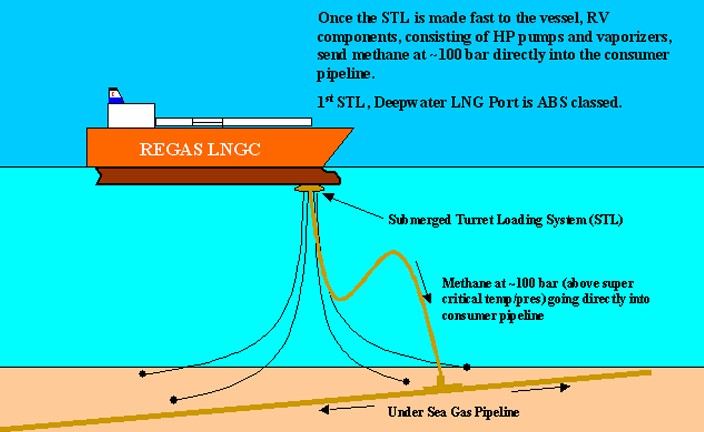
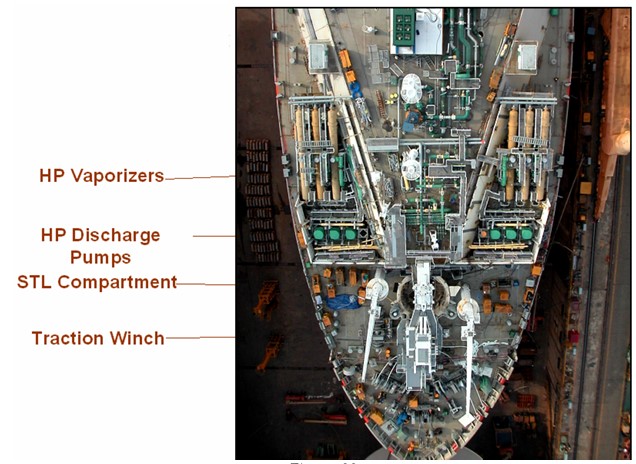
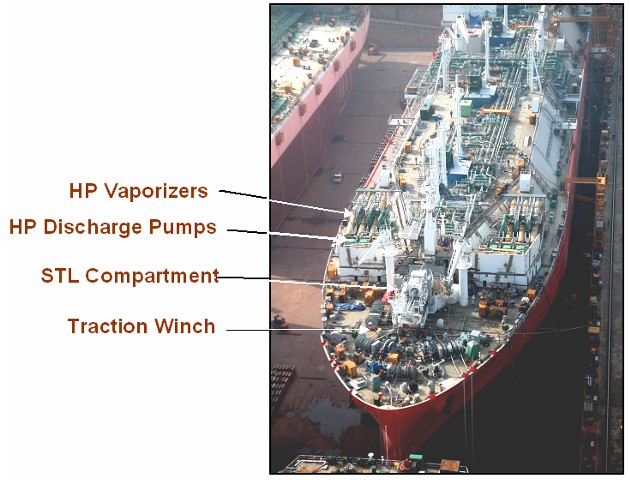
Figure 15 illustrates the layout of components on an LNGC–RV. The HP Pumps and Vaporizes take up the majority of space in an RV system.
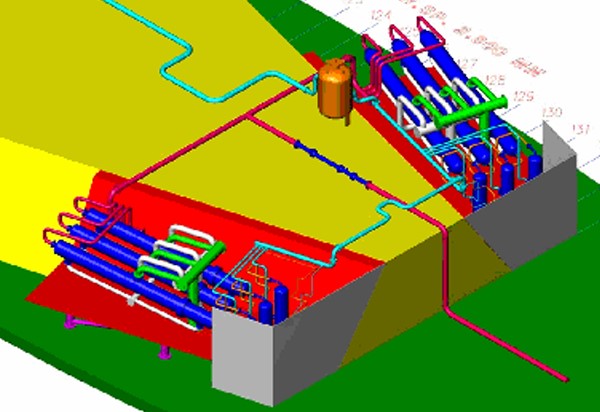
1) LNGC-RV CAPABILITIES
- 6 vaporizers and high-pressure pumps / designed discharge 100 MMcf/d each;
- 5 operational, 1 standby under normal operations.
2) LNGC-RV’S USE PROVEN TECHNOLOGY
- Same basic design as land-based applications.
- Multi-stage submerged centrifugal pumps.
- Enhanced materials for seawater applications.
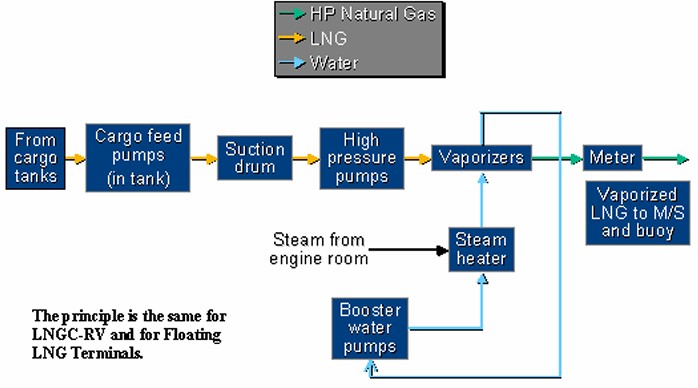
Figure 16 provides a flow diagram for Regasification, which can be applied to almost any LNG application.
The key benefits of having an LNG–RV are:
1) RELIABLE DELIVERY
Provides reliable delivery of natural gas to coastal markets in need of supply.
2) PRICE
Costs are lower than traditional Equipment and cargo system of LNG onshore terminalsonshore terminals and many proposed floating terminals.
3) COASTLINE FRIENDLY
Offloading operations take place offshore, out of sight from land.
4) ENVIRONMENTALLY SENSITIVE
Installations require minimal onshore or offshore foot print for development, presenting minimal environmental impact.
5) SCALABLE
Design allows for natural gas service to small but growing markets.
6) SAFE
Ocean shipping of LNG has a decades-long track record of safety; Energy Bridge vessels will meet or exceed all U. S. and international safety standards.
Figure 17 provides “fish-eye” view of proposed LNG–RV operation.
LNGC-RV Conclusions
- Traditional supply sources will be stressed to meet demand, particularly in North America.
- LNG is ideal solution to the demand/supply imbalance with extremely favorable economics in the global marketplace.
- Energy Bridge/LNGC–RV is an innovative way, using proven technology, to solve U. S. supply deficit while addressing concerns with sitting additional land-based terminals.
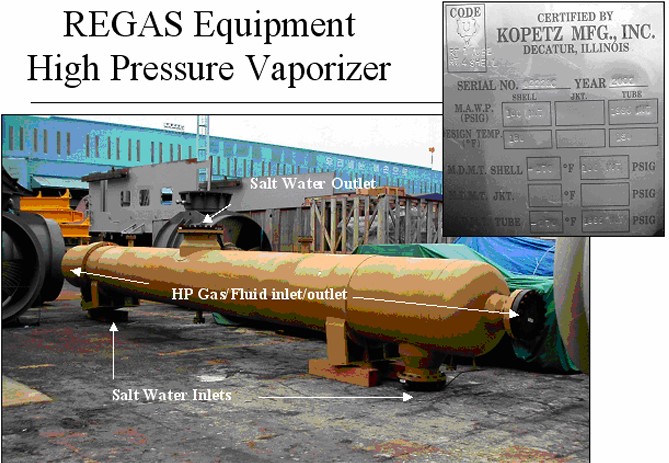
Figure 17 shows a HP vaporizer prior to installation on an LNGC–RV. The length overall is approximately 13 meters.
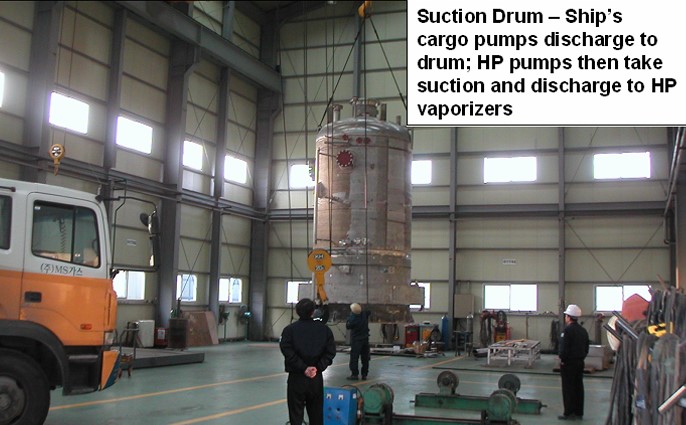
Figures 18 shows the suction drum.
Figures 19 through 22 show various views of 1st LNGC–RV at DSME shipyard.
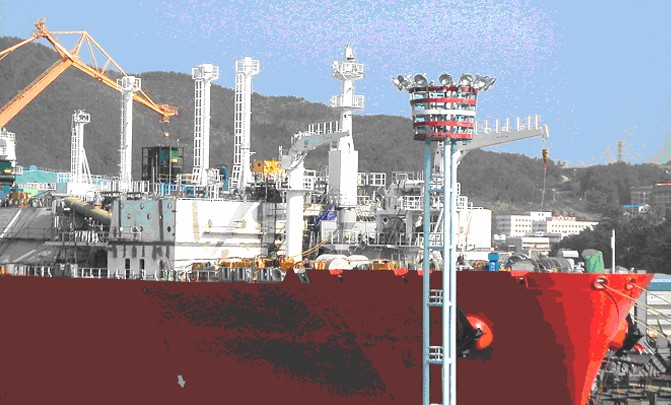
The amount and extent of equipment on board gives one the impression of an FPSO rather than a conventional LNGC.
Alternative Market For LNGC-RV
Currently there is a proposal before the U. S. Department of energy to use underground salt domes for storage of high pressure (200 Bar) LNG. The initial process involves discharging LNG to a specially designed facility with a kilometer length heat exchanger, which uses seawater as the heating medium.
The process has been invented and patented by Conversion Gas Imports, Inc (CGI) and is called the Bishop Process – named after its inventor. By using salt domes, both offshore and onshore, the storage capacity of LNG in the U. S. more than doubles.
Figures 23 and 24 attempt to illustrate the potential uses for and versatility of LNGC–RV vessels.
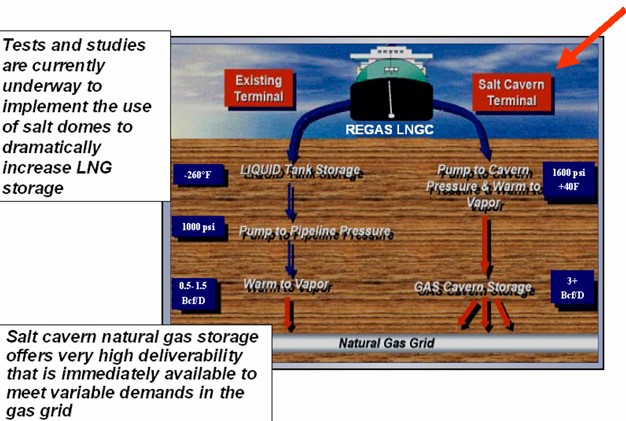
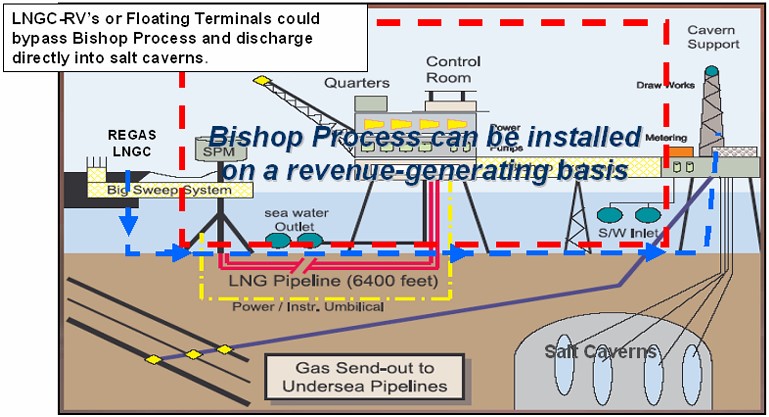
In particular, an LNGC–RV could be used on an interim basis to discharge to a salt cavern while the Bishop heat exchanger is being fabricated an installed.
Table 1 shows a comparison between the cost of storing LNG in conventional shore terminals and in salt cavern terminals.
| Table 1. Off-Loading Gas Ashore Alternatives | ||
|---|---|---|
| CONVENTIONAL TANK STORAGE LNG RECEIVING TERMINALS | SALT CAVERN STORAGE LNG RECEIVING TERMINALS | |
| TERMINAL COSTS (US $ millions) | $ 500 – $ 700 | $ 350 – $ 500 |
| UNIT COST OF SERVICE (US $ /MMBtu) | > $ 0,30 | < $ 0,15 |
| GAS CONSUMED IN PROCESS (% of throughput) | 1,5 % – 3,0 % | 0,35 % |
| DESIGN SEND OUT (Bcf/Day) | 1,5 | 1,5 |
| MAXIMUM SEND-OUT (Bcf/Day) | 1,5 | 3,0 |
Summary for LNGC-RV
With LNGC–RV and Floating Terminals, product flow, and not pressure, is the controlling factor.
Product flow is based upon commercial criteria specified by contract with customer(s).
The principles of Regasification for LNGC–RV and for Floating Terminals are virtually identical.
Class requirements for existing technology and subsequent application thereof are reviewed as existing and should, in most instances, remain unchanged.
Gas-to-Liquid (GTL)
GTL Characteristics
GTL is the conversion of natural gas to synthetic oil, diesel oil or naphtha.
These products are:
- free of wax;
- sulfur;
- aromatics;
- and metals.
Some of its advantages are:
- Another form of “liquefaction” for natural gas.
- Lower capital investment than LNG.
- Permits economic development of stranded gas reserves, associated gas.
- Environmentally friendly: GTL fuels surpass new fuel standards set in U. S., Japan and Europe.
- Economics – Capital expenditure (capex) justifiable with 1-3 Tcf gas reserve and oil price of U. S. $ 15-20/bbl.
Figure 25 provides a simplified flow diagram depicting the process and final products of GTL.
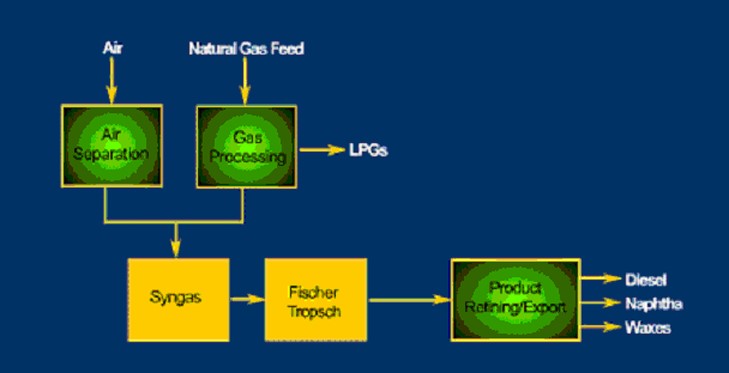
Table 2 illustrates the quality of finished products obtained from GTL technology.
| Table 2. The Quality of Finished Products Obtained from GTL Technology. | |||
|---|---|---|---|
| CRUDE OIL DIESEL | 2006 US DIESEL | GTL DIESEL | |
| Sulfur (PPM) | 500 | 15 | 0 |
| Aromatics (%) | ≈ 30 | ≈ 30 | 0 |
| Cetance index | ≈ 45 | ≈ 45 | > 70 |
Figure 26 provides a cost comparison of GTL against current petroleum refining. Given the current price of oil and the overall outlook that the era of inexpensive oil is gone forever, then GTL becomes an attractive proposition.

Figure above further illustrates the economic benefits of utilizing GTL technology. Note, that this table uses oil at only $17 per barrel.
Transportation Costs for GTL
Once back in gaseous form, the cargo from one (1) 145 000 m3 LNGC is approximately 8,7 x 10⁷ m3. This volume of gas has an equivalent heat value to that of about 300 000 bbl of GTL, which is roughly the size of one (1) panamax tanker.
The cost of a 145 000 m3 LNGC is about 160 million dollars, the cost of a GTL panamax tanker is about 25 million dollars.
LNGC requires more than 30 crew highly trained and well compensated, while a typical panamax tanker does not require specialized, trained crew and operates with a smaller crew of about 20.
Compressed Natural Gas (CNG)
In the early 1990’s, many countries, including the U. S. began experimental and prototype usage of CNG powered vehicles such as busses, taxies, and municipality owned vehicles.
CNG’s advantages are:
- Clean fuel – negligible particulates.
- Less CO2.
- Quieter.
- Will overtake LPG in vehicular use.
CNG Challenges are:
- Refueling stations / infrastructure.
- Cost of CNG vehicles and / or conversion kits for existing vehicles.
- Green vehicle tax rebate.
- Code of practice.
Why CNG?
- CNG versus LNG: simple and inexpensive terminal.
- CNG versus pipelines: mobile, no right-of-way transit.
- 80-85 % project investment is in the ship vs an LNG terminal.
- Low political risk.
- Favorable finance.
- Favorable taxation.
- Low threshold Managing Liquefied Natural Gas Risks in the Marine Industrynatural gas reserve – includes stranded gas, associated gas.
- It becomes economically viable at about 2 000 miles transport distance or less.
Developing concepts for the carriage on CNG are:
- Cran and Stenning Coselle.
- EnerSea VOTRANS.
- Knutsen PNG.
- Trans Ocean Gas.
- Pressurized LNG (PLNG).
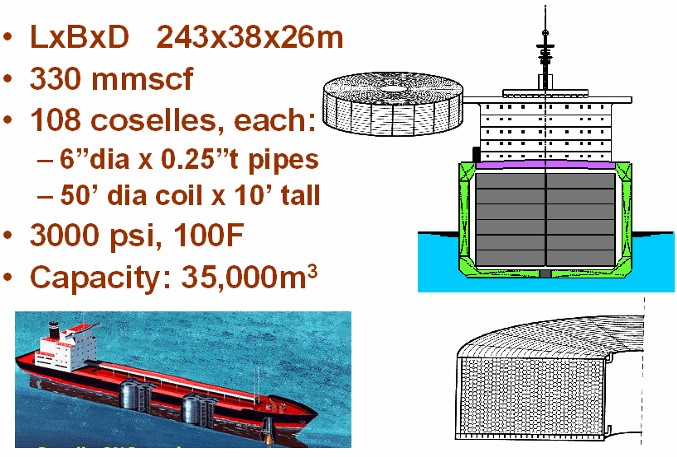
Cran & Stenning’s Coselle
Figure 27 illustrates the Cran & Stenning’s Coselle concept design.
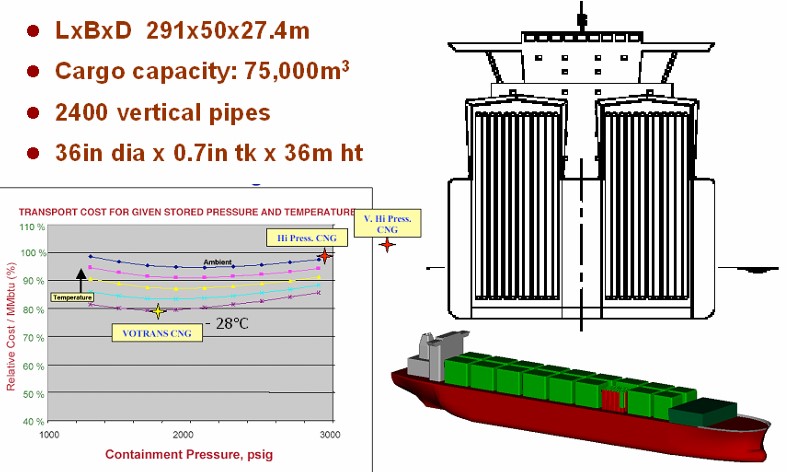
EnerSea’s VOTRANS
Figure 28 illustrates the Enersea’s Votrans concept design.
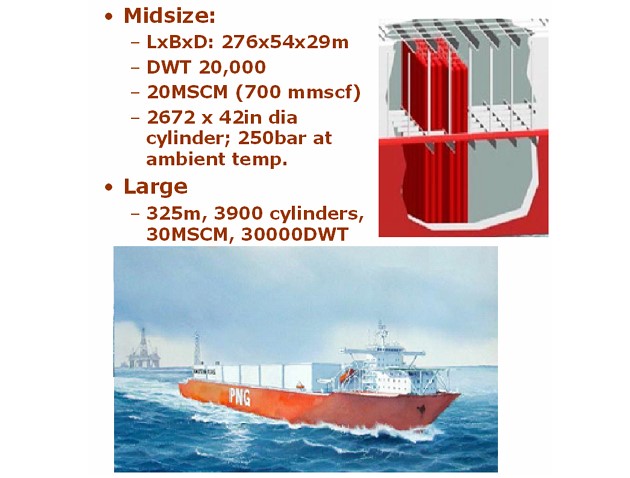
Knutsen PNG Concept – Pressurized Natural Gas
Figure 29 illustrates the Knutsen PNG concept design.
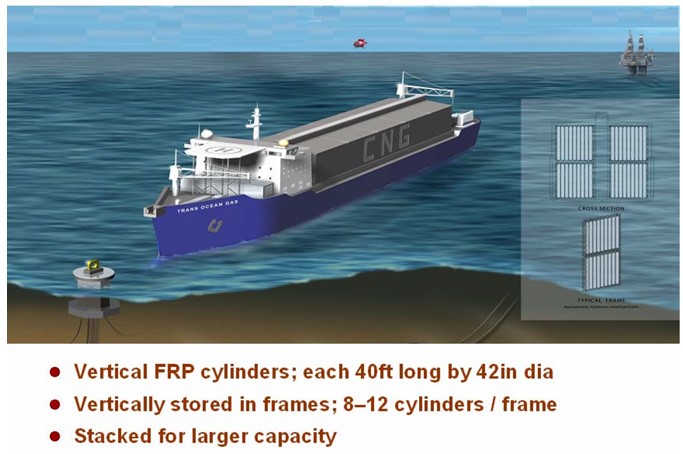
Trans Ocean Gas
Figure 30 illustrates the Trans-Ocean-Gas concept design.

- The Society of International Gas Tanker and Terminal Operators (SIGTTO). Liquefied Gas Handling Principles on Ships and in Terminals (LGHP4) / 4th Edition: 2021.
- The international group of liquefied natural gas importers (GIIGNL). LNG custody transfer handbook / 6th Edition: 2020-2021.
- American Gas Association, Gas Supply Review, 5 (February 1977).
- ©Witherby Publishing Group Ltd. LNG Shipping Knowledge / 3rd Edition: 2008-2020.
- CBS Publishers & Distributors Pvt Ltd. Design of LPG and LNG Jetties with Navigation and Risk Analysis / 4th Edition.
- NATURAL GAS PROCESSING & ITS ENERGY TRANSITION ROLE: LNG, CNG, LPG & NGL Paperback – Large Print, November 14, 2023.
- American Gas Association, Gas Supply Review, 5 (February 1977).
- The Society of International Gas Tanker and Terminal Operators (SIGTTO). Ship/Shore Interface / 1st Edition, 2018.
- Department of Transportation, US Coast Guard, Liquefied Natural Gas, Views and Practices Policy and Safety, p. IV-3.
- Department of Transportation, US Coast Guard, Liquefied Natural Gas, Views and Practices Policy and Safety, p. IV-4.
- Federal Power commission, Trunkline LNG Company et al., Opinion No. 796-A, Docket No s. CP74-138-140 (Washington, D. C.: Federal Power Commission, June 30, 1977).
- Federal Power Commission, Final Environmental Impact Statement Calcasieu LNG Project Trunkline LNG Company Docket No. CP74-138 et al., (Washington, D. C.: Federal Power Commission, September 1976).
- Federal Power Commission, «FPC Judge Approves Importation of Indonesia LNG».
- OCIMF, ICS, SIGTTO & CDI. Ship to Ship Transfer Guide for Petroleum, Chemicals and Liquefied Gases / 1st Edition, 2013.
- Federal Power Commission, «Table of LNG imports and exports for 1976», News Release, June 3, 1977, and Federal Energy Administration, Monthly Energy Review, March 1977.
- Office of Technology Assessment LNG panel meeting, Washington, D. C., June 23, 1977.
- Socio-Economic Systems, Inc., Environmental Impact Report for the Proposed Oxnard LNG Facilities, Safety, Appendix B (Los Angeles, Ca.: Socio-Economic Systems, 1976).
- «LNG Scorecard», Pipeline and Gas Journal 203 (June 1976): 20.
- Dean Hale, «Cold Winter Spurs LNG Activity»: 30.