A numerical and experimental scheme to evaluate the impact strength of containment system in the membrane-type LNG carrier is proposed. The scheme consists of sloshing effect pressure calculation by a fully-nonlinear time domain simulation and a hydro-viscoelastic-fracture analysis of containment system with consideration of fluid-structure interaction during the vibratory motion of the containment system.
- Summary
- Introduction
- Sloshing Impact Load
- Environmental Condition
- Critical Sloshing Domain
- Numerical Simulation
- Model Test
- Composite Scale Law
- Impact Load for Structural Analysis
- Dynamic Structural Response
- Viscoelasticity
- Cohesive Volumetric Finite Element Scheme
- Fluid-Structure Interaction
- Analysis of Wet Drop Test
- Fracture Analysis of Dry Drop Test
- Dynamic Material Property
- Impact Strength Assessment
- Dynamic Strength Test and Failure Mode
- Structural Assessment
- Conclusion
Summary
LNG is modelled as incompressible and inviscid fluid for the sloshing analysis. Fluid-structure interaction between LNG and containment system is considered during the dynamic structural analysis of containment system with the LNG modelled as an acoustic media. The containment system in LNG tank, which is a composite structure of metal membrane, polyurethane foam, plywood laminate insulator and steel hull, is modelled as a two-dimensional composite structure. All of the structural elements are treated as linear elastic material except polymer insulator that shows viscoelastic behaviour at high loading rate, which is the case in the sloshing impact load. The pressure reduction and stress attenuation due to the fluid-structure interaction, material damping and the effect of locality and duration of the impact load on the structure response is investigated.
Introduction
The strength of LNG insulation system can be characterised as the maximum load that the system can sustain before it fails. The load on the insulation system is due to the sloshing motion of liquid in the LNG tank. Since the sloshing load is a short duration impact load, the impact strength tests have been performed to evaluate the strength and failure mode of the insulation system. Then the factor of safety of insulation system is determined as the ratio of the impact strength compared to the sloshing load due to the liquid motion inside the LNG tank.
The sloshing model test and extensive numerical simulation have been performed to identify the critical sloshing load during the lifetime period of the LNG carrier. However, the calculated and measured sloshing load is usually given in terms of impact pressure on a rigid wall that is highly localised in space and time. On the other hand the impact strength is measured from the full scale impact test where the actual non-rigid insulation system is used.
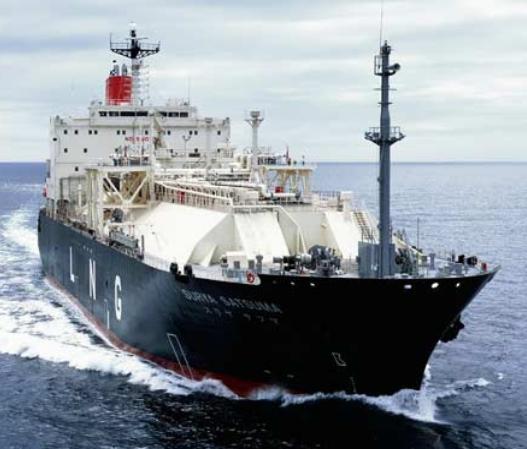
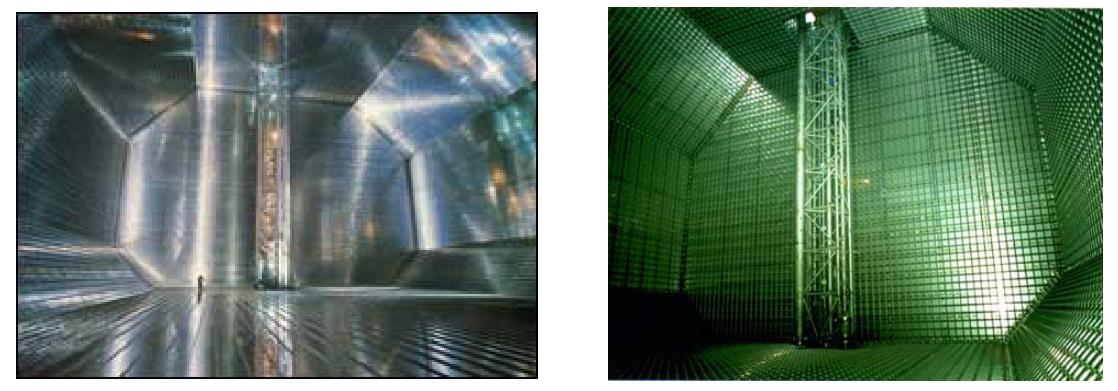
The tank inner skin in the LNG tank is covered by insulation system that consists of the thin metal membranes for the containment of liquid cargo, insulation material to maintain the temperature of the cargo in the cryogenic condition. Besides the steel hull structure, all other structural members are flexible. As a result, more active fluid-structure interaction is expected because the insulation system consists of more flexible materials such as plywood and polymer foams. The failure mode of the insulation system is also quite different from the hull structures.
The impact pressure from the sloshing analysis and model test cannot be directly used for the strength assessment of insulation system without considering the combined effect of the following phenomena:
- Gas trapping and cushioning effect during the impact;
- Compressibility of Liquid;
- Liquid-structure interaction (hydroelasticity);
- Structural damping of the insulation system (viscoelasticity).
A number of impact strength tests have been performed to address the impact strength of the insulation system. None of them was successful to draw the final conclusion on the strength of the insulation system with the full account of the above issues yet. More rational analysis tool and procedure are necessary to assimilate the impact test results to find the correct correlation between the impact load from the sloshing model test and the impact strength of the insulation system from the impact strength test.
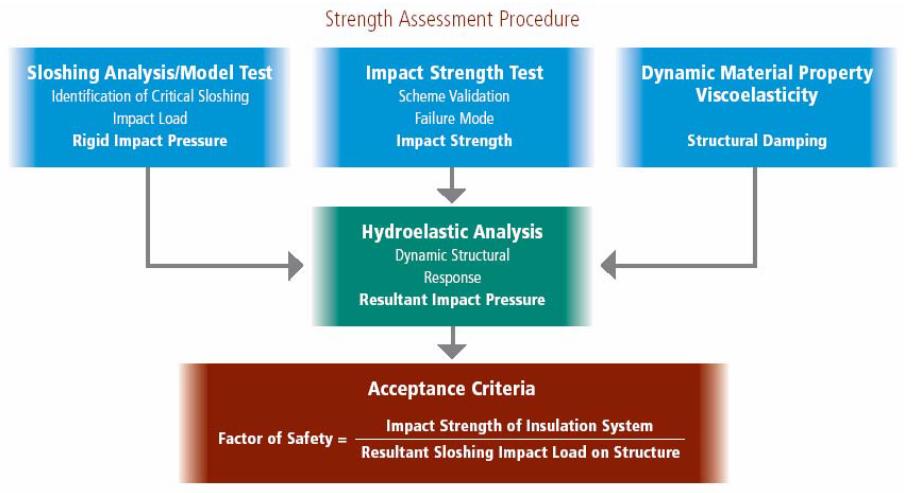
In this article, an analysis procedure for assessing ultimate impact strength of non-rigid insulation system (Mark III and NO 96 systems) due to a sloshing impact load and determining a factor of safety is proposed as shown in Picture 3. The analysis procedure is based on analytical tools for hydro and viscoelastic analyses, which are validated by experimental results. The validated analysis tool will be used for the final assessment of impact strength of the insulation system under sloshing impact load. The analysis procedure consists of the following steps:
- Identification of the spatial and temporal pattern of the impact pressure at the moment of the critical sloshing load on the rigid tank wall;
- Impact test for hydroelastic effect due to fluid-structure interaction;
- Impact test for dynamic response of the structure and failure mode;
- Validation of the hydroelastic and dynamic structural analysis schemes from the comparison with impact tests;
- Evaluation of the resultant sloshing impact load on the insulation system with the full account of fluid-structure interaction and dynamic structural response;
- Final assessment of the impact strength and the factor of safety of the insulation system.
Sloshing Impact Load
Sloshing impact load on the LNG containment system are evaluated by model test and numerical simulation. The motion of the tank for the model test and simulation is determined from the motion of the LNG ship in the designated environmental condition. This section describes the procedure to determine the maximum sloshing load for a given environmental condition.
Environmental Condition
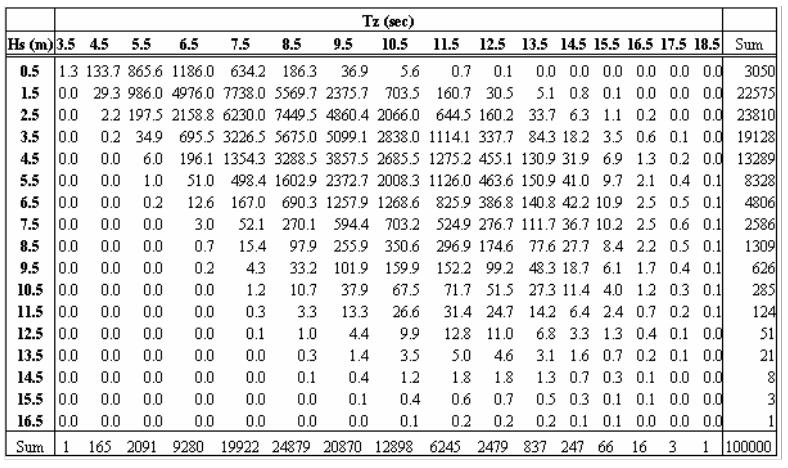
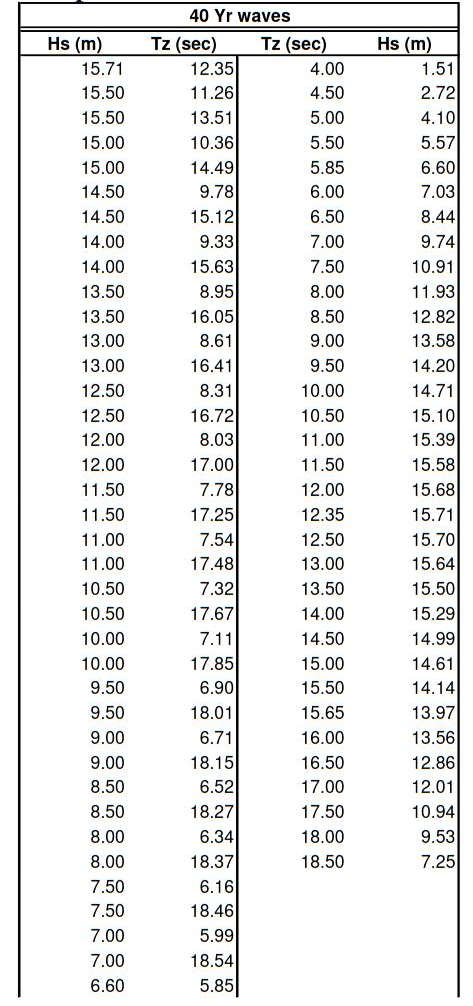
The LNG carriers built for “unrestricted service” are designed to operate in the North Atlantic for 20 years. A wave scatter diagram provided by the IACS Recommendation 34, shown in Table 1, is used to define the wave conditions during the 20 years of service life. The number in each cell gives probability of the sea states for the given zero crossing period, Tz, and significant wave height, Hs. The probability of each sea states are given in terms of number of occurrence among 100 000 occasions, which approximately represent the wave events in the North Atlantic during 20 years.
In the sloshing model test and simulation, each sea states represents storm seas of three hours of duration. The sea surface is represented by an irregular wave system with the wave spectrum given by the Bretschneider spectrum:
where:
- S – wave energy density (m2 sec);
- ω – angular frequency of wave component (rad/sec);
- ωp – peak frequency (= 2π/Tp, rad/sec);
- Tp – peak period (= 1,41 Tz).
Critical Sloshing Domain
Since the sloshing in heavy sea is a highly-nonlinear phenomenon, direct statistical approach to determine the lifetime Coupling Between Liquefied Gas and Vessel’s Motion for Partially Filled Tanks Effect on Seakeepingmaximum value of sloshing load is not practical. Instead, the extreme value of the Dominant Load Parameter (DLP) is searched to determine the wave condition that may give the maximum sloshing load. The longitudinal and transverse acceleration at the center of the tank are used as DLP for sloshing load in this study. For each sea states, combining ship motion RAO and wave spectrum obtain the ship-motion spectrum. The RAO of ship motion is calculated by a three-dimensional panel code. Extreme value analysis is to be performed for the local acceleration at the centre of the LNG tank.
Preference is given to an extreme value method that follows the long-term approach commonly used for ship structural analysis. A group of regular wave conditions are selected to provide the local acceleration at the level of its long-term extreme value. In the beam sea condition, the wave amplitude is reduced to 72 % of the extreme value to consider the actual weathervane manoeuvring and nonlinear effect in heavy seas. The resonance period of sloshing and encountering period of the ship motion is also considered to select the wave conditions. For a given loading condition, 20~40 wave conditions of different period, amplitude and heading are selected. This group of wave conditions is called as the “Critical Sloshing Domain”. Details of the procedure to identify the critical sloshing domain can be found in. The tank motion for sloshing simulation and model test is given by the motion RAO multiplied by the regular design wave amplitudes.
The selection of tank motions described above is based on the regular design wave concept. For the model test and simulation with irregular tank motion, sea states are selected for a prescribed return period. In this study, 40-year waves are used for head sea condition and 1 yr waves are used for the beam sea condition. Table 2 shows the sea states that have 40-year return period.
Numerical Simulation
Once the wave condition and tank motions are selected based on the environmental condition and seakeeping behaviour of the LNG carrier, numerical simulation of the sloshing motion is performed to evaluate the maximum sloshing load. The numerical results from the simulation can also be utilised to narrow down the number of test conditions for model test.
A finite-element code, SLOFE, is used to compute the impact pressure on the rigid tank wall in time domain. The impact pressure is calculated by solving a boundary value problem for the impulsive pressure to capture the impact pressure more accurately.
Pic. 4 shows typical impact pressure distributions at various filling levels. The impact pressure at the high filling condition is highly localised near the tank corner. At low filling level, the pressure is more widely distributed. In both cases, the high impact is localised near the intersection between tank wall and free surface.

Model Test
Model tests are performed to evaluate the maximum sloshing load on a typical LNG carrier of 138 000 m3 capacity at partial filling conditions. The carrier has four LNG tanks. The No. 1 tank at the bow area has smaller size than the other three tanks, which are in similar size. Based on the local motion response at each tank centre, No. 2 tank is selected for the model test. For each selected sea states, the tank is excited for 5 hours in full-scale time.
Model test is performed by MARINTEK test rig in Picture 5.
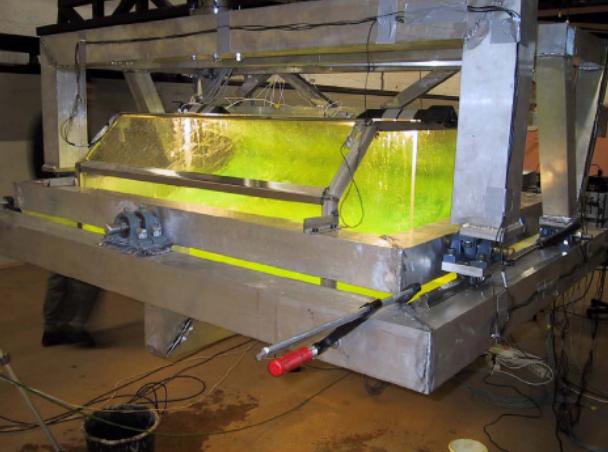
The tank model is made of plexi glass in scale 1:50 of the tank no. 2 in the 138k LNG carrier. A total of 206 holes are made in the tank walls and ceiling in order to fit pressure cells. The plexi glass is 20 mm thick and additional steel stiffeners are added along the corners of the tank. The natural frequencies of the tank walls were investigated by use of an accelerometer mounted on the walls. A rubber hammer was used to excite free oscillations of the walls, and a power spectrum analysis of the measured acceleration normal to the wall was used to identify eigen-frequencies. The tank was filled with water during these tests. The measured oscillation frequencies are of the order of 1 000 Hz. The highest pressure peaks have durations below and up to 1 ms, but the pressure is extremely localised in space and acts very close to the corners of the tank.
The response amplitude operators for the ship motions are combined with the wave spectrum in order to generate tank motion response spectra. A fast-Fourier algorithm is then used to generate irregular time histories from the response spectra. The number of regular wave components used to generate the random motion signal is set from the time step and duration of the time series, so that the sequence does not repeat. Typically, around 100 000 components are used. A two parameter ISSC (Bretschneider) wave spectrum is used. The total full-scale time is 18 000 seconds (five hours). A ramp of 100 seconds is used to avoid excessive accelerations and transients during start-up.
Read also: Basic Ship Motions and Mathematical Model used in Vessel Simulator (VeSim) Tool
Pressure sensors of type Kulite are installed around to the most exposed locations on the tank wall for each test. These sensors have a pressure sensitive area of 2×2 mm. In addition 4 accelerometers are used in order to get accurate tank motion data. These are aligned along the x- and y-axes and two vertical axes. A special pitch- measuring device was also included as well as measurements of the velocity feedback from the rig steering system for the x-, y- and one vertical axis. The data are filtered by a 100 kHz analogue Bessel filter in the amplifier. Final data output resolution is 19,2 kHz. 29 channels are used for data logging, where one channel is reserved for time record, i. e. 28 channels are used sampling data.
The instrument amplifier of type Hottinger Balwin performs only signal amplification and a filtering by use of an internal analogue Bessel filter with filter frequency 100 kHz. The filter frequency is set to be higher than relevant structural eigen-frequencies.

The sloshing pressures are counted by applying a “count-peaks over threshold” method using a moving time window. Only the largest peak within the window is counted as a pressure peak. Any other peak within the time window is assumed caused by secondary oscillations and discarded. The size of the time window is set as a parameter in the analysis. The threshold value for the sloshing pressure must be imposed to avoid small pressure peaks due to noise in the measuring system. At the same time, the threshold value should not be set too high so that the resulting statistics are altered. The extreme sloshing pressure peaks will have very short time duration.
The statistics of the pressure peaks measured during the 5 hours (in full scale) of model test are used to estimate the extreme value of the impact pressure during 3 hours for each filling levels. Pic. 6 shows the estimated maximum impact pressure at each filling levels. The pressure values are given in full-scale value following the Euler scale, where pressure magnitude is proportional to the length of the tank and density of liquid cargo. In this scale law, the impacts are assumed to be hydrodynamic impact and no effects from compressibility of liquid and air are considered. During the model test, large amount of air bubble has been observed whenever the liquid hit the tank corners where the pressure maximum occurs. This indicates that the Euler scale may not be appropriate to evaluate the impact pressure in the full-scale LNG tank. In the scale law for compressible fluid, pressure is proportional to the square root of the tank length. As a result, the pressure value given in Pic. 6 may be overly conservative to be used for the structural assessment of the containment system.
Composite Scale Law
The validity of the existing two scale laws are investigated by inspecting the time history of the impact pressure signal measured during the model tests. It has been found that both the incompressible (hydrodynamic) and compressible (cushioned) impacts occur randomly during the sloshing simulation. If the only incompressible scale law were applied, the estimated full-scale pressure would be overly conservative. On the other hand, if the compressible scale law is used, one may end up non-conservative conclusion on the safety of the containment system.
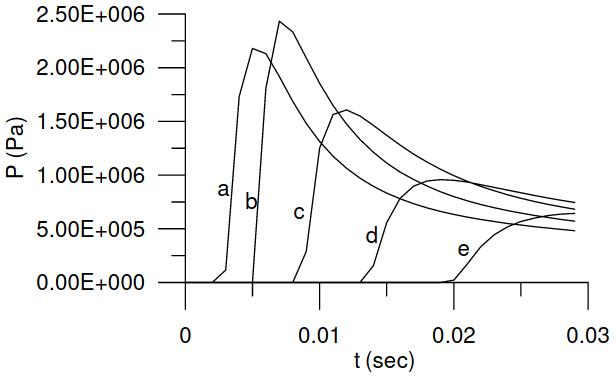
To remedy this drawback of the existing scale laws, a new composite scale law has been proposed. In the composite scale law, time history of each pressure peaks are reviewed and treated separately. Pic. 7 shows typical three different patterns of pressure time history near the peak. The pressure history in Pic. 7 (a) shows short rise time and longer decay time, which is a typical signature of incompressible hydrodynamic impact. Pic. 7 (b) shows symmetric impact pressure pattern that fits to the compressible impact cushioned by entrapped air at the tank corner. The pressure pattern in Pic. 7 (c) shows longer rise time and short decay time, which seems to be due to escape of entrapped air during the compression.
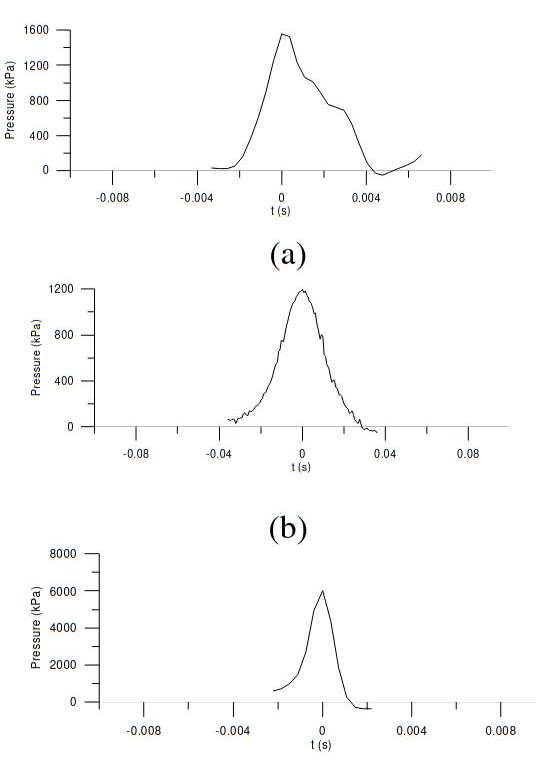
In the new composite scale law, only the peak values with incompressible impact pattern are scaled up following the incompressible (Euler) law. Compressible law is applied to the other two impact patterns. As a criterion for the incompressible impact, the decay time should be at least three times longer than the rise time. After applying two different scale laws to each recorded peaks, the 3-hour extreme value of the sloshing pressure is re-evaluated from the new full-scale peak values. In Pic. 8, the new full-scale values are shown together with the numerical simulation results.
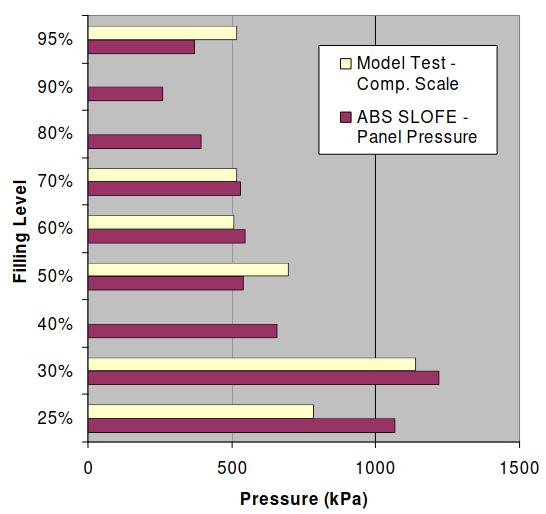
For numerical simulation, averaged panel pressure over 2 m panel has been used. The trend and order of magnitude agrees well each other. Numerical results underestimates the impact pressure at 95 % filling level, which is due to the three dimensional effect at the tank corner that could not be captured in the present two dimensional simulation. An empirical factor of 1,5 is introduced to consider the three-dimensional effect, which will make the simulation result slightly higher than the experimental value. To consider the three-dimensional effect more precisely, three-dimensional sloshing simulation tool is also being developed.
Impact Load for Structural Analysis
To analyse the dynamic structural response of containment system, time history and distribution of the pressure over the tank surface is necessary. Due to the physical limitations of the model test, it is not easy to measure the pressure distribution with satisfactory resolution for structural input. On the other hand, the numerical solution can provide the pressure time history at any location on the containment system. But one should be careful before applying the calculated pressure distribution to the structural analysis because at certain filling levels, the numerical solution may not provide appropriate pressure for structural analysis.
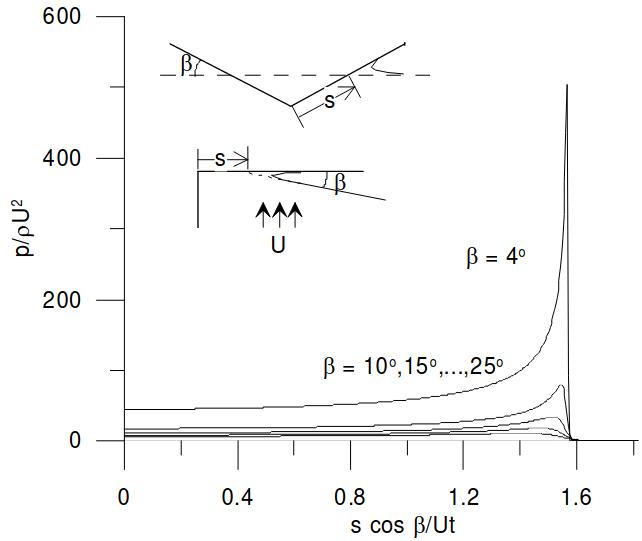
Due to the highly-localised profile and short duration, accurate calculation of the impact pressure at high filling condition requires very fine mesh and time step. For this reason, the pressure distribution and time history at the high filling conditions are replaced by the theoretical solution. Specifically, the similarity solution for slamming problem of a wedge is used. The impact pressure is given in terms of the incident velocity, U, angle, β, and distance from the contact point, is:
Pic. 9 shows the pressure profile given by the similarity solution at various incident angle, β.
At low filling level, the most significant impact pressure occurred at the filling level around 30% of the tank height. Pic. 10 shows a typical time history of pressure calculated by SLOFE at various locations on the tank wall at 30 % H filling condition.
Due to the longer duration and impact area, the impact pressure at low filling does not induce significant effect of hydroelasticity. Dynamic structural analysis results for the high-filling conditions will be presented in this article.
Dynamic Structural Response
The strength assessment of the insulation system due to the impact pressure from the sloshing analysis and model test should be performed considering the following aspects of the problem:
- Fluid-structure interaction;
- Dynamic structural response;
- Dynamic material property;
- Failure mode of the insulation system.
A number of impact strength tests have been performed in the past to address the impact strength of the LNG insulation system. None of them successfully led to a final conclusion on the strength of the insulation system while taking full account of the above four issues. More rational analysis tools and procedures are necessary to assimilate the impact test results to find the correct correlation between the impact load from the sloshing model test and the impact strength of the insulation system from the impact strength test.
For this purpose, ABS proposed an analysis procedure for assessing ultimate impact strength of a non-rigid insulation system (Mark III and NO 96 systems) due to a sloshing impact load and determining a factor of safety. The analysis procedure is based on analytical tools for sloshing impact estimation and hydroelastic and viscoelastic analysis, which will be validated by experimental results – such as wet and dry drop test conducted by manufacturer. The validated analytical tools will be used for the final assessment of impact strength of the insulation system under sloshing impact load.
At each time step:
Update nodal velocities:
Update nodal displacements:
- Loop over all volumetric elements and compute new internal force vector:
- compute element strain εn+1 based on Un+1.
get element strain rate
get element stress rate
update element stress
- compute local internal force vector and assemble into global internal force vector (Rin)n+1.
- Compute external force vector associated with applied pressure loading (Rext)n+1.
- Compute new nodal accelerations An+1 = M-1(Rext-Rin)n+1.
Viscoelasticity
The viscoelastic constitutive model adopted in this study is the so-called Standard Linear Solid (SLS), which, in the simpler 1-D case, takes the form:
where:
- σ(t) and ε(t) denote the time-dependent stress and strain, respectively, and;
- E(t) is the time-dependent relaxation modulus.
For the SLS model, the time-dependent modulus is expressed as:
where:
- E(o) and E∞ respectively correspond to the instantaneous and long-term values of the modulus and;
- τ is the material relaxation time constant.
The differential form of the constitutive relations (3) and (4) is:
The differential form is used in the incorporation of the SLS viscoelastic model in the explicit finite element code, as summarised in Box 1, which presents the explicit time stepping scheme used for the SLS viscoelastic finite element. In Box 1, ∆t denotes the time step size, Rin internal force vector, Rex external force vector, and M the global (lumped) mass matrix.
Cohesive Volumetric Finite Element Scheme
The solid solver relies on an explicit form of the CVFE scheme to simulate the spontaneous initiation, propagation, and possible arrest of the crack. The CVFE scheme includes both conventional (volumetric) elements, used to capture the bulk response of the structure, and interfacial (cohesive) elements placed along the boundaries of the volumetric elements in order to model the cohesive failure process. The cohesive failure model used in this preliminary study is the bi-linear rate- independent but damage-dependent relation between normal (Tn) and tangential (Tt) cohesive tractions and the corresponding normal (∆n) and tangential (∆t) displacement jump (or crack opening and sliding displacements):
where:
- σmax and τmax respectively denote the normal and tangential strength of the interface;
- Δnc and Δtc are the critical values of the normal and tangential crack opening displacements (i. e., the values of the displacement jumps beyond which complete failure is achieved), and;
- S denotes the damage parameter characterising the progressive failure of the interface and defined as:
with (a) = a if a<0 and = 0 otherwise.
Fluid-Structure Interaction
We modelled the liquid as a homogeneous elastic medium by the use of finite elements as in the solid. In case of LNG, its density is 474 kg/m3 and the dilatational wave speed, Cd, is known to be 1 700 m/s. Shear wave speed, Cs, is assumed to be reasonably small compared to dilatational wave speed. Then, Young’s modulus, E, and Poisson’s ratio, ν, can be determined by the dilatational wave speed, shear wave speed and Lame’s constants:
Along the liquid-slid interface, the following conditions are enforced:
To satisfy those conditions, CVFE elements with very small shear strength compared to normal strength are placed along the interface boundary.
Analysis of Wet Drop Test
A wet drop tests have been performed to find the cushioning and hydroelastic effect during the liquid-solid impact. Full-scale insulation panel is dropped on the water or liquid nitrogen at various incident angles, which is defined by the angle between the calm liquid surface and solid surface. The main purpose of the wet drop test is to find the reduction factor of the impact pressure on the containment system compared to the impact pressure on the rigid and flat surface.
We applied the present numerical scheme to simulate the wet drop test. The impact pressure on the rigid tank wall is treated as a known forcing pressure determined from the drop height and incident angle and fluid-structure interaction due to the vibratory motion of the insulation system is considered by modelling the liquid methane as a two dimensional acoustic media. The insulation system, which is a composite structure of plywood, RPUF and mastics, is modelled as a two-dimensional composite structure. All of the structural elements are treated as linear elastic material except the RPUF. Picture 11 illustrates model problem, finite element meshes and time histories of travelling load at several locations on the surface of the insulation system.
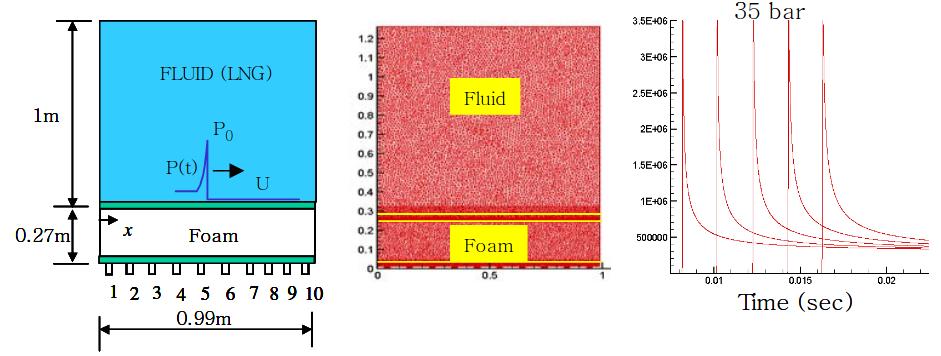
Note that the load profile in Picture 11 is for incidence angle 4 degree with drop speed of 5,4 m/s. The peak pressure is 35 bar and duration increases as pressure profile travels over the insulation surface adjacent to fluid. RPUF is assumed to have a viscoelastic constitutive response with Eo = 133 MPa, E∞ = 13,3 MPa and τ = 3,2 ms. In the absence of actual values obtained from experiments, these values have been chosen to represent the rate-dependent nature of the instantaneous modulus of the RPUF and the material-induced dissipation. The other structural components are assumed to behave as linearly elastic solids (see Table 3). E, ν and r respectively denote the elastic stiffness, Poisson’s ratio and density of the materials. Cd is the dilatational wave speed.
Along the liquid-solid interface, the conditions in Along the liquid-structure interface, Eqs. (11)-(13) are enforced. In case of LNG, the sound speed is known to be 1 700 m/s and the shear wave speed is assumed to be one fifth of the dilatational wave speed (340 m/s). Young’s modulus and Poisson’s ratio are taken to be 162 MPa and 0,4792, respectively.
A Snapshot of the σyy stress distribution in both fluid and solid domains is shown in Picture 12, illustrating the propagation of the elastodynamic wave and the appearance of the stress concentration in the vicinity of the mastic components in solid domain, as well as acoustic wave emission and pressure change due to structural motion in fluid domain.

Note the appearance of a tensile component in the fluid domain, which is caused by the structural motion of the insulation surface. This can be regarded as a pressure reduction due to fluid-structure interaction. Picture 13 a shows a change in pressure acting on the flexible insulation surface from rigid wall pressure.

Dotted line corresponds to the rigid wall pressure and solid line to the actual pressure that solid “feels” on the surface through interaction between structural motion of interface and fluid inertia force. Not only the magnitude but also the duration of the impact load is reduced due to the fluid-structure interaction.
| Table 3. Elastostatic properties of the materials used in the analysis | ||||
|---|---|---|---|---|
| Material | E (Pa) | ν | ρ (kg/m3) | Cd (m/s) |
| plywood | 7,50E+0,9 | 0,17 | 710 | 3 369,6 |
| mastic | 2,88E+09 | 0,3 | 1 500 | 1 607,7 |
| LNG | 1,62E+08 | 0,479167 | 474 | 1 700 |
To illustrate the effect of energy dissipation due to material damping through visco-elastic model in this analysis, Picture 13 b presents the evolution of the σyy stress component at three points located at midplane of fluid-structure interface (d = 0, 8,3 mm, 16,3 mm distant from the surface in the downward direction). The viscoelastic model tends to attenuate the stress waves substantially, as in Pic. 13 (b).
To demonstrate viscoelastic effect in comparison with linear elastic case, we present in Picture 14 the evolution of the reaction force computed along three mastic components, thereby illustrating the transfer of the load from the fluid/structure interface to the hull (assumed rigid in this preliminary analysis).
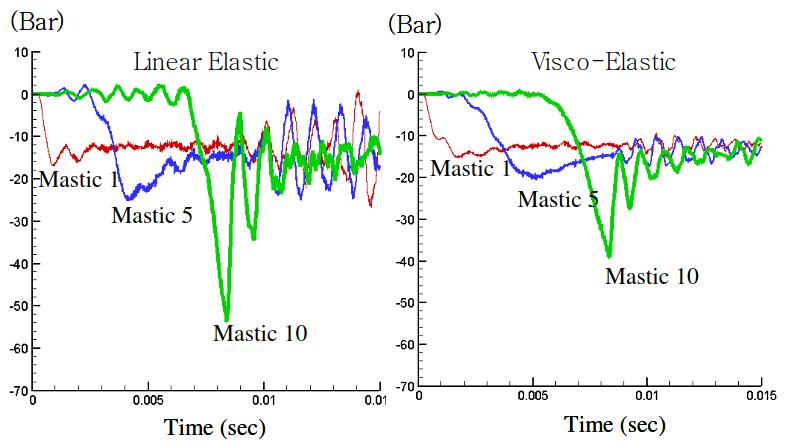
As apparent there, the viscoelastic model dissipates the oscillatory stress components quickly and transmits less load to the hull than the linear elastic model. The dissipation of impact load is due to the viscous damping in the viscoelastic model. The viscous damping is more effective to the impact load with thinner profile, which has more higher-harmonic spectral contents than the thicker profile.
Numerical computation with the load profile different from Picture 11 have been conducted to find the effect of duration and locality of the traveling load to the dynamic response of the insulation system. Our findings are:
- Impact load with shorter duration and thinner profile results in more pressure reduction due to fluid- structure interaction.
- Impact load with shorter duration and thinner profile results in more load attenuation as it propagates to the hull side.
The strength of LNG containment systems to the impact load has usually been defined with the uniform load profile on the containment system surface. Our findings in this study indicate that the impact strength based on such approach can be overly conservative if impact load due to sloshing is highly localised, which is the case when LNG carrier operates at high filling conditions.
Fracture Analysis of Dry Drop Test
Various types of dry drop test have been performed to measure the impact strength on the insulation system. One of the most common tests is to drop the insulation system to the elastic ground. The top of the insulation system is loaded with mass. During the impact with the ground, the mass on the top of the insulation system provides inertial load, which simulates the sloshing impact load. Changing drop height and weight of loaded mass controls the magnitude and duration of the impact load. The insulation system is inspected after each drop test to find the structural damage. It has been found that small crack is initiated at the lower plywood/RPUF interface right above the mastic area, where the stress concentration and sharp material property changes occur.
In this section, we present the results of a dynamic fracture analysis of the dry drop tests on an insulation system model. Picture 15 presents the problem description, boundary conditions and the spatial discretisation used in this study. A steel load is placed on top of the insulation system. In addition to roller boundary conditions along the left and right edges (used to represent the constraint associated with the surrounding medium), fixed displacement boundary conditions are applied along the bottom edge of the mastic components.
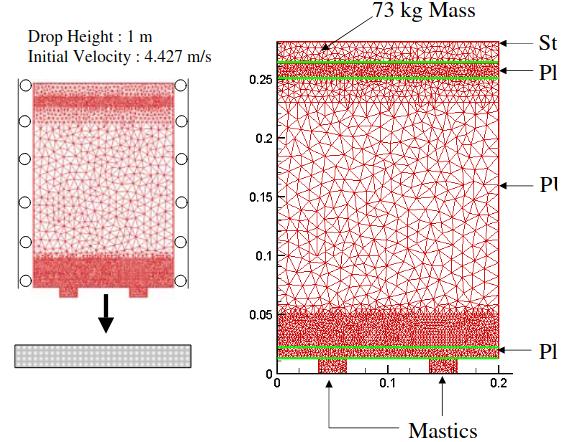
Since experimental observations in some drop tests have indicated that failure tends to take place in the vicinity of the lower plywood/RPUF interface, cohesive elements are placed along that interface. The other interfaces are assumed to be perfect (i. e., continuity of displacements and tractions). The elastic properties of the components are assumed to be the same as those used in the previous section. For steel, the elastic response is characterised by:
- E = 211 GPa;
- ν = 0,3;
- ρ = 7 800 kg/m3.
For the RPUF, both elastic (E0 = E∞ = 133 MPa) and viscoelastic (E0 = 133 MPa, E∞ = 0,1 E0, and 3,2 ms τ = 3,2 ms) are used. The boundary conditions are schematically presented in Picture 15. Along the bottom boundary (lower edge of mastic components), fixed displacements are assumed for time t > 0. To simulate the drop test, an initial vertical velocity of 4,427 m/s (corresponding to a drop height of 1 m) is used as initial condition for all nodes.
In the absence of experimentally measured failure properties of the plywood/RPUF interface, the following failure properties were adopted:
The corresponding value of the cohesive zone size is approximately 10 mm, about five time larger than the size of the cohesive elements placed along the plywood/RPUF interface. The cohesive element discretisation are therefore be sufficient to achieve convergence of the dynamic fracture simulations.
Snapshots of the failure process in the elastic case are shown in Picture 16. The failure process is associated with the tensile conditions that appear along the plywood/RPUF interface during the rebound event (i. e., after the passage of the compressive wave through the domain). Note also the ability of the CVFE scheme to predict the initiation of the failure process in the part of the interface located immediately above the mastic component.
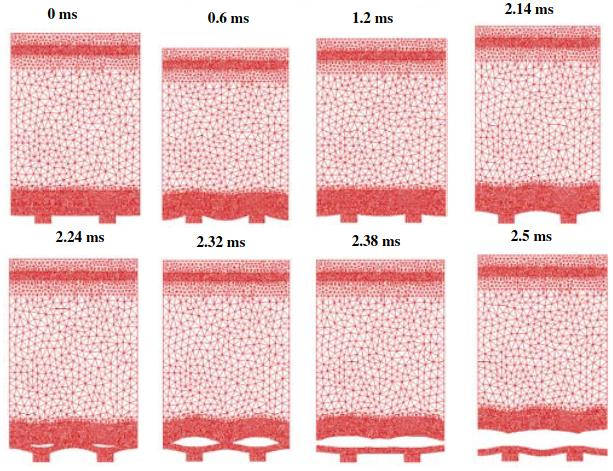
However, the predicted failure is much more extensive than observed in the experiments as the CVFE results suggest complete failure of the interface after approximately 2,35 ms (while the experiments only show the presence of cracks extending only in the region located above the mastics). Various reasons can explain this excessive predicted damage. Firstly, the values used to characterise the failure properties of the plywood/RPUF interface might be not be realistic enough. It is likely that, just like the constitutive properties of RPUF, the failure properties are rate dependent. Secondly, the boundary conditions used along the lower edge of the mastics (fixed displacements) are too “rigid” as they prevent the model from rebounding when the reaction changes sign, which leads to the appearance of excessive tensile tractions along the interface. Also, the model does not account for gravity forces (except for the initial uniform velocity) and does not take into account the presence in the experiments of a reinforcing structure aimed at keeping the whole insulation model specimen together during the tests.
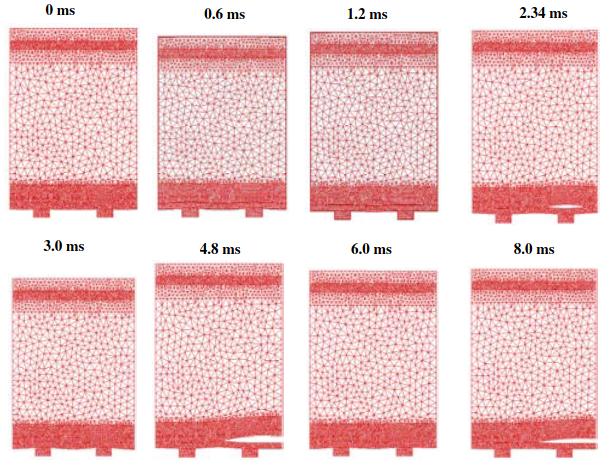
Another key explanation for the excessive failure observed in Picture 16 is the absence in the elastic simulation of structural and material damping. As shown in Picture 17, a viscoelastic analysis of the same problem leads to a very different (and more limited) failure event.
While the results presented in Picture 18 seem to indicate the presence of only one crack, a more detailed analysis of the tensile strain (Eyy) in the vicinity of the crack tips indicates the existence of a second crack along the plywood/RPUF interface. This second crack, which appears later above the left mastic component due to the heterogeneity in the numerical solution (unstructured mesh, round-off error, etc.), interacts with the first one.
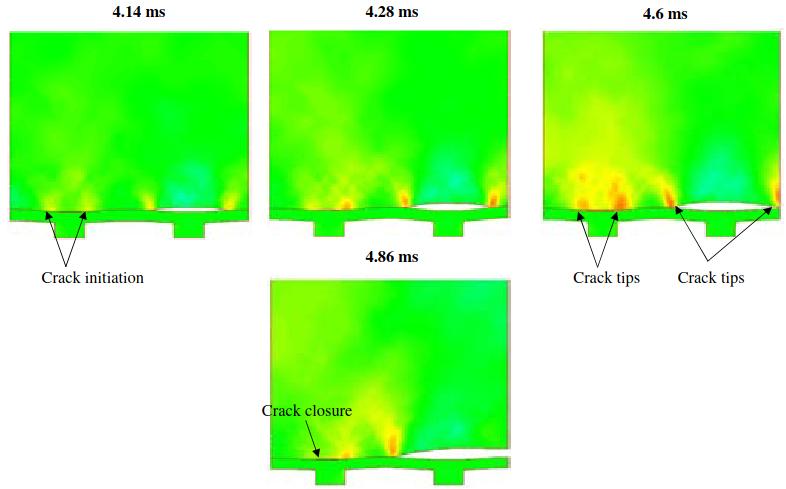
From this interaction results an unloading and subsequent closure of the second crack. Note the ability of the CVFE scheme to capture the strain concentration in the vicinity of the dynamically propagating crack tips.
Dynamic Material Property
Some insulation systems, such as the GTT Mark III system, use polymer materials as the insulator. It has been known that the strain-stress relation and yield stress of the polymer materials depends on the time rate of the strain. The plywood in the NO 96 system may also have strain-rate dependency when the duration of the impact load is extremely short. The linear elastic and damping model may not be adequate for these cases. More detailed visco-elastic and/or visco-plastic properties of the polymer materials may be necessary. Experimental testing on these dynamic material properties of the polymer material and plywood is planned and under progress. The dynamic structural response numerical model is implemented from the experimental results.
This experiment was conducted using the split Hopkinson pressure bar (SHPB) technique in which the polymeric specimen is sandwiched between two metal bars, one of which is impacted by a striker projectile from a gas gun. Also, embedded piezo-electric X-cut quartz crystals are used in place of surface mounted strain gauges. The schematic of SHPB is shown in Picture 19. The polymer and plywood materials are tested over a range of strain rates in order to obtain valid dynamic stress-strain curves for high rate dynamic elastic modulus.

Cryogenic temperature of the material has been considered. This dynamic modulus value is used as the instantaneous elastic response of the viscoelastic model to be employed in the numerical simulation.
Impact Strength Assessment
Dynamic Strength Test and Failure Mode
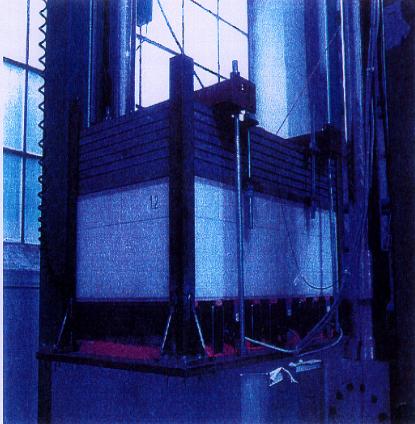
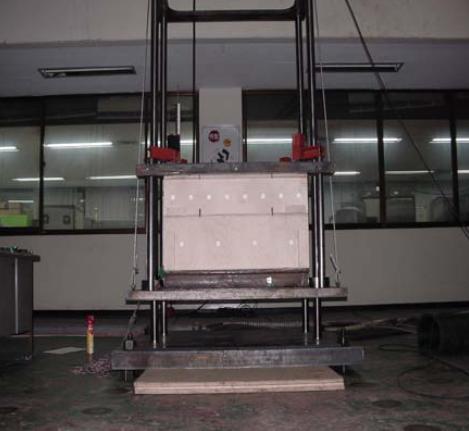
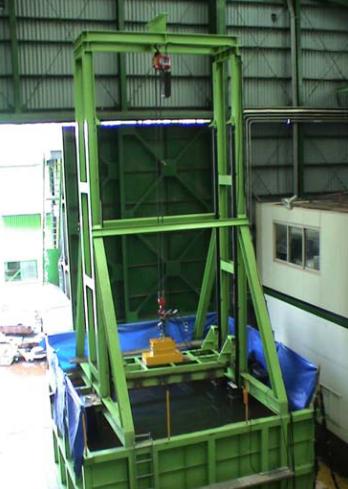
From impact strength test as shown Pictures 20, 21 and 22, the fluid-structure interaction and dynamic structural response have been investigated and numerically simulated for the calibration of ABS DYNA program including dynamic material properties. Another very important information from the impact test is to define the dynamic failure mode of each insulation system, which is different to the critical failure case based on the static loading. A number of joint development projects are performed to define the dynamic strength and failure mode including the following drop tests.
A dry drop test of Mark III by GTT in Pic. 20 provides the failure mode at the foam material near mastic location. The measured acceleration and pressure at the critical locations are utilised in the numerical simulation.
In a dry drop test of NO 96 system by DSME in Pic. 21, acceleration signal has been measured for the impact pressure estimation. The impact load is increased until the boxes collapse changing the drop height and weight on the top of the boxes with or without perlite in the boxes. The buckling mode of the side panel of insulation system has been detected as a failure mode and the effect of perlite to the dynamic strength is investigated.
A water drop test of Mark III system by SHI in Pic. 22 finds the hydroelasticity, corrugation membrane cushioning, structural damping and the strength of insulation system. A numerical calibration for hydroelastic effect is followed for comparison with experimental measurement.
Structural Assessment
The validated numerical scheme is used to evaluate the factor of safety of the insulation system. The hydro- visco-elastic analysis with actual time history of the sloshing impact load is performed. The locality and duration of the sloshing impact are considered from the model test. The failure criteria of the insulation system is inspecting whether the resultant impact pressure on the surface of the insulation system or the maximum stress level exceed the impact strength or stress level at the critical location where the failure initiated in the impact test.
Conclusion
A numerical scheme to evaluate the impact strength of containment system in the Cargo Containment Systems of LPG and LNGmembrane-type LNG carrier is proposed. The scheme consists of seakeeping, sloshing analysis and model test measurement to find the maximum sloshing load on the rigid wall during the LNG carrier’s lifetime operation in the design environmental condition, and a hydro-viscoelastic-fracture analysis of containment system with consideration of fluid-structure interaction during the vibratory motion of the containment system. The effect of locality and duration of the impact load on the structural response is studied. The compressibility in the liquid and visco-elasticity in the containment system are considered in the numerical model. Emphasis is made on the reduction and attenuation of sloshing load while it transmits from the liquid domain to the hull through the containment system.
It has been found that the magnitude and duration of the impact pressure reduces initially at the interface due to fluid-structure interaction and then further attenuates as it propagates from the containment surface to the hull side due to the material damping and locality of the impact load. This tendency is more dominant when duration and span of the impact load is shorter, or when the incident angle between liquid surface and tank wall is smaller. More parametric study on the effect of impact load pattern to the structural response is under way and will be presented elsewhere in the near future.
Preliminary results for simulation of dynamic crack propagation in the containment system are presented to demonstrate the capability of the proposed numerical scheme. Since experimental observations have indicated that failure tends to take place in the vicinity of the lower plywood and foam interface in Mark III system, cohesive elements are placed along that interface. It is shown that the present numerical scheme is able to capture the strain concentration in the vicinity of the dynamically propagating crack tips. Material damping is introduced by viscoelastic model and it leads to different failure event from the one by elastic model.
The developed numerical scheme is utilised to evaluate the impact strength of LNG containment system to sloshing load in various loading and operational conditions.