Time-based heat transfer on a tanker refers to the process of managing and controlling the heat exchange between the LNG cargo and the surroundings over time. This is typically done to maintain the LNG at a specific temperature to prevent it from warming up or evaporating during transportation.
- One-Dimensional, Transient, Heat Transfer Analysis
- Initial conditions
- Boundary conditions
- Results
- Predicted Component Failure Commencement Times
- Metal failure
- Insulation failure
- Insulation combustion
- Update on Issues Remaining – Appropriate Values of the Environmental Factor F1 to Account for Radiation Shielding by the Tank Cover
- Critical Update on Issues Remaining – Thermal Degradation Properties of Polystyrene Foam: New Results for the Estimated Time for Insulation Failure
One common method used is through the use of specialized insulation and cooling systems on the tanker. These systems help to minimize heat transfer by reducing the temperature difference between the LNG cargo and the external environment. Additionally, monitoring and adjusting the temperature of the LNG cargo over time is crucial to ensure its safety and quality. This can be done using temperature sensors and control systems that regulate the cooling or heating mechanisms on the tanker.
One-Dimensional, Transient, Heat Transfer Analysis
A transient heat transfer analysis was made to estimate the time at which complete melting to the tank wall of the insulation could occur, and the potential for fire and or explosion of the vapour/air mixtures formed under the Moss sphere’s steel weather cover following the melting/degradation process were considered.
This report expands on earlier work on heat transfer analysis, particularly the following:
1 Consideration of the credit that should be allowed for limitation of the heat flux to the insulation foam surface, and ultimately to the cargo, by the presence of the steel weather cover.
2 Provision of additional information obtained from the peer-reviewed literature and our own continuing research on the thermal degradation properties of polystyrene foam required to more accurately estimate the expected PS foam surface recession rate as a function of incident heat flux; and new COMSOL calculations of the total time required to completely fail 30 cm of polystyrene foam insulation following exposure of an undamaged Moss sphere to the LNG fire scenario under consideration by the working group.
The COMSOL Multiphysics® Heat Transfer Module and Moving Mesh Modules were used to perform a one-dimensional analysis of the thermal response of a unit area section of a Moss sphere (assumed flat) in which fire (R1) is contacting the steel weather cover (R2), followed by serial resistances representing the air gap (R3) between the cover and the aluminium foil covering the insulation, the aluminium foil (R4) covering the insulation, the insulation (R5), and the inner aluminium tank wall (R6), which is in contact with LNG (R7).
Table 1 specifies the properties of the resistances R2-R6 assumed for the analysis.
| Table 1. Specifications and Thermodynamic Properties of System Components | ||||||
|---|---|---|---|---|---|---|
| Zone | Thickness (m) | Density (kg/m3) | Heat Capacity (J/kg °K) | Thermal Conductivity (W/m °K) | Emissivity | Failure Temperature (°K) |
| R2 | 0,015 | 7 850 | 475 | 44,5 | 0,85 | 810 |
| R3 | 1,0 | COMSOL® | COMSOL® | COMSOL® | NA | NA |
| R4 | 0,0003 | 2 700 | 900 | 70 | 0,1, 0,5 | 873 |
| R5 | 0,30 | 26,5 | 1 045 | 0,038 | NA | 510 |
| R6 | 0,02 | 2 700 | 904 | 70 | NA | 873 |
The following sections describe the initial conditions assumed for the analysis and the boundary conditions interconnecting the resistances specified in Table 1 as well as the boundary conditions connecting the fire (R1) to the steel cover (R2) and the aluminium tank wall (R6) to the LNG (R7).
Initial conditions
The initial-condition temperature profile for the one-dimensional system was calculated with a steady-state COMSOL® analysis assuming an ambient air temperature of 305 °K. Figure 1 shows the temperature profile through the system with aluminium foil emissivity specified as a parameter, illustrating the sensitivity of the heat transfer calculations to the emissivity of the aluminium foil covering the insulation.
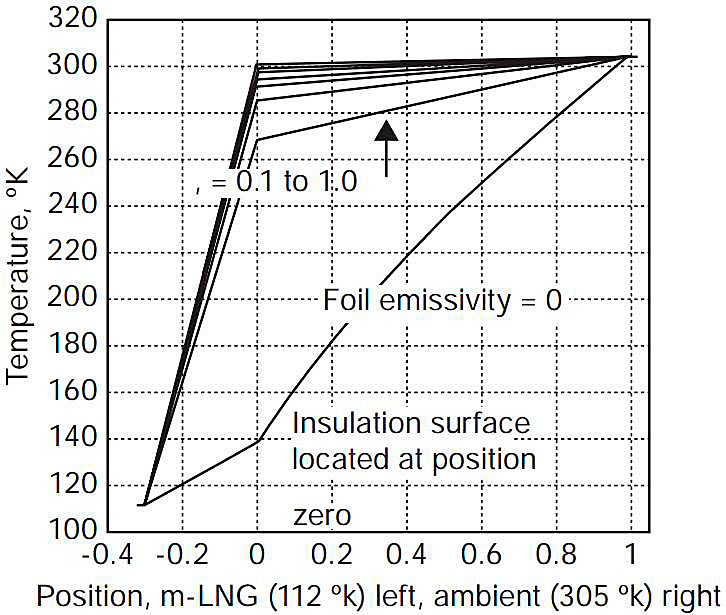
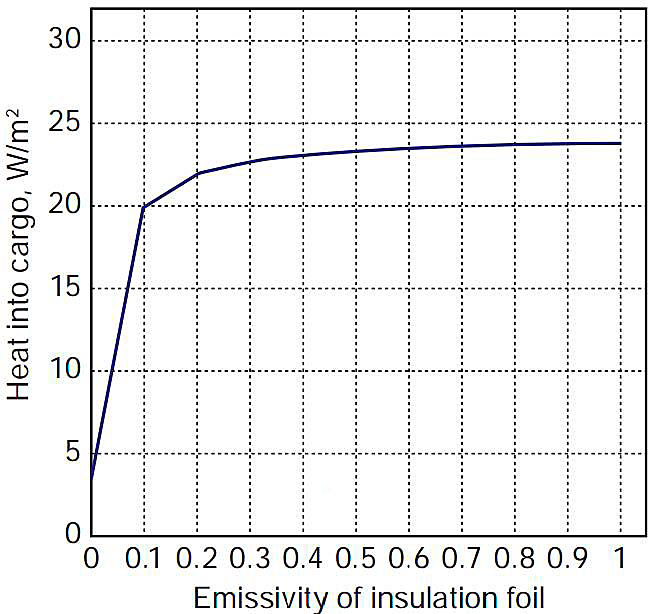
Figure 2 shows the heat flux into the cargo with the foil emissivity as a parameter. For an emissivity of 0,1 (assumed appropriate for a new, clean system) the heat flux into the cargo is approximately 20 W/m2. For a 36 m diameter Moss sphere, this heat flux to the cargo at ambient conditions (305 °K) would result in a boil-off rate of ~ 0,12 % of the cargo per day. This result, which is in good agreement with typical specifications for operating Moss-design carriers, provides a useful check on the propriety of the heat transfer calculation methods utilised in the analysis.
Boundary conditions
Radiative heat transfer (assuming grey body properties) and convective heat transfer (h = 28 W/m2 °K) from the flame to the weather cover were accounted for. Radiative heat transfer and conductive heat transfer were accounted for in the air space under the weather cover; convective heat transfer in that space was neglected. The temperature profiles at the interfaces R4/R5, R5/R6, and R6/R7 assumed continuity (infinite heat transfer coefficient assumed from the tank wall to the LNG). Calculations were made for flame temperatures of 1 300, 1 400, and 1 500 °K, corresponding to calculated initial (maximum) total (black-body radiative and convection) heat fluxes from flame to the steel weather cover (with emissivity = 1,0) of 188, 245, and 315 W/m2 respectively; values that bracket the range of experimental SEP obtained in LNG pool fires.
Results
The time-varying temperatures and heat fluxes throughout the system were calculated with the properties specified in Table 1 for flame temperatures of 1 300, 1 400, and 1 500 °K and aluminium foil emissivities of 0,1 and 0,5, the latter representing the range of emissivities that might be expected for new clean aluminium foil and dirty aged aluminium foil respectively. All initial calculations assume that the materials (including the insulation) remain in place and function with the properties specified above. The primary purpose of these initial calculations was to estimate the times at which the Types of propulsion systems on ships carrying LNGcomponents of the tank system would reach temperatures sufficient to cause failure and to facilitate estimation of the time period expected for complete failure of the insulation. These calculation results are not applicable for greater times.
It was assumed for the purposes of this analysis that failure of the steel and aluminium components of the system would begin once the designated failure temperature had been reached, and initially it was assumed that the minimum rate at which the polystyrene insulation would fail would be determined by its melting rate, which would in turn be determined by the heat flux into the foam at the time at which the foam reached its melting temperature.
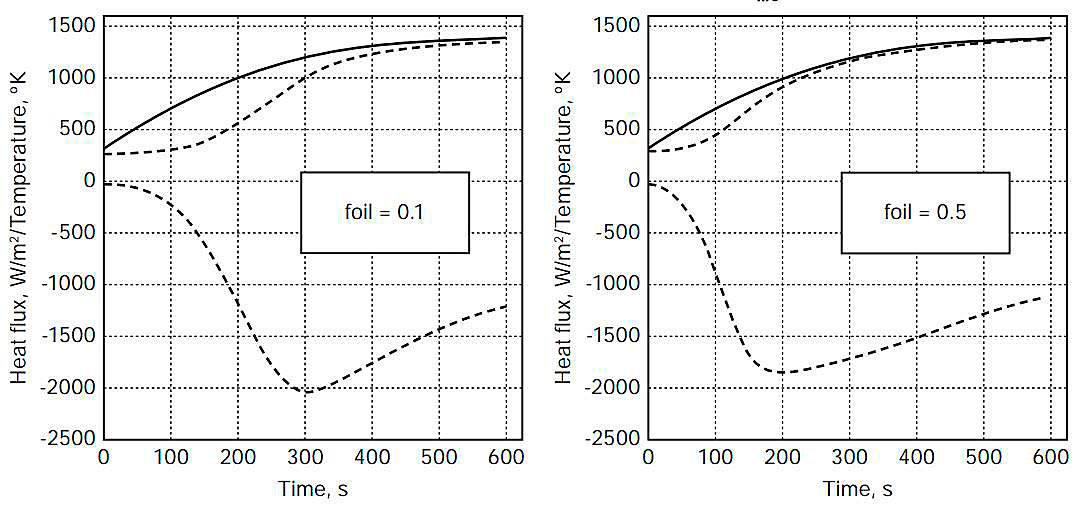
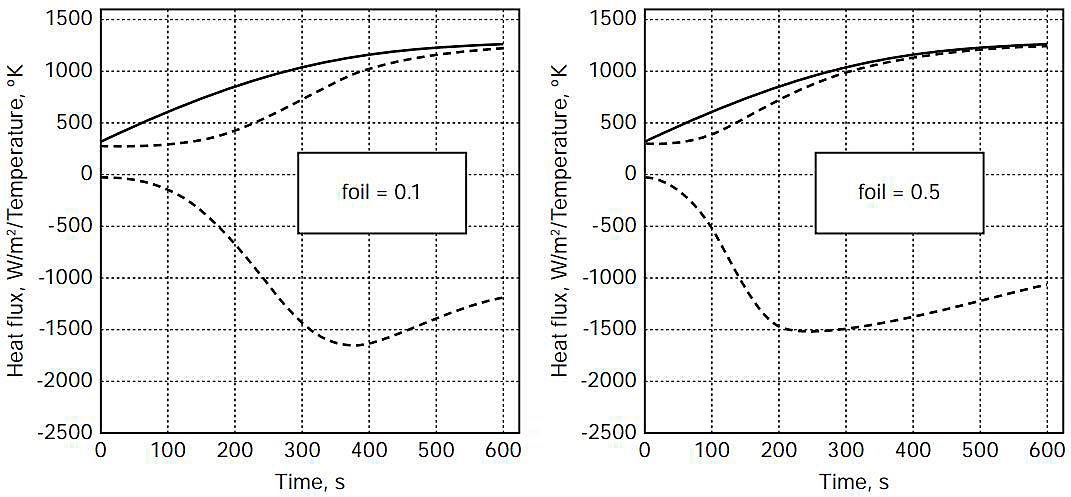
Figures 3-5 show, as a function of time for 600 seconds of fire exposure, temperatures of the steel weather cover (wc) surface (contacting flame with = 0,85) and the (hot-side) insulation (ins) surface, as well as the heat flux into the insulation surface, for aluminium foil emissivities of 0,1 and 0,5, for flame temperatures of 1 300, 1 400, and 1 500 °K.
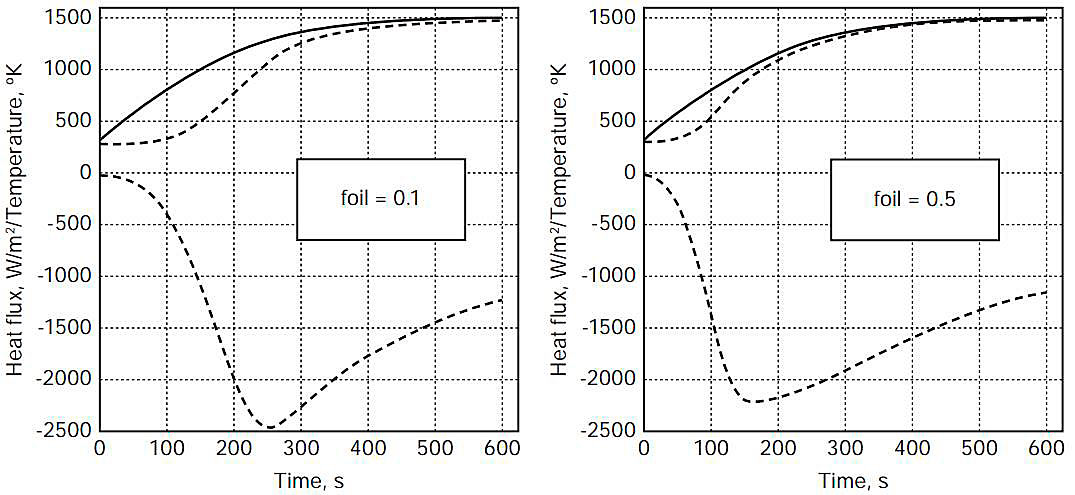
Predicted Component Failure Commencement Times
Table 2 shows the estimated times, from the plots in Figures 3-5, for the (outer) steel weather cover surface, the aluminium foil, and the polystyrene foam insulation (hot-side) surface to reach the failure temperatures designated in Table 1. Because of the thickness of the aluminium foil (0,3 mm), the temperatures of the foil and the insulation (hot-side) surface were assumed identical for this analysis.
| Table 2. Predicted Component Failure Times (seconds) | ||||||
|---|---|---|---|---|---|---|
| Component | Tfire = 1 300 °K | Tfire = 1 400 °K | Tfire = 1 500 °K | |||
| = 0,1 | = 0,5 | = 0,1 | = 0,5 | = 0,1 | = 0,5 | |
| Weather Cover | 170 | 180 | 125 | 125 | 100 | 100 |
| Aluminium Foil | 330 | 260 | 265 | 180 | 215 | 150 |
| Foam Insulation | 225 | 140 | 190 | 120 | 160 | 95 |
Metal failure
The temperature of the steel outer surface reaches 810 °K, indicating approach to failure, in the range 100 seconds to 180 seconds. The time when the aluminium foil reaches its melting temperature (873 °K) ranges from 150 seconds to 330 seconds. To calculate more accurately the actual response of the system is difficult, requiring assumptions as to the specific behaviour of the system components as they fail (read below for new results). Nevertheless, inclusion of such information for specific failure modes would appear to only increase the rapidity with which the system components would fail.
Insulation failure
The polystyrene surface temperature reaches its (assumed) melting point of 510 °K in the range 95 seconds to 225 seconds. Following the time at which the polystyrene foam reaches its melting temperature, the heat flux into the foam insulation maintains an average value ranging from about 1 to about 1,5 kW/m2 for the balance of the 10 minute period shown. If the temperature of the solid insulation could not rise above its «melting point», the heat flux into the foam surface would be expected to increase because the inner tank cover surface temperature is continuing to rise while the moving melting front remains at (essentially) constant temperature. However, the calculation results presented in JHM HAZMAT 7824 did not provide for modelling any phase changes of the insulation material. Therefore, assuming a continuous heat flux of 1,5 kW/m2 into the foam surface, which was thought to be conservative for the reason just described, the foam was estimated to melt at a rate (approximately) given by 1,5 kW/m2 divided by the product of the foam density and its latent heat of fusion. Because of lack of data for polystyrene foam we used the latent heat of fusion for styrene monomer (105 kJ/kg) along with the density of polystyrene foam (26,5 kg/m3) to estimate a melting rate of about 3 centimetres per minute. As stated in HAZMAT 7824, we believed that this should be a rough lower limit on the melting rate because the latent heat of polystyrene (mass basis) could be (much) smaller, depending on the molecular weight of the polymerized styrene (read below). Nonetheless, this preliminary analysis indicated that total melting of a polystyrene insulation layer 0,3 m thick could occur less than 10 minutes after it reaches its melting temperature if the foam were subjected to such intense heat exposures as considered here.
Insulation combustion
This analysis has not considered the potential for combustion of (poly) styrene vapours mixed with air in the space between the weather cover and the insulation surface. Both the IGC Code and 46 CFR 54 require, in order to take credit for the insulation in PRV sizing, that the insulation on the above deck portion of tanks have approved fire proofing and stability under fire exposure. It is noted that the IGC Code considers the weather-cover an extension of the deck. Polystyrene foam, as currently installed on Fuelling the Future – Powering the LNG CarriersLNG carriers, does not appear to meet these criteria. Even if the exterior fire were isolated from the foam (by an intact weather cover), ignition of these flammable vapours appears highly likely given the relatively low auto-ignition temperature of styrene monomer (~ 760 °K) and the fact that only about 1 mm thickness of the insulation would have to vaporise to raise the average vapour concentration in the air space under the weather shield above the lower flammable limit. Given the flue-like configuration formed by the space between the cover and the insulation, the volume of air in that space, and the potential for failure of the steel weather cover that would admit additional air, there is a potential for rapid burning of the insulation material even if the ignition of the vapours prior to the steel weather cover failing did not result in an over-pressure that failed the cover instantly.
Update on Issues Remaining – Appropriate Values of the Environmental Factor F1 to Account for Radiation Shielding by the Tank Cover
As described in the report to the WG and the manuscript accepted for publication by JHM, we compared the equation prescribed for the determination of relieving capacity by the IGC:
where:
- Q – Relief Valve Required Flow Rate;
- F – Fire Factor;
- G – Gas Factor;
- A – External surface area.
with an alternate equation recommended for consideration in a National Academy of Sciences Report to the U.S. Coast Guard:
where:
- QH – total heat absorbed by the cargo;
- q – heat flux to the outside of the bare container (direct exposure);
- F1 – environmental factor, including insulation and radiation shielding;
- E – exposure factor, the fraction of the total tank area (A) exposed to fire;
- A – tank surface area.
For a Cargo System – Tank ConstructionMoss sphere LNGC tank (insulated independent tank in hold), the fire factor F in Equation (1) is equal to 0,2, per IGC. The Gas Factor, G, in Equation (1) incorporates the values of heat flux implicitly prescribed in the IGC code as well as combined factors relating to the determination of flow through the relief valve. Equation (1) incorporates the value of only 71 kW/m2 for heat flux, representing the heat flux to the cargo under conditions of direct (gasoline/kerosene) pool fire exposure to the bare containment. For the present argument, let us call this heat flux qo, setting aside for the moment the question of the value appropriate for an engulfing LNG fire. Since the «Gas Factor» in Equation (1) is directly proportional to qo (G = Kq°), Equation (1) becomes:
Alternatively, using Equation (2) to calculate Q, where QH = Q/G = Q/Kq°, we have:
Since the expression Kq° is common to Equations (3) and (4), it is the expressions FA0,82 and F1EA that should be compared. We believe this is where the problem with the IGC Code equation (Equation (1)) lies. We have studied the history of the development of Equation (1) and point out the following facts, which appear to be of critical importance.
- The factors F in Equation (1) and F1 in Equation (2) are not equal:
- F in Equation (1) accounts for a combination of «environmental factors», which lump together insulation and radiation shielding factors, in the present case protection due to insulation, radiation shielding by the weather cover, and shielding (by the double hull configuration) due to placement of the tank in the hold (below deck level). The factor is empirically assigned, here 0,2, per IGC;
- F1 in Equation (2) accounts for «environmental factors», but here it is clearly intended to account only for the effect of insulation and the radiation shielding afforded by the tank weather cover, it does not account for determination of the fraction of the tank surface that is exposed to fire (or protected by being in the hold). Consequently, F1 should be set equal to 1 in the absence of both insulation and shielding by the weather cover.
- the factor E in Equation (2) specifies the fraction of the tank surface area exposed to fire. For the Moss sphere, the most critical area is the portion of the tank above main deck – we assume that 40 % of the tank area is above deck. The appropriate value of E in Equation (2) is then 0,4.
Consequently, independent of the value used for the expression Kq°, the ratio of the relieving capacity indicated by formulas (1) and (2), for a 36 m diameter Moss sphere (Area = 4 072 square metres), is:
As stated in our report to the WG and in our JHM paper, this means that even if the same heat flux is used (in both formulas), the value of the factor F1 accounting for insulation and shielding by the weather cover in Equation (4) must not be greater than ~ 0,1 in order that the required relief capacity be as small as indicated by the method currently required by the IGC. Conversely, total loss of insulation and weather cover (radiation) shielding (on the part of the tank exposed to fire, i. e., above deck) would result in under-prediction of the required relieving capacity by a factor of ~ 9 (order of magnitude).
Read also: Cargo Tank Instrumentation on Gas Tankers
To determine the applicable value of F1 to account for the reduction in heat absorbed by the cargo due to the presence of the steel weather cover alone, without the insulation or its foil covering, steady state calculations were made with COMSOL® of the heat flux to the cargo for the following cases (configurations of the series resistances to heat transfer depicted in Table 1). As these calculations are intended to simulate the heat transfer to the cargo if the steel weather cover surfaces or the tank surface were directly exposed to the fire environment or to the degradation products of the insulation, their respective emissivities were set to 1,0.
1 Case 1 – R6 only. This configuration describes the direct exposure of the fire to the bare LNG tank wall. The appropriate value of F1 is 1,0.
2 Case 2 – R4 and R5 eliminated. This configuration describes direct exposure of the fire to the weather cover after the PS foam and its aluminium foil covering have melted away and the space occupied by the foam and foil filled with air (no consideration is given here to potential for combustion of the foam products). The appropriate value of F1 is then the ratio of the resulting heat flux to the cargo (Case 2), to the heat flux to the cargo if components of the insulation system and weather cover are absent, ie direct fire exposure to the LNG tank wall (Case 1).
For fire temperatures of 1 300 – 1 500 °K, the values of F1 ranged from 0,4 to 0,42, reflecting the non-linearity of the radiation heat flux boundary condition over the temperature range of interest.
Critical Update on Issues Remaining – Thermal Degradation Properties of Polystyrene Foam: New Results for the Estimated Time for Insulation Failure
There remained in our previous report to the WG important uncertainties about thermal properties of polystyrene foam critical to the estimation of the time to failure, including principally the melting temperature and latent heat of melting/degradation/vaporization. We have recently obtained additional information from the peer-reviewed literature for the thermal degradation properties of expanded polystyrene (EPS) foam used in the expendable pattern casting (EPC) process. Although there are numerous references to the thermal degradation properties of this particular polystyrene foam product and application, all we have found appear to be consistent with the data from Mehta, et. al. 7, obtained with Differential Scanning Calorimetric (DSC) and Thermal Gravimetric Analysis (TGA) analyses of EPS foam:
| Bead collapse temperature | 110-120 °C |
| Bead melting temperature | 160 °C |
| Molecular weight | 300 000 – 500 000 |
| Density | 24 kg/m3 |
As the temperature is increased beyond 110 ºC the expanded beads begin to collapse and the average bead size decreases substantially. This collapse temperature range compares well with the glass transition temperature of polystyrene, which has been reported to range from 80 to 120 °C.
At 160 °C the beads completely melt to produce a viscous residue. Volatilisation of the viscous residue begins at 278 °C and the polymer is almost totally volatilised at 460 °C. DSC analyses yield a small endothermic peak between 90 and 120 °C, thought to correspond to the glass transition within the polymer.
DSC analyses yield a large endothermic peak between 320 to 490 °C. This endothermic peak, representing the heat of degradation, is estimated to be 912 J/g.
The total energy under the endothermic peak between 320 and 490 °C represents the sum of the energy (absorption) effects for vaporization and thermal degradation. The onset temperature of this endotherm is 320 °C, which is 160° above the melting temperature. There was detected no significant melting energy (latent heat of melting or fusion) in these experiments with polystyrene foam, as has been suggested might be anticipated, since most foam materials are amorphous polymers. As the magnitude of the heat of degradation would have only secondary importance in determining the melting rate of the foam if the melted foam material runs off the vertically oriented surface of the insulation, this data indicated further potential for more rapid foam recession (failure) rates than were considered in our preliminary analyses.
Using the value of 912 j/g for the energy required to convert solid polystyrene foam at its melting point (assumed here to be 510 K) to vapour (melting and vaporization), from Mehta, et.al., and utilizing the Moving Mesh Module of COMSOL Multiphysics®, calculations have now been completed which we believe provide reasonable estimates of the times required for the complete failure of 30 cm of polystyrene insulation as currently installed on Moss sphere LNG containments. The new calculations incorporate the following specific changes and extensions of the calculations reported previously:
- The value 912 j/g, representing the energy required to convert the insulation to vapour form;
- the melting temperature is assumed to be 510 K. For purposes of the calculation, the phase changes from solid to vapour are assumed to occur at 510 K;
- the sensible heat (energy) required to heat the insulation from its initial condition to 510 K has been incorporated, assuming an (average) temperature increase of approximately 320 K to bring the insulation behind the moving front up to 510 K. The heat capacity reported in Table 1 has been used for these calculations.
The total time required to heat the surface of the insulation to 510 K and for the subsequent complete failure (change to vapor form) to a depth of 30 cm for flame temperatures of 1 300, 1 400, and 1 500 °K (radiation heat transfer only) have been recalculated. As the results are sensitive to the emissivity values used, the aluminium foil emissivity was treated parametrically to estimate the potential for complete failure of the insulation in periods of order 10 minutes. The results are shown in Table 3.
| Table 3. Total Predicted Insulation Failure Times (minutes) | |||
|---|---|---|---|
| Foil Emissivity | Tfire = 1 300 °K | Tfire = 1 400 °K | Tfire = 1 500 °K |
| 0,1 | 28,8 | 21,8 | 17 |
| 0,3 | 14,7 | 11,4 | 9 |
| 0,5 | 11,6 | 9 | 7,2 |
The calculations indicate that for LNG fire temperatures ranging from 1 300 K to 1 500 K the insulation is subject to complete failure in time periods ranging from 7,2 minutes to 28,8 minutes, depending on the operative foil emissivity ranging from 0,1 to 0,5, even if the weather cover is undamaged and continues to provide radiation shielding.
We are continuing at the University of Arkansas (USA) and the University of New Brunswick (CA) our independent analyses, using further computational fluid dynamics modelling as well as laboratory experiments, of the dependence of failure rates of polystyrene foam insulation with fire-heat exposure.