The heat transfer to a reservoir of an LNG tanker is important to maintain the LNG in its liquid state. This is typically done by using insulation to minimize heat transfer from the surroundings and by using a reliquefaction system to remove any heat that may have entered the tank.
- Fire Scenario
- Limit for Heat Flux into LNG and Possibility of Tank Collapse
- Heat flux into the weather cover
- Possibility of film boiling
- Burning of the Insulation or Explosion of Combustible Mixtures
- Burning of insulation
- Explosion within the cargo hold
- CFD Evaluation of the Tank Fire Problem
- CFD calculation
- Heating up of the Weather Cover and the Insulation
- Heat Transport into the Insulation
- Relation of CFD Calculation Results to Pool Fire Burning Duration According SANDIA Report
- Melting of insulation and leak size
- Heating up of weather cover and leak size
- Temperature in Skirt Area
- Conclusions
It is crucial to keep the LNG at a low temperature to prevent it from vaporizing and expanding, which could lead to unsafe conditions in the tanker.
The following summary is based on the results of two studies related to the heat transfer into an LNG cargo tank undertaken in 2007 and 2008 Ref. 01 & Ref. 02. The content of on article published in The Journal of Hazardous materials in February 2008 Ref. 03 has also been considered. The first study dated 2007-11-07 is related to the thermodynamic boundary conditions of the fire case and was undertaken by the Helmut Schmidt University Hamburg and Germanischer Lloyd Hamburg. The second study is based on these first findings and is related to transient (time dependent) modelling of the heat transfer into the tank by the use of Computational Fluid Dynamics (CFD). This study was the subject of a Master’s thesis undertaken at the University of Rostock.
All studies are related to a pool fire engulfing a Moss Type LNG tank. Source Ref. 01, Ref. 03 are attached as an Appendix to this report. For the CFD modelling Ref. 02 only the Powerpoint presentation at the University of Rostock on 2008-07-17 is attached. The major findings and conclusions are given as follows.
Fire Scenario
Considerable uncertainties exist about the flow behaviour of an engulfing fire and the realistic modelling of the heat flux to the tank or, in the given case, to the ship structure above the waterline and the weather cover of the LNG Moss type tank under consideration. The fire itself has not been modelled. Instead simplified scenarios are used.
Heat fluxes known from Fire Scenarios on liquefied gas carrierspool fire experiments are generally measured at the visible outer boundary of the fire. At this location the access of air to the fuel is much better compared to the access of air to unburned fuel within the fire ball formed by the pool fire. For this reason the combustion in a large fire ball is incomplete and the flame temperature lower compared to the complete combustion at the boundary between fire ball and ambient air. Therefore, the heat flux from the fire is lower in the fire ball than at the surface of the fire ball. According to CFD comments and a video presented to the WG, maximum values measured at the Montoir fire test were about 300 kW/m2. This is also reported in Ref. 03 by stating «… local surface emissive heat fluxes have been measured in test LNG fires as high as 300 kW/m2,…» (p.3).
The experiments that form the bases of all regulations related to the sizing of safety valves for the fire case (comp. Sec 4) give maximum values of 108 kW/m2 as a baseline for safety valve design (comp. Sec 4 source cite-01, cite-02). This heat flux is assumed to be uniform at all parts of the tank that is subjected to the fire. In reality the heat flux will have large variations depending on the smoke within the fire ball and on the completeness of the combustion. For this reason the value used by the regulations covers much higher maximum heat fluxes because it is an average value.
For the reasons stated above, the maximum average value of a realistic fire scenario is accepted to be 108 kW/m2. Nevertheless, this study has included evaluation of much higher values; up to 300 kW/m2 for the sake of completeness of the evaluation since these values were suggested as plausible by at least one WG member.
For the purpose of the studies a constant flame temperature corresponding to the assumed initial heat flux into the tank has been assumed to be present at the complete surface above the waterline.
Limit for Heat Flux into LNG and Possibility of Tank Collapse
The following is an evaluation of the possibility that the tank can theoretically fail in the wetted surface area (comp-01).
If the insulation is not present and the weather cover is at very high temperatures, the LNG in the tank starts boiling. Until the boiling reaches «film boiling» the tank wall is kept nearly at LNG temperature. If a transition to film boiling occurs the tank wall is no longer protected by the liquid LNG because a film of methane vapour is separating the tank wall from the LNG. If this situation occurs the tank wall can overheat and collapse. This case has been evaluated in Ref. 01.
As explained below, film boiling will not occur even under extreme theoretical assumptions. Therefore, overheating of wetted surface area of the tank and the possibility of tank collapse for this reason can be excluded from further consideration.
Heat flux into the weather cover
The following results are from Ref. 01, which assumes stationary conditions without time dependency. Most of the heat from the fire is transferred into the steel structure by radiation and not by convection. Without convection the flame temperature can be calculated from the basic equation for radiation:
An initial heat flux of q = 300 kW/m2 corresponds to a flame temperature of approx 1 500 K, which is very close to the highest flame temperatures measured in large LNG fire tests. The relevant heat flux for the tank is the heat flux that comes from the inner surface of the weather cover, and it heats up the air gap under the weather cover and also the insulation system itself. The time dependent CFD calculations demonstrate that the convective heat transfer in the insulation space is only contributing to a small extent to the overall heat transfer. Using radiation only, a flame temperature of 1 500 K and a maximum cover temperature of 1 273 K, the heat flux to the weather cover from the fire is:
As is demonstrated in Fig. 1, even with a maximum initial heat flux of the fire at 300 kW/m2 it is not possible to heat up the tank cover above 1 000 °C if at the same time the insulation is assumed to be completely destroyed (comp below).
For this reason it has been agreed in the WG that temperatures of the (complete) weather cover of more that 1 273 °K can be excluded, even in theoretical evaluations. At the same time the maximum heat flux into a complete bare tank is limited to 150 kW/m2.
Possibility of film boiling
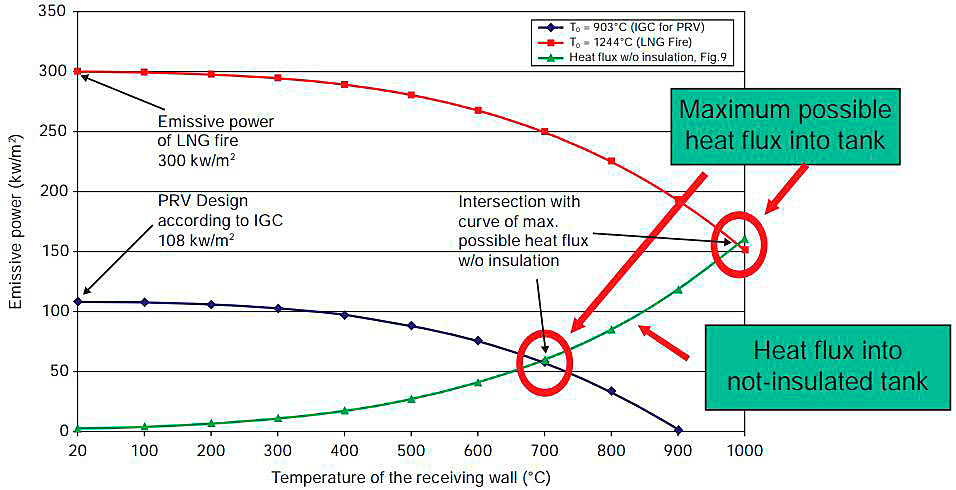
The x-axis of Fig. 6.1 shows the temperature of the weather cover. The y-axis gives the heat flux that is received from the fire by the weather cover. For a fire of 300 kW/m2 initial heat flux the flame temperature is about 1 500 K (red curve). For a fire with 108 kW/m2 the flame temperature of the fire is about 1 180 K (blue curve). The heat flux received is decreasing with increasing steel temperature, as explained above.
The green line in Fig. 1 shows the heat flux to wetted surface of the bare tank. At the beginning with the weather cover at 20 °C the heat flux to the tank wall, which is at minus 163 °C, is relatively low (approx. 2.2 kW/m2). With increasing weather cover temperature the heat flux into the tank is increasing. The maximum value is reached at the intersection of the curves. A higher value is not possible because the radiation from the tank is starting to cool the weather cover instead of the weather cover heating up the tank.
From Fig. 1 it can be concluded that heat fluxes into the tank, and therefore energy available to evaporate the LNG of more than 150 kW/m2 for the most extreme conditions and of more than 60 kW/m2 for the PRV sizing criteria of the IGC-Code, are not possible. Again this extreme case assumed that all the insulation has been removed or is otherwise ineffective, a scenario considered in detail below.
As can be seen from Fig 3 in the 1-D study Ref. 01, film boiling does not occur at these heat fluxes. Therefore, overheating of the tank wall in the wetted surface area, which would create the possibility of tank collapse, is excluded from further consideration.
Burning of the Insulation or Explosion of Combustible Mixtures
Burning of insulation
In Ref. 01 the possibility of insulation burning was evaluated by calculating the amount of insulation that can be burned by the available oxygen in the insulation space (cargo hold) assuming that the hold is filled with ambient air. It was established that in many cases the hold is at least partly filled with nitrogen. The insulation system itself under the aluminium sheet covering is always filled with nitrogen as this atmosphere is constantly monitored as part of the gas detection system required by the IGC-Code.
As described in detail in Ref. 01 page 19, the air in the cargo hold is only able to supply oxygen for burning of 21 m2 of styrene. If the insulation burning was uniform this would be equal to 5 mm insulation thickness. It must be noted that this calculation assumes that all air reacted with the insulation. In reality this will be not the case because combustion needs minimum oxygen content in the air. A more realistic value will be the burning of less than 10 m2 of insulation, even if the atmosphere in the cargo hold has 21 % oxygen (ambient air oxygen content) at the beginning of the burning event.
Explosion within the cargo hold
During the WG deliberations the possibility of formation of explosive mixtures of oxygen and vaporized insulation was discussed. According to the time dependent CFD calculations done in Ref. 02, the time for reaching the melting temperature of styrene of about 500 K is between 170 s for 300 kW/m2 initial heat flux to 420 s for 88 kW/m2 initial heat flux (comp below). According Ref. 03 p. 6, the melting rate of the insulation may be up to 30 mm per min, which gives 0,5 mm per s or 2 s per mm. Also according Ref. 03 p. 6, only 1 mm is needed to reach the lower explosion limit of an air styrene mixture, which is about 1 % vol. The upper limit is in the range of about 6 % vol (source: data for styrene monomer from the internet). The only ignition source is the hot weather cover.
The CFD calculations explained below Ref. 02 give a time range for reaching the self ignition temperature of styrene (according Ref. 03 p. 6 of about 760 K) that is between 132 s (for 300 kW/m2 initial heat flux) to 480 s (88 kW/m2 initial heat flux). This means that the weather cover reaches the auto ignition temperature of styrene 38 s before melting occurs (300 kW/m2) and up to 60 s after melting occurs (88 kW/m2).
Using the assumption of a homogeneous mixture, without mixing time as a first step to judge the problem, it was concluded that for the high heat fluxes of 300 or 200 kW/m2 the flammable gas content in the hold would be too high to allow burning or explosion because, according Ref. 03, 6 % vol is reached 12 s after the melting point temperature is reached at the insulation surface. Only at lower heat fluxes would the weather cover be hot enough to ignite styrene vapour and burning or explosion be theoretically possible because the insulation reaches melting temperature 20 s to 60 s after the weather cover reaches auto ignition temperature.
The question considered was; is it even theoretically likely that the ignition of styrene will be able to damage the weather cover in a way that causes it to lose its effectiveness as a radiation shield for the insulation system? (i. e., is it possible to blow-off the cover? Such an event is not supported by any reported historical gas carrier incident.) Nevertheless, it was addressed because the likelihood of creating explosive mixtures increases with decreasing heat flux into the insulation, as explained above.
The view was expressed by members of the WG that, based on their individual engineering experiences, it appears more likely that there would be local insulation melting in a random process even if the complete tank is under fire. The vapour would tend to mix with air and reach the hot weather cover after travelling with the turbulent convection flow (result of CFD calculations in Ref. 02). It may ignite if within the flammable range and randomly driven combustion would last until the very limited amount of air was consumed.
There appeared to be no technical basis to expect that vaporized styrene would mix with air into a stoichiometric mixture, needed for a violent explosion, and be ignited by the hot weather cover at the same time across the tank of 41 m diameter.
It appeared far more likely that small amounts of combustible mixtures at the hot surface of the cover may cause small explosions, but these events were not considered likely to result in Hazards of LNG and Relevant Gasesa dangerous pressure increase. The amount of combustible mixtures reacting at a given time will be small compared to the large volume of the hold space.
Note: Beside the subject of this report it should be noted that care must be taken to the presence of combustible mixtures after a fire that may have lead to melting of insulation material because styrene is much heavier than air and may accumulate in the lower hold space parts after the fire. During the fire this can be excluded because of the convection flow, which will keep the combustible mixtures in the upper part of the tank (result of CFD calculations Ref. 02).
CFD Evaluation of the Tank Fire Problem
The 1-D stationary calculations performed in the first study in 2007, Ref. 01, left the questions of real time dependent behaviour of a theoretical catastrophic fire event open. Particularly, the influence of the convective flow that occurs between the upper and lower part of the tank (the part protected by water ballast tanks and the sea water below the water line) could not be judged. Furthermore, the real time dependent heat transfer through the insulation was an open question.
Time dependent calculations of the heat transfer into the tank were the COMSOL calculations that were documented by Ref. 03. These gave results but no information that would allow the re-calculation of the results.
In addition, questions that came from the findings of the 1-D study undertaken by Helmut Schmidt University and GL Ref. 01, had been left open. Also the finite element buckling evaluation done by ABS, Ref. 06, left questions open. On the other hand it was obvious that the theoretical scenario under discussion would last only a very limited time (between 3.4 and 40 min Ref. 05) and therefore a detailed evaluation of the theoretical fire scenario agreed by the WG was necessary.
Related to this background it was obvious that only time dependent CFD calculations could give needed insight to allow judgement on the very severe theoretical fire scenario that was set up as a basis of the WG terms of reference.
For this reason GL decided to work together with the Institute of Fluid Dynamics at the University of Rostock to contribute to the work of the WG on the scale of a Master thesis. The calculations were performed under advice of GL Hamburg and in close co-operation with ANSYS Company, who license the CFX software to GL. Input was provided by the ABS WG member regarding the model and parameters used in the ABS buckling evaluation, Ref. 06, and from the Moss Maritime WG member with regard to the details of Moss Type LNG cargo tank system.
CFD calculation
As a simple check on potential buckling of the tank cover, under the influence of a fire, ABS performed a finite element thermal stress analysis to determine the time from the initiation of the fire to the point where structural damage starts to occur, Ref. 06. ABS assumed values for a constant heat flux from the fire into the tank cover of 88, 108 and 200 kW/m2. The tank cover to deck connection was held at 100 °C so there was conductive heat flow to the hull structure but no radiant heat flowing from the tank cover to the insulation system.
According to the more realistic behaviour of decreasing heat flux into the weather cover with increasing weather cover temperature, the time dependent CFD calculations were carried out by assuming a temperature relation between fire and the heat transfer from the weather cover into the hold space and finally into the tank.
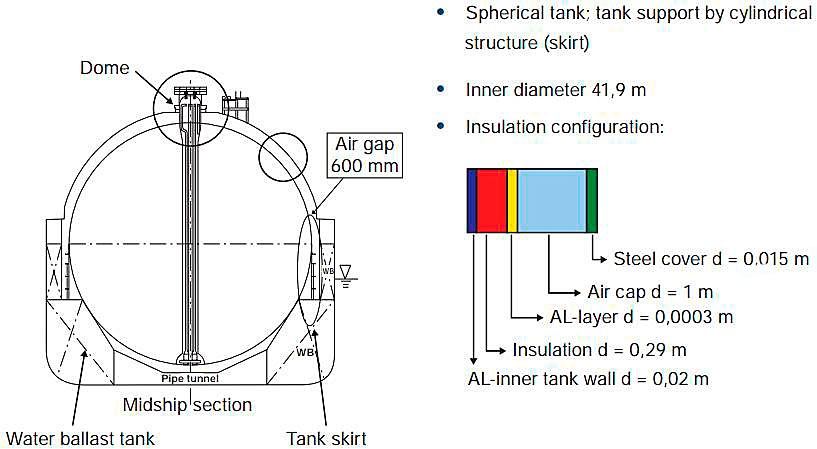
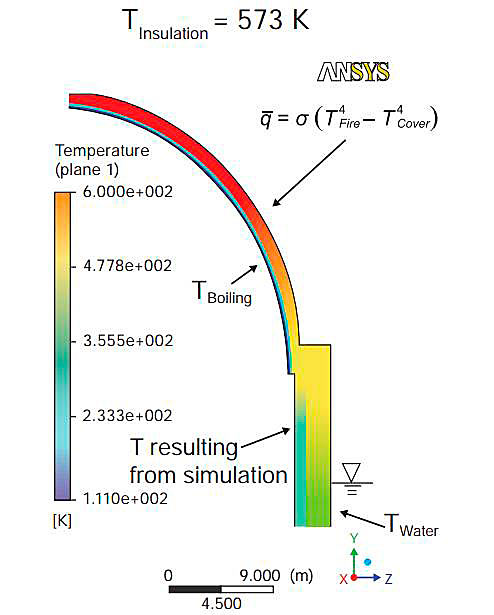
The configuration for the CFD modelling is shown in Fig. 2.
Transient heat transfer calculations were undertaken for the combined heat transfer of radiation, convection and conduction. The model was extensively validated, including reference calculations of temperature distributions under normal operation conditions that were compared to data supplied by Moss Maritime, time step and mesh validation. In addition, the results of ABS buckling calculations were reproduced by independent calculation using only the ABS input data. Detailed results are given in Ref. 02.
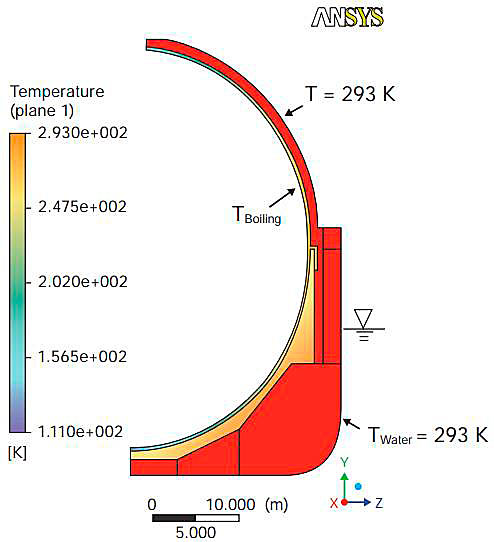
Fig. 3 shows an image of the CFD model for the reference calculation under normal operation temperature conditions.
Consideration of radiation, convection and conduction
All calculations for fire conditions were set up with the normal operational conditions present until the fire started.
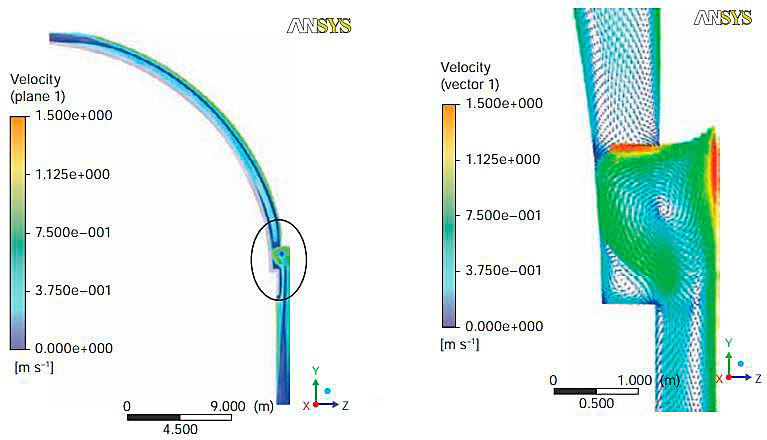
Transient calculations were necessary because the natural convection especially, in the area of the skirt, fluctuated and could not be calculated with sufficient stability using stationary assumptions. Fig. 4 shows the flow field in the tank at 148 s after the start of the fire.
Heating up of the Weather Cover and the Insulation
The heat flux into the weather cover was calculated for initial heat fluxes of 88, 108, 200 and 300 kW/m2. The ABS calculation used a constant heat flux over time. The CFD calculation used a time dependent temperature heat flux, which is related to the weather cover temperature as already described above. The heat flux is calculated for each time step by:
Fig. 5 shows the comparison of the original ABS data for heating up the weather cover with 88 kW/m2 (blue line), the CFD calculation using a constant heat flux as used by ABS (green line) and the temperature difference between fire and cover related heat flux as given above (red line).
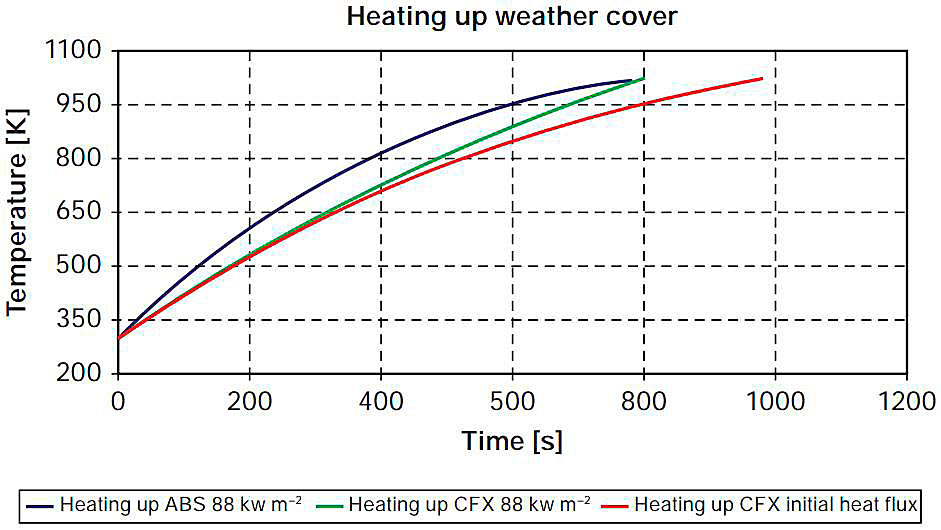
It can be seen that the ABS and GL CFD calculation results are very close for the same boundary conditions and that the more realistic temperature difference dependent heat flux leads to longer times for heating up the weather cover.
The summary of results for temperature increase of the weather cover and the insulation are shown in Fig. 6.
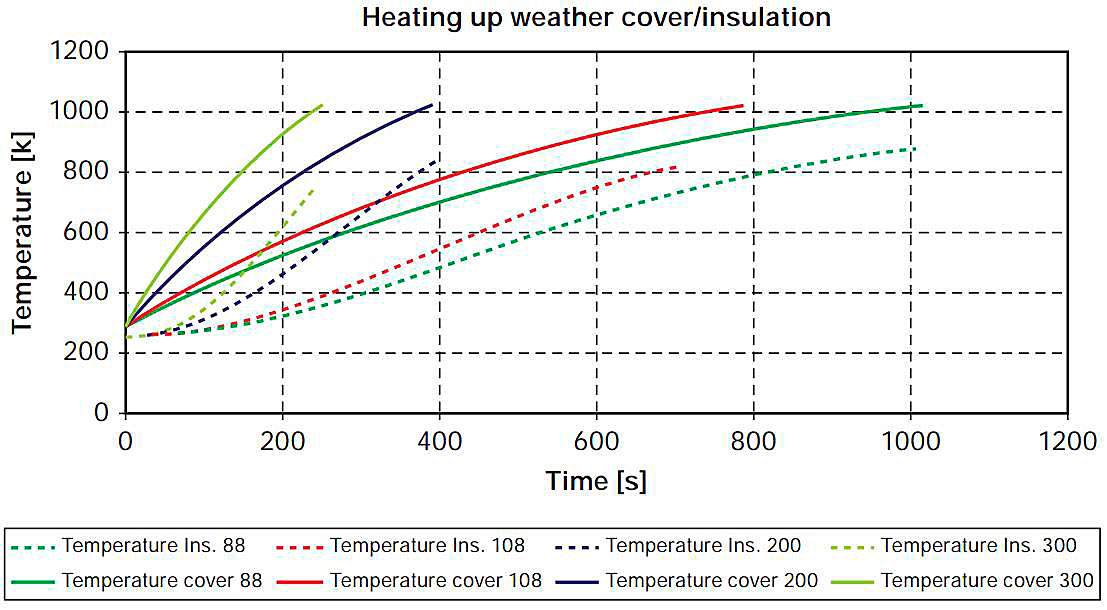
Melting of insulation was assumed to start between 473 and 573 K. Initial damage of the weather cover started at about 1 023 K according to the ABS report. This is based on an abrupt drop in the Young’s modulus of the A-32 steel cover, which predicted very local deformation of the cover plate at the joint to the top girder.
The time needed to reach an insulation temperature of 573 K (melting) and a cover temperature of 1 023 K (start of damages) is given in Fig. 7.
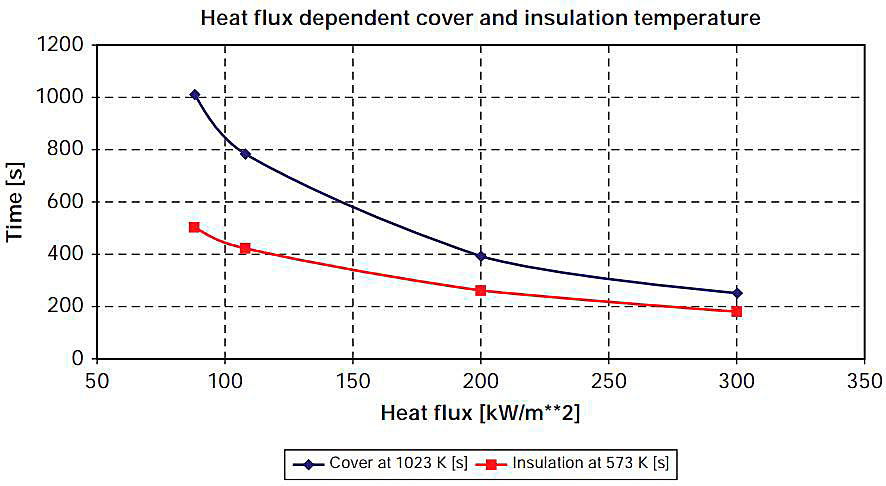
The related values from CFD calculations are given in Table 1.
| Table 1. Time to Reach Limits for Cover and Insulation Temperature | ||
|---|---|---|
| kW/m2 | Cover at: 1023 K [s] | Insulation at 573 K [s] |
| 88 | 1 013 | 500 |
| 108 | 784 | 420 |
| 200 | 391 | 260 |
| 300 | 250 | 180 |
The figures indicate the necessary time to heat up the weather cover and insulation to temperature values where any damage may start to develop. It should be noted again that the assumption is a fire that completely engulfs the tank above waterline and has a uniform heat flux into the complete tank structure in the fire. The heat flux was assumed to strike the cover in a radial direction, (ie there was no reduction in heat flux for the upper parts of the tank cover due to a low thermal radiation view factor.) This would effectively mean that the flames were higher than the tank cover, more than 40 m above the water and on all sides. This is again important because the first structural deformation of the cover is predicted at the upper most part of the hemisphere, as is shown in Fig. 11.
Depending on the assumed heat flux the minimum time to heat up the weather cover to temperatures where damage starts is 1 013 to 250 s (approx. 17 min to 4 min).
Depending on the assumed heat flux the minimum time to heat up the insulation surface to a temperature where first damages by melting occur is 500 to 180 s (approx. 8 to 3 min).
Heat Transport into the Insulation
The transient heat transport into the insulation could not be modelled with 1-D stationary evaluations. The CFD analysis allowed the detailed modelling of the temperature distribution and as a result the determination of the heat transport into the insulation. Fig. 8 shows the temperature distribution in a profile of the insulation at the time when the melting temperature is reached at the surface.
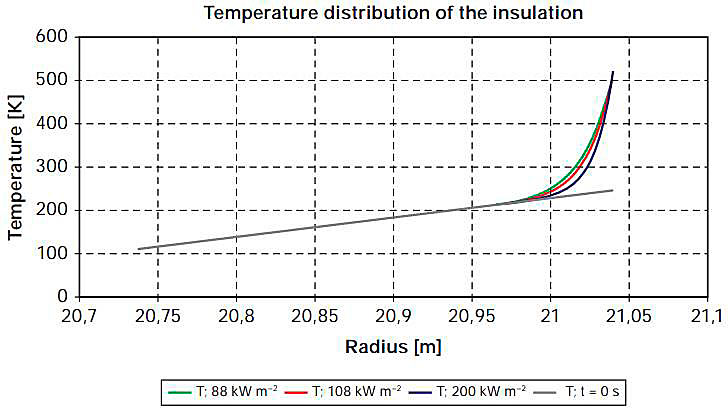
It was calculated that approximately 4 cm of insulation thickness (see Fig. 8) would be affected by the increased heat flux caused by the fire. It is not possible to heat up the rest of the insulation during the short time until the surface of the insulation reaches its melting temperature. This effect is independent of the assumed value of the heat flux.
The extremely low heat transfer characteristics of the insulation system on an LNG carrier are chosen to reduce the boil-off rate to less than 0,15 % per day. Consequently, it is obvious that the LNG in the tank will have no increased heat flux under fire exposure until the insulation is almost completely destroyed. Therefore, Liquefied natural gas (LNG) – The Ideal Gasthe pressure increase in the tank will only start at this point.
In Ref. 03 a melting rate of 30 mm/min is stipulated. This melting rate did not consider the necessary heat which is needed to heat up the insulation itself. As can be seen from the recalculation undertaken with the data given in Ref. 03, the 30 mm/min is based on the energy needed for melting only. Considering the fact that the insulation must be heated up to the melting point leads to additional time required to do so. This is demonstrated by the calculation enclosed in the Appendix 6 (Insulation-Heating Comparison). Using the heat flux into the insulation of 1 500 W per m2 as given in Ref. 03 leads to an additional time of 970 to 1 240 s (for 473 and 573 melting temperature respectively). This is 1,8 to 3,0 times the values assumed in Ref. 03. The corresponding melting rate will, therefore, be smaller than 30 mm/min. Using the data above a value of 17 mm/min to 10 mm/min will be more realistic.
Therefore, the melting of the insulation will be in the range of 17 to 29 min, not 10 min as was assumed in Ref. 03.
Relation of CFD Calculation Results to Pool Fire Burning Duration According SANDIA Report
As a final result the durations calculated within the CFD evaluation were related to the burning durations and leak sizes as given in the SANDIA report Ref. 05.
Melting of insulation and leak size
In Fig. 9 and Fig. 10 the fire durations are given on the y-axis and the leak sizes are given on the x-axis. Fig. 9 illustrates the minimum time related to the leak sizes until the melting of the insulation may start and begin to destroy the insulation. It gives these relations for the initial heat fluxes of 88, 108 and 200 kW/m2.
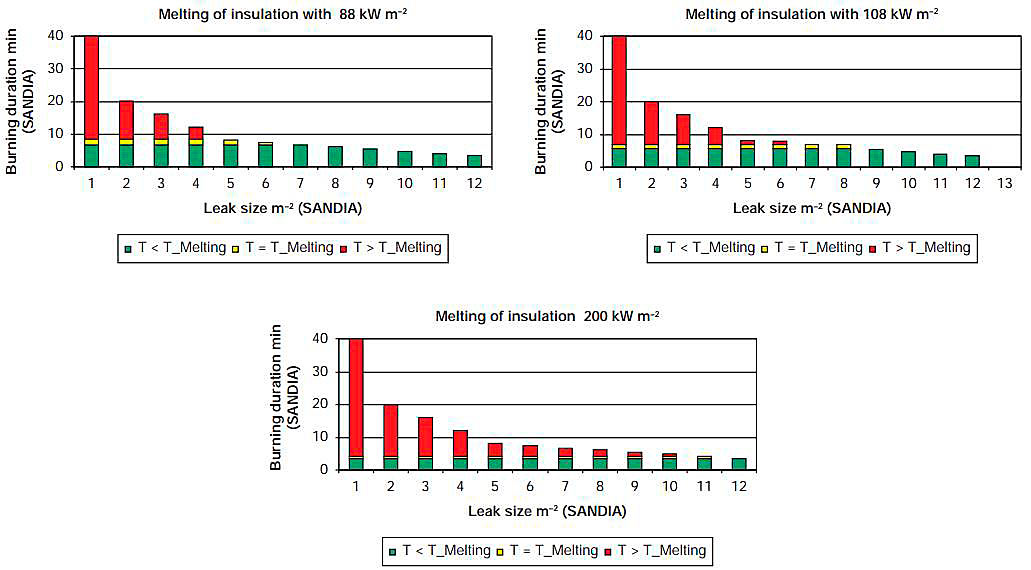
The green bar indicates the time required to reach the lower assumed melting temperature of 473 K. The yellow bar indicates the time needed to heat up the insulation from 473 to 573 K, which is the upper value of the melting range assumed. The red bar indicates the time which is available to destroy the insulation until the fire is out according SANDIA results, ie only for holes with a red bar will the insulation be effected.
The smallest fire, with 1 m2 equivalent hole, will last about 40 min. The largest, with 12 m2 equivalent hole, will last 3,4 min and the reference fire agreed in the WG with 5 m2 equivalent hole will last 8,2 min. No evaluation has been undertaken to determine which size will result in the ship being enveloped by the pool fire, but the CFD calculations assume an enveloping pool fire for even a 1 m2 hole. According to the Sandia report, a pool fire from a 1 m2 hole would have a diameter of 148 m, about half the length of the vessel.
Read also: Gas Operations for Ships Other than Liquefied Natural Gas
For the 5 m2 hole no melting starts for the 88 kW/m2 fire, 1,42 min are available for the 108 kW/m2 fire and 3,85 min are available for the 200 kW/m2 fire. There is no figure for the 300 kW/m2 assumed by Ref. 03 as the most severe case, but from Table 9.1 it can be concluded that the time available to destroy the insulation is 5,1 min (8,1 min fire duration minus 3 min to heat up to 573 K). According to Ref. 03, 153 mm of insulation may be destroyed, but it can be assumed that less insulation will be destroyed because the time to heat up the insulation to melting temperature has to be added (comp. above). If 17 additional minutes are added the 300 kW/m2 initial heat flux fire has to last 30 min to theoretically destroy all the insulation. This time is needed by 3 min to heat up to melting temperature, 10 min to melt the insulation according Ref. 03 and an additional 17 min, as a minimum, to heat up the insulation. This is the burning time for a hole of less than 2 m2 hole size according SANDIA.
Using 17 min to heat up the insulation and 10 min to melt the insulation leads to required burning times of:
- 31,25 min for 200 kW/m2;
- 34 min for 108 kW/m2;
- and 35,33 min for 88 kW/m2.
Therefore, according to the SANDIA report assumptions, it can be concluded that the insulation will not be completely destroyed by a fire resulting from the outflow from a 5 m2 hole because the theoretical time available for the fire duration must be 30 min or more. This limits the size of hole to a maximum of 2 m2 even for 300 kW/m2 initial heat flux. According to the Sandia report, a 2 m2 hole could lead to a pool with diameter up to approximately 209 m, in the order of 2/3 the length of the vessel. According to DOE/Sandia briefing to NARUC Staff Subcommittee on Gas July 15, 2007 Ref. 08, «large fires», (D > 100 m) generally break up into «mass fires», characterized by low L/D ratios (< 0.5)′′. Therefore it is unlikely that such a hole will create an enveloping fire with a heat flux of 300 kW/m2 at an elevation above that of the tank.
Heating up of weather cover and leak size
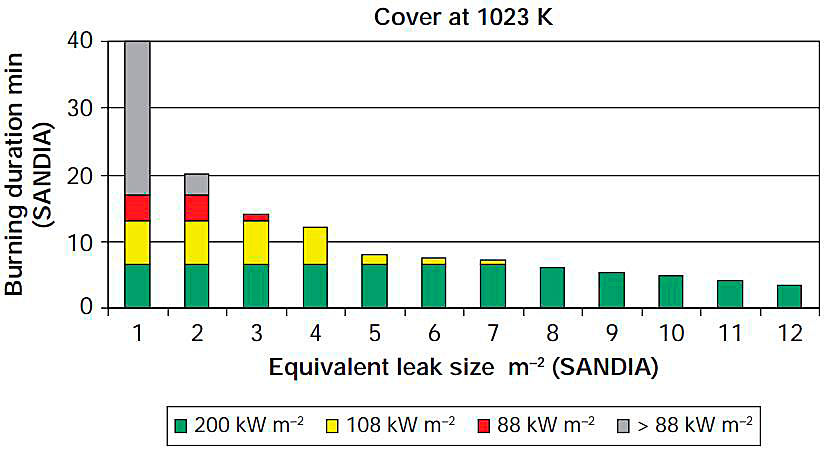
The same evaluation used for the melting of the insulation can also be used for the weather cover that is protecting the insulation. Fig. 10 relates the temperature from which the weather cover starts to become damaged to the leak sizes and fire durations given by SANDIA report.
The green bar indicates the time needed for a 200 kW/m2 fire to reach 1 023 K (6,51 min). The yellow bar indicates the additional time (6,59 min) needed if the fire is 108 kW/m2 (6,51 min + 6,59 = 13,1 min). The red bar indicates the additional 3,5 min needed to reach the 1 023 K for a fire with initial heat flux of 88 kW/m2 (6,51 + 6,59 + 3,5 = 16,6 min). The grey bar indicates the remaining time until the fire is off according SANDIA report. The 300 kW/m2 case can again be included by using the figures from Table 1 (4,16 min to reach 1 023 K).
The time available to heat the weather cover above 1 023 K for a fire caused by a 5 m2 hole is about 4,03 min for a 300 kW/m2 initial heat flux and only 1,59 min for a 200 kW/m2 initial heat flux. Lower heat fluxes will not be able to heat up the weather cover to 1 023 K in case of a 5 m2 hole because the fire is out before this temperature is reached. In other words: the more realistic cases of 88 and 108 kW/m2 will not be able to heat up the weather cover to a temperature where the uppermost part of the cover may start to show local deformation, Fig. 11, if a 5 m2 or greater leak in the damaged tank is assumed.
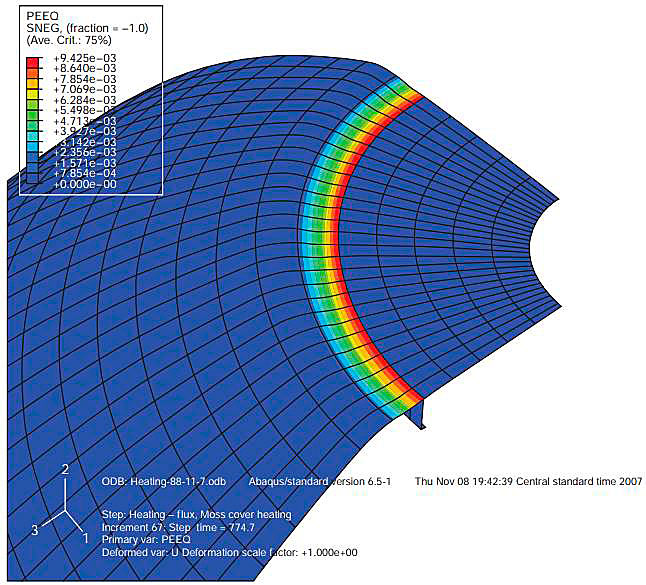
Fig. 11 predicted local deformation at the attachment of the upper hemispherical part of tank cover to ring girder and top plate from ABS Buckling Analysis.
With 108 kW/m2 the maximum hole size, which will lead to a temperature of approx 1 023 K at the weather cover, is 3 m3. For 88 kW/m2 the hole size is even smaller.
It should be noted and repeated from above that the maximum flame temperature related to the 300 kW/m2 case is approx. 1 500 K. It can be assumed that the weather cover will keep its function to protect the insulation even if parts of the cover are reaching the temperature corresponding to this heat flux.
Temperature in Skirt Area
The skirt is protected by ballast tanks. In the calculation the ballast tanks have been assumed to be empty which would be the case in a fully laden vessel. As can be seen from Fig. 12 the skirt area does not reach high temperatures.
All calculations indicate that the skirt area will not be heated to critical temperatures for structural integrity. Failure of the support structure can be excluded from further consideration, even for very high heat fluxes into the cover (300 kW/m2).
Conclusions
1 The maximum value of a realistic fire scenario is regarded to be 108 kW/m2. Evaluating higher values up to 300 kW/m2 has only been done for sake of completeness since these values had been raised during deliberations at WG meetings. (comp. Sec 9.1).
2 The maximum possible emissive power of a LNG fire reaches the maximum value (eg 300 kW/m2) only initially and decreases with receiving wall temperature increase (comp. Sec. 9.2).
3 If a complete loss of insulation is assumed the theoretical maximum temperature of the weather cover is limited to 1 000 °C with 300 kW/m2 initial heat flux and to 700 °C with 108 kW/m2 initial heat flux. At the same time the heat flux into the bare tank would be limited to 150 kW/m2 and to 60 kW/m2 respectively (comp. Sec. 9.2).
4 Film boiling will not occur even under extreme theoretical assumptions. Therefore overheating of the wetted surface area of the tank, and the possibility of tank collapse for this reason, can be excluded from further consideration (Sec. 9.2).
5 There is no possibility of a large scale burning of insulation material due to the lack of oxygen. The amount of air in the hold space only allows burning of a volume of insulation equal to the top 5 mm (p.19) (comp. Sec 9.3).
6 Large explosion events that could damage the weather cover to the extent that it would no longer be effective at providing heat shielding to at least most portions of the tank can be excluded from further consideration (comp Sec. 9.3).
7 Depending on the assumed heat flux, the minimum time to heat up the weather cover to temperatures where first deformation is predicted is 1 013 to 250 s (approx 17 min to 4 min) (comp. Sec. 9.5).
8 Depending on the assumed heat flux, the minimum time to heat up the insulation surface to a temperature where damages by melting begins to occur is 500 to 180 s (approx. 8 to 3 min) (comp Sec.9.5).
9 The melting rate of 30 mm/min given in Ref. 03 only considers the energy of melting and does not consider the heating up of insulation material to melting conditions. A simple calculation based on the model also used by Ref. 03 demonstrates that the melting time will be more likely in the range of 17 to 29 min than the 10 min assumed in Ref. 03 (comp. calculation attached in Ref. 07.) (comp. Sec. 9.6).
10 Very little additional heat will go into the LNG until at least 80 % of the insulation is destroyed (about 24 cm). Pressure built up will therefore start only after this point is reached. (comp. Sec. 9.6) Even in the case of a fire with an initial heat flux of 300 kW/m2, this will be more than 25 min after fire initiation.
11 It can be concluded that the insulation will not be completely destroyed by a fire caused by a 5 m2 hole according SANDIA report assumptions. The theoretical time available for the fire must be 30 min or more. This limits the hole size to holes below 2 m2 even for 300 kW/m2 initial heat flux. It is considered unlikely that such a hole will create an enveloping fire (comp. Sec. 9.7).
12 The more realistic cases of fires with initial heat flux of 88 and 108 kW/m2 will not be able to heat up the weather cover to a temperature where the cover may sustain local deformation if a 5 m2 or greater leak in the damaged tank is assumed. The heat fluxes must be 200 kW/m2 or greater to have this effect. With 108 kW/m2, the maximum hole size which will lead to a temperature of approx 1 023 K at the weather cover is 3 m2. For 88 kW/m2 the hole size is even smaller (comp. Sec 9.7). It is not considered likely that such fires will be able to envelope the tank.
13 Failure of the support structure (skirt) can be excluded from further consideration even for very high heat fluxes into the cover (300 kW/m2) (comp. Sec 9.8).
14 The actual time dependent heat flux of an LNG fire is crucial for a complete understanding of the effect of fire on the containment system. While there is a high level of confidence in the analytical work that has been carried out in this review, this can only be determined by a pool fire test. The tests should determine:
- the actual heat flux of the LNG fire;
- the actual emissivity during the phases of the test;
- the melting rate, melting behaviour, and properties of melting insulation material.
One such test agenda was proposed to the WG and was regarded to be adequate to address these unknown factors. However, it was considered that conducting or overseeing such testing was beyond the scope of the WG.