International LNG trade continues to experience significant growth and diversification and has done so for the past decades. Such growth will require continued huge capital investments along the whole LNG supply chain and continue to be accompanied by an expanding spectrum of risks and opportunities for the industry.
Global LNG market growth
Figure 1 illustrates the growth in LNG trade from 1990 to 2011, extrapolated from 2012 to 2020. The trade has evolved from 55 MTPA (equivalent to 74 bcm of natural gas) in 1990 to 220 MTPA (298 bcm) in 2010 representing a compound annual growth rate (cagr) of 7.2%. A review of projects in 2012 in engineering, construction, and advanced stages of planning suggests that Environmental aspects in Liquefied Natural Gas productionLNG production could reach some 320 MTPA (w430 bcm) in 2015 and some 450 MTPA (w610 bcm) by 2020 assuming a cagr for the period of 7.5% and that global LNG demand keeps pace with new installed capacity. An independent review of projects in 2008 in engineering, construction, and planning suggested that production in 2015 could be 360 MTPA, assuming LNG trade is equivalent to 80% of new installed capacity (Collins, 2008).
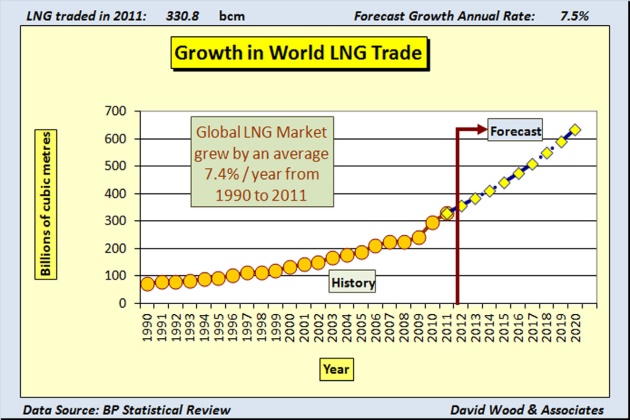
However, forecasts for future LNG trade are difficult to predict due to volatile regional LNG market conditions, competition from other sources of natural gas, emergence of new technologies, late development and start-up of some planned projects, and so on. In addition, global gas demand is inextricably linked to global economic growth and persistent economic downturns can slow demand and reduce utilization of installed supply chain capacities. However, because LNG offers a global commodity that can meet the growth in demand for natural gas forecast in many countries around the world many are confident that the LNG sector will continue to sustain growth at high average annual rates. The combination of secure energy supplies, higher natural gas prices, lower LNG production costs, rising gas import demand, with increasing demands for clean energy in the developed and developing world, and the desire of gas producers to monetize their gas reserves, are setting the stage for increased LNG trade in the years ahead.
Over the past few years many of the large oil and gas companies already involved in developing and operating longstanding LNG supply chains have taken large investment decisions to expand these facilities and have developed new projects for importing, shipping, and exporting LNG. New entrants, some much smaller companies with limited previous experience of the international gas trade, have also become aware of the benefits of LNG trade and are developing new projects, some in politically chal-lenging countries. In such cases the new-entrant operators are relying heavily on more experienced LNG engineering, Arrangement of the gas carrier shipsconstruction companies, service providers, and critical-path item suppliers to ensure the safety, engineering integrity, and ultimate efficient performance of these installations. A trend toward increased competitiveness has been an increase in the economies of scale; from expansion of existing LNG receiving facilities to construction of larger liquefaction trains and ships. This trend has also led to the development of new technologies such as floating regasification, gas ports, and LNG FPSOs, which have emerged and continue to evolve and take some important niche market positions around the world.
Higher materials and service costs and skilled manpower shortages in the LNG industry, due to the high demand of upstream and downstream oil, gas, and petrochemical plants since 2004, however have reversed the trend of lower unit costs for LNG facilities developed from 1990 to 2005. However, because of higher gas demand and persisting high gas prices in Europe and Asia, higher unit costs have slowed but far from extinguished the growth of LNG industry capacity in the period from 2006 to 2012. Contracts being signed for future supplies suggest sustained growth of LNG capacity in the medium and long-term, particularly in Asia and Europe.
The impact of shale gas in North America has depressed natural gas prices there since 2008 to the extent that imported LNG is only competitive on a small scale during seasonal peaks in demand. Indeed projects to build liquefaction plants to export LNG from Western Canada and the United States are now at an advanced stage of planning. Rapid deployment of shale gas technologies to other continents outside North America seems unlikely, due to the proprietary technologies and associated technical risks, in addition to the large number of wells required and regulators’ reservations about the environmental sustainability of large-volume hydraulic fracture stimulation on water supplies (e.g., an outright ban on hydraulic fracturing introduced in France and several other countries tightening regulations). Nevertheless shale gas projects are seen as likely to impact some markets (e.g., China, India, South Africa, parts of Europe, and South America) without displacing significantly the continued growth in LNG imports. Contrary to this view, it should be appreciated that some analysts are forecasting a more significant impact on LNG trade in coming years from unconventional gas.
Suggested reading: Environmental aspects in Liquefied Natural Gas production
Over the past few years, greater competition, economies of scale, and market liquidity have increased the importance of controlling LNG infrastructure to improve margins at every point across the value chain. Companies, such as BG, BP, GdFSuez, Petronas, QP, Shell, Statoil, and Total recognized that access to markets through trading LNG, and their ability to control infrastructure in each part of the LNG value chain, would assist them in monetizing their gas reserves and provide them with the flexibility to switch cargo destinations to access the best LNG netbacks. Such LNG strategies have enabled these large companies to rapidly exploit evolving LNG trading opportunities in gas markets around the world, while their competitors have lacked the capability to do so. Other key players in LNG supply are following their lead (e.g., ExxonMobil, Gazprom, Chevron, ENI, Repsol), but some of them have a significant gap to breach or are regretting that they did not chose to do so much earlier.
LNG import markets
Table 1 and Figures 2 and 3 compare the status of the LNG imports in various countries and regional markets in 1996 and in 2011. These two snapshots in time highlight where the key developments in demand have occurred and just how rapidly the industry has grown in some countries.
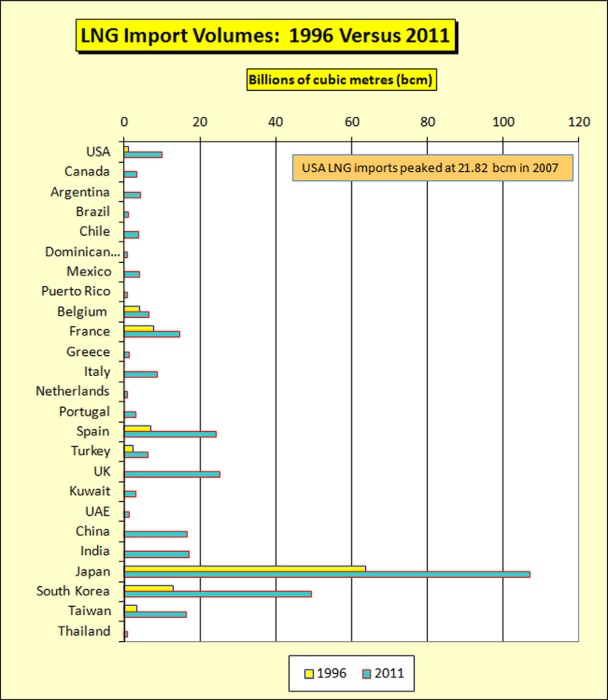
Table 1 shows how the trade has diversified and grown almost threefold during the period. In Europe, Spain and France established significant expansions of trade and the UK LNG demand evolved to become the highest in Europe in just a few recent years. In Asia, South Korea’s Offshore supply chain of Liquefied Natural GasLNG imports have grown more than threefold, whereas Japan has posted a respectable 68% growth during that period. It is through the emergence of China and India during the period that is signaling where much of the future growth is expected to come from. US LNG imports rose steadily to 21.82 bcm in 2007, but contracted to 10.01 bcm in 2011 due to shale gas competition and price collapse. Nonetheless in 2010 the United States still imported 10 times more LNG than it did in 1996. The LNG industry is not dead in North America, but is likely to play a more complex import-export role in the future.
| Table 1. LNG Imports by Country in 1996 and 2011 | ||
|---|---|---|
| LNG Imports (bcm) by Country | Year | |
| 1996 | 2011 | |
| United States | 1.2 | 10.01 |
| Canada | 3.30 | |
| Argentina | 4.38 | |
| Brazil | 1.05 | |
| Chile | 3.86 | |
| Dominican Republic | 0.91 | |
| Mexico | 4.05 | |
| Puerto Rico | 0.74 | |
| Belgium | 4.0 | 6.57 |
| France | 7.8 | 14.57 |
| Greece | 1.29 | |
| Italy | 8.75 | |
| Netherlands | 0.78 | |
| Portugal | 3.01 | |
| Spain | 6.9 | 24.16 |
| Turkey | 2.3 | 6.23 |
| United Kingdom | 25.31 | |
| Kuwait | 3.18 | |
| United Arab Emirates | 1.43 | |
| China | 16.62 | |
| India | 17.10 | |
| Japan | 63.8 | 106.95 |
| South Korea | 13.0 | 49.31 |
| Taiwan | 3.4 | 16.31 |
| Thailand | 0.98 | |
| Global | 102.4 | 330.9 |
| Data comes from BP statistical reviews and the color code separates Atlantic, Middle East, and Pacific market regions (updated with 2011 actual data from original analysis of Wood, 2004, 2012). | ||
Table 1 displays the scale of expansion and diversification of the LNG industry during the 1996 to 2011 period. In addition to the large market shares dominated by the countries mentioned earlier, the emergence of a diverse Latin American import market is revealed, something that was not envisaged until just a few years ago. Indeed, Argentina, Chile, and Brazil are all developing LNG infrastructure to facilitate access to secure energy supplies and promote economic growth. The LNG industry has managed to circumvent access to the politically and geographically stranded gas resources of Bolivia.
The emergence of LNG markets in some of the European countries with low gas demand (e.g., Portugal and Greece) and Italy, together with expansions in the Turkish market (Figure 2) are likely to be followed over the next decade by new market entrants from Eastern Europe (e.g., Poland, Baltic States, and some Balkan nations). In addition the Netherlands, the only net gas exporter in the European Union, commissioned in 2011 its first https://sea-man.org/lng-regasification.htmlregasification terminal in Rotterdam. It is likely that Rotterdam will become an important northwest Europe gas trading hub with pipeline gas and LNG competing for access to the large German and UK markets under a range of term and spot contracts. Indexation of such trade to benchmark gas prices should provide further competition to pipeline gas from Norway and Russia indexed to oil and petroleum product prices.
New LNG facilities are planned for France (e.g., EdF plans a new plant at Dunkirk sanctioned in 2011). Stagnant macro-economic growth may slow LNG development in Europe. However, with North Sea gas in decline and EU environmental policies curtailing nuclear and coal power plant developments, even if energy demand remains flat in the region, the quantity of gas imports seems destined to increase significantly. The European drive to substitute fossil fuels and nuclear by intermittent renewable energies (mainly solar and wind) also requires back-up supplies, and natural gas provides the most efficient option to provide such back-up supplies.
The emergence of small LNG import markets in Kuwait and Dubai is testament to the versatility and flexibility of the industry, with short-term cargoes coming not from neighboring Qatar but from around the world (Wong and Fesharaki, 2010). More short-term spot markets such as these are destined to develop over the coming decade and will play an important role in market liquidity, diversity, and competition for spot LNG cargoes.
Figure 3 illustrates how the Atlantic markets for LNG have grown to take a larger share of the trade in 2011 than they did in 1996. The emergence of the small but significant niche Middle East LNG market is also illustrated. Whereas these regional markets were completely distinct and not really competing for Offshore supply chain of Liquefied Natural GasLNG supply in the 1990s, this has all changed over the interim period, particularly with rapid growth of Middle Eastern suppliers that can serve both Atlantic and Pacific markets. The use-fulness of the classification of LNG trading regions as “Atlantic” versus “Pacific” markets is likely to disappear over the coming decade as more and more LNG travels along diverse and lengthy supply chains around the world for long-term and short-term contracts.
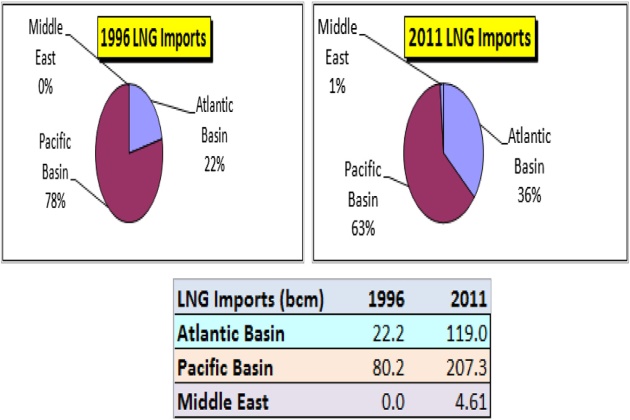
Table 2 lists the 26 countries that imported LNG in 2011 and a long list of countries that are considering or in some cases undertaking the construction of new regasification facilities. In fact the list of countries planning to develop LNG import infrastructure continues to get longer year by year as the industry further diversifies. Clearly it will take probably the best part of the next decade before many of the countries in the right-hand column of Table 2 actually establish operational LNG import supply chains. The Netherlands made this step in 2011 with the commissioning of its Gate LNG terminal in Rotterdam, opening up that location as a potentially important northern European gas trading hub.
| Table 2. Countries Importing LNG in 2012 or Planning to Import in the Future | |
|---|---|
| Countries Importing LNG | |
| Situation in August 2012 | |
| Current (26) | Planned/Possible |
| Argentina | Albania |
| Belgium | Aruba |
| Brazil | Bahamas |
| Canada | Bahrain |
| Chile | Bangladesh |
| China | Bulgaria |
| Dominican Republic | Croatia |
| Dubai | Cuba |
| France | Dominican Republic |
| Greece | El Salvador |
| India | Finland |
| Italy | Fujairah (UAE) |
| Japan | Germany |
| Kuwait | Indonesia |
| Mexico | Ireland |
| Netherlands | Jamaica |
| Portugal | Jordan |
| Puerto Rico | Kenya |
| South Korea | Lebanon |
| Spain | Lithuania |
| Sweden | Malaysia |
| Taiwan | New Zealand |
| Thailand | Pakistan |
| Turkey | Philippines |
| United Kingdom | Poland |
| United States | Singapore |
| South Africa | |
| Ukraine | |
| Uruguay | |
| Vietnam | |
| (Updated from original analysis of Wood, 2004, 2012) | |
There is a niche market for isolated island nations with limited overall energy demand, but limited to expensive distillate and fuel oil power generation facilities in the absence of LNG. These markets may import only two or three cargoes per year and in some cases their demand will be seasonal. Such markets individually are of little consequence to the overall LNG trade. However, collectively several island markets can be attractive, especially if they are located on or close to the main base load supply chain routes. In such cases it is possible to deliver partial spot cargoes at minimum incremental cost, or even backhaul cargoes with vessels that would otherwise be sailing back to their main loading ports essentially with just a small heel cargo to maintain the vessel’s tanks at cryogenic temperatures.
LNG export markets
Figure 4 summarizes LNG exports by country in 2011. The four largest LNG producersdQatar, Malaysia, Indonesia, and Australia, in that order by volumedaccounted for 58% of all LNG exports in 2010. In 2003 the top four exporting countries (Indonesia, Algeria, Malaysia, and Qatar, in that order) accounted for 63% of all LNG exports. This highlights the diversification of the LNG export markets and that some countries are increasing their share of it through massive capital investments (i.e., Qatar and Australia), while others are losing ground through much slower investment and expansion strategies, aging infrastructure, and depleting reserves supplying the older plants (i.e., Algeria, Indonesia, and UAE).
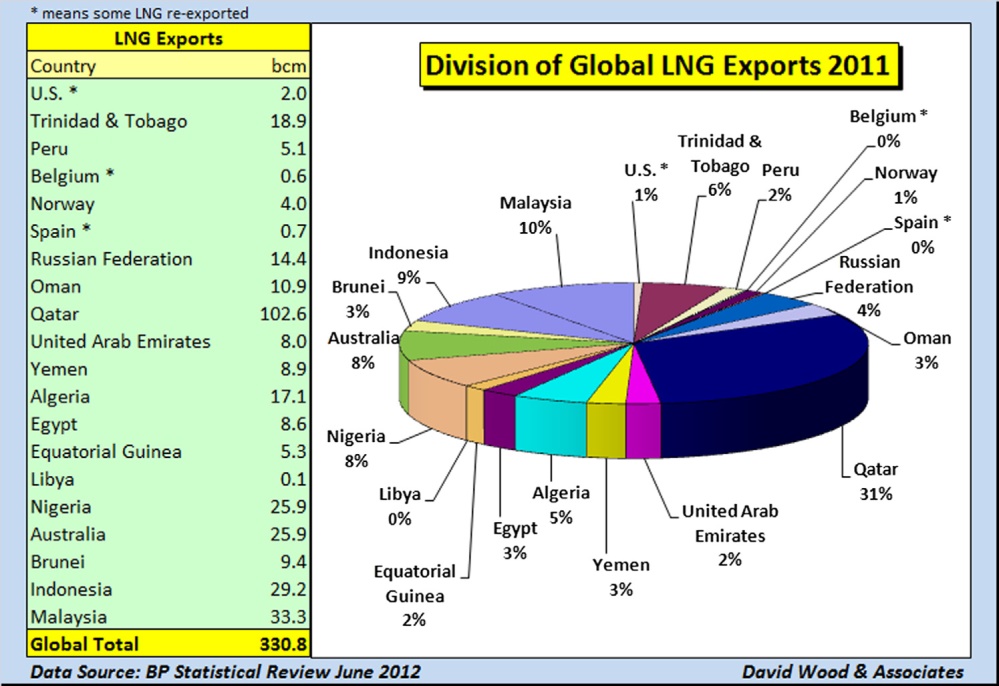
Hovering just below the top four exporting nations in 2011 were Nigeria and Trinidad; both expanded their capacity rapidly between 2000 and 2005 but subsequently their growth has been curtailed. In the case of Nigeria there are plenty of reserves but the problems include political unrest in the Niger Delta areas where the gas is located, unstable fiscal terms (i.e., the Nigerian government is seeking to increase its fiscal take and pay little for gas consumed domestically within Nigeria), and procurement constraints that inhibit import of specialist technology. This situation has resulted in several potential investors delaying commitments for several years on new plants. In the case of Trinidad the problem is both limited proven gas reserves inhibiting rapid expansion by building new liquefaction trains and the rapid and significant fall in demand for LNG in the United States, its main and geographically closest customer.
Read also: Gas Tanker Equipment and Instrumentation
Countries to watch for future potential LNG export growth, not among those already mentioned, include Russia (expensive, remote, but large arctic gas resources), Libya (depends upon pace of regeneration), and Egypt (depends upon pricing policy and fiscal incentives to investors).
Table 3 lists the 19 countries that are exporting LNG in 2012 and 14 countries that are considering or in some cases undertaking the construction of new liquefaction facilities. Angola was the most recent country to commission a new facility in 2012. Papua New Guinea has one project under construction led by Exxon Mobil. The United States has several Gulf of Mexico projects looking to liquefy and export shale gas as LNG from terminals built solely as receiving terminals. The Sabine Pass terminal made its final investment decision to build a liquefaction plant in August 2012 for commissioning in 2015/2016; others await the outcome of a US government review to approve further LNG export projects. Three liquefaction export projects planned to be located at Kitimat on the West Coast of Canada, one led by Shell with Asian gas buyers and another being planned by Apache. EOG and EnCana are also planning to export shale gas as LNG to Asian markets. The Kitimat projects involve a feed gas pipeline across the Rocky Mountains and in 2012 delays in regulatory and first nation approvals for that line are holding up investment decisions on these projects. Alaska is also now looking at possible LNG export projects from Valdez linked to a gas pipeline from the North Slope fields. High costs and fiscal uncertainties mean that LNG exports from Alaska are unlikely before 2020.
| Table 3. Countries Exporting LNG in 2012 or Planning to Export in the Future | |
|---|---|
| Countries Producing and Exporting LNG | |
| Situation in August 2012 | |
| Current (19) | Planned/Possible |
| Angola | Azerbaijan/Georgia |
| Abu Dhabi | Bolivia |
| Algeria | Brazil |
| Australia | Cameroon (GdFSuez) |
| Brunei | Canada (British Colombia) |
| Egypt | Cyprus |
| Equatorial Guinea | Iran |
| Indonesia | Iraq |
| Libya | Mozambique |
| Malaysia | Papua New Guinea |
| Nigeria | Tanzania |
| Norway | United States (Alaska, Gulf of Mexico, Oregon |
| Oman | Venezuela |
| Peru | |
| Russia | |
| Qatar | |
| Trinidad and Tobago | |
| United States (Alaska) | |
| Yemen | |
| Due to start-up delays the Angola LNG plant did not finally export its first LNG cargo until 2013 (updated from original analysis of Wood, 2004, 2012) | |
In conclusion the evolution of global and regional LNG trade over the past 20 years has been a story of rapid growth, diversification, and increased flexibility in LNG cargo movements. Asia continues to dominate global LNG trade, but the European LNG market has evolved significantly in the past decade and seems destined for sustained growth and diversification over the next decade or so. The promising expansion of LNG imports to the United States up to 2007 proved to be a false dawn due to indigenous shale gas production causing gas price collapse. However, North America is likely to play a more complex role in global LNG trade with some terminals both Ship/Shore Interface in Gas tradingimporting and exporting LNG depending upon market conditions. It remains to be seen how such terminals will compete with already established supply chains to Europe and Asia and how it will influence gas prices and price indexation in those markets.
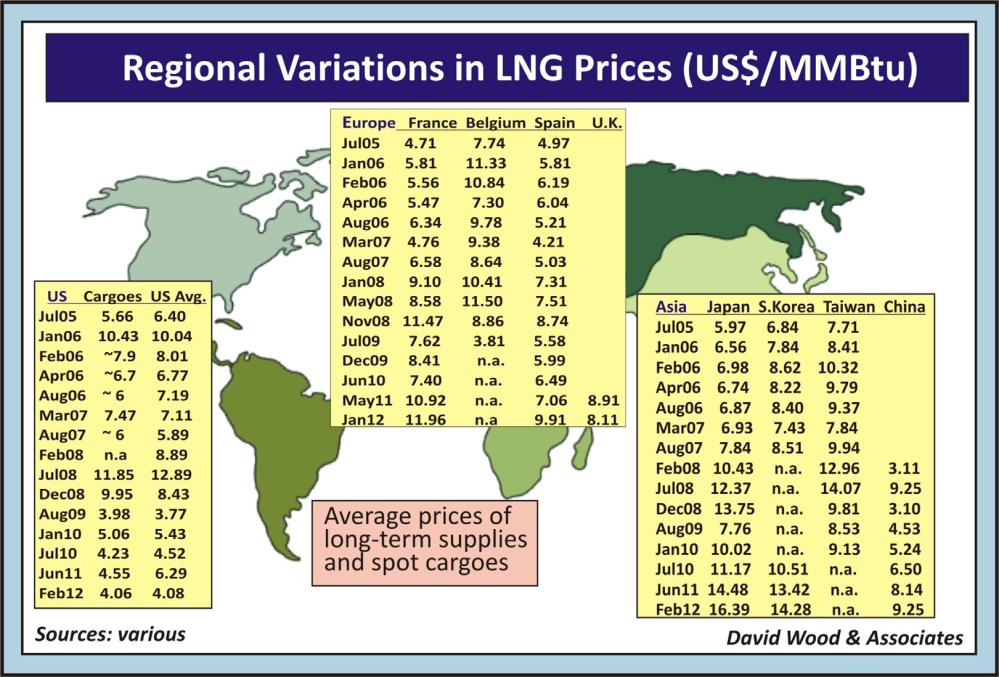
LNG prices diverge from the three regional markets
Asia continues to dominate global LNG trade (see Figures 2 and 3), but the European LNG market has evolved significantly in the past decade and seems destined for sustained growth and diversification over the next decade or so. The promising expansion of LNG imports to the United States up to 2007 proved to be a false dawn due to indigenous shale gas production causing gas price collapse. These three main markets have quite different LNG pricing mechanisms and Figure 5 highlights how gas prices have diverged from those three markets over the past few years. In 2012 the differences between LNG import prices in Asia, Europe, and the United States are the greatest they have ever been. It is these price differences that are driving the enthusiasm for new-build LNG export projects in the United States. It seems unlikely though that such price differences will last long.
North America is likely to play a more complex role in global LNG trade after 2015 with some terminals both importing and exporting LNG depending upon market conditions. It remains to be seen how such terminals will compete with already established supply chains to Europe and Asia and how it will influence gas prices and price indexation in those markets. Many gas consumers in those regions are expecting, over the course of the next decade, continued diversification of LNG supply from new sources (e.g., North America, East Africa, and East Mediterranean) to improve security of supply and bring down the delivered price of into their respective markets.