LNG projects are inherently capital-intensive, with the liquefaction plant accounting for up to 50 % of total project cost. Table 1 summarizes the cost components of delivered LNG in 2003. As can be seen, the average cost for gas production from the reservoir to the LNG plant (including gas processing and associated pipelines) will vary between 0,5 and 1,0 $/MMBtu for most large conventional natural gas fields.
Costs and economic implications of LNG facilities
LNG overall project costs
The contribution of the liquefaction plant cost to the Offshore supply chain of Liquefied Natural Gascost of delivery of LNG ranges from 1,5 to 2,0 $/MMBtu. However, from 2003 to 2012 capital costs in the oil and gas sector have more than doubled due to cost inflation. Table 2 shows the approximate percentage cost distribution for the LNG supply chain, which remains representative in 2012.
The total cost to bring LNG to market in 2003 was in the range of around 2,80 to 4,60 $/MMBtu. In 2012 a more realistic range of costs to deliver LNG along its full supply chain from gas field to customer was in the range of $6/MMBtu to $9/MMBtu. This sets the base price under which LNG would not be produced and exported. What will ultimately set the price for LNG above the base price are supply and demand and the cost of competing fuels.
| Table 2. Approximate Cost Distribution of the LNG Plant | ||||||
|---|---|---|---|---|---|---|
| Percent of Total Cost | Gas Treatment | Liquefaction/Refrigeration/N2 Removal | Fractionation | Utilities and Offsites | LNG Storage and Loading | Total |
| Equipment | 4 | 14 | 1 | 10 | 1 | 30 |
| Bulk material | 3 | 7 | 1 | 5 | 4 | 20 |
| Construction | 4 | 6 | 2 | 8 | 15 | 35 |
| Miscellaneous | 1 | 5 | 1 | 4 | 4 | 15 |
| Total | 12 | 32 | 5 | 27 | 24 | 100 |
| (Kotzot, 2003) | ||||||
Accurate data on LNG plant costs are difficult to pinpoint since costs vary widely depending on location and whether a project is greenfield (i.e., built in a new location) or an expansion of an existing plant. Offshore supply chain of Liquefied Natural GasLNG transportation costs vary based on:
- the tanker’s operating and amortization costs;
- the size of the tanker;
- tanker availability;
- and the distance transported.
A typical contribution of the transportation cost to the cost of delivered LNG was about 0,5 $/MMBtu to 1,2 $/MMBtu in 2003, but by 2012 this had risen to a range of about 1,5 $/MMBtu to 3,2 $/MMBtu, reflecting in part longer supply chains and higher demand for LNG carriers.
The costs of building regasification or receiving terminals show wide variation and are very site-specific. The typical cost of the LNG terminal ranged from 0,3 $/MMBtu to 0,4 $/MMBtu in 2003, and the costs more than doubled by 2012. The allocation of different units in an LNG regasification terminal is shown in Table 3.
The most expensive items in an LNG receiving terminal are the LNG storage tanks, which can account for about one-third to one-half of the entire facility cost, depending on the type, local planning code regulatory requirements, and the number and size of tanks.
Liquefaction plant cost
The engineering, procurement, and construction (EPC) costs of liquefaction projects are typically quoted in dollars per metric ton of annual plant capacity ($/TPA) rather than in $/MMBtu. Phalen and Scotti (2008) provided unit cost data for liquefaction plants built between 1964 and 2005, which showed, in money of the day, costs rising from some 60 $/TPA in the late 1960s to a peak of some 400 $/TPA in the late 1980s (NWS plant train 1 and 2, Australia) and then falling to about 200 $/TPA by 2003. Oman and Trinidad (Jamieson et al., 1998) greenfield liquefaction plants were among the lowest in the late 1990s in terms of $/TPA (Yost and DiNapoli, 2003).
Using data from Poten & Partners, Phalen and Scotti (2008) indicated how capital costs for liquefaction plants started to increase from their 2003 low point, with some plants in the 2005 to 2007 period exceeding 300 $/TPA in 2005 dollars between 2005 and 2008. Rising cost trends were also noted during that period by many EPC contractors (e.g., Humphrey, 2008).
Poten & Partners (Hartnell, 2009), using additional data, extrapolated the liquefaction plant cost trend to 2012 suggesting that greenfield liquefaction plant costs were likely to rise steeply to some 1,000 $/TPA in 2009 dollars in 2012. That prediction did indeed materialize. At the beginning of 2012, based upon information available to the authors new liquefaction plants in the 4,0 to 4,5 MTPA capacity range, under construction and approaching completion (e.g., Angola LNG and Pluto Australia) were expected to be delivered in the range of 1,100 $/TPA and 1,600 $/TPA. Historically only the Snohvit LNG plant built by Statoil and partners in Norway (on-stream in 2007) and the Sakhalin II plant built by Shell and partners in Russia (on-stream in 2009) have exceeded 1200 $/TPA in 2009 dollars. Both projects were completed with significant budget overruns.
Suggested reading: Operating Requirements for Ships carrying liquefied gas
EPC contracts awarded for gas liquefaction plants in the past eight years were sanctioned with project budgets ranging from some 400 $/TPA to 1,200 $/TPA including projects from:
- Equatorial Guinea;
- Yemen;
- Peru;
- Angola;
- Nigeria;
- Algeria;
- and Australia.
In this period unprecedented materials price escalations, extreme market fluctuations, and competition for resources and skills led to the noted trend of increasing unit capital costs. Peru LNG (Bruce and Lopez-Piňon, 2009) and Equatorial Guinea LNG managed to be delivered at the low end of the unit capital cost trend, demonstrating that lump sum contracting and focused contracting strategies can be effective even during inflationary periods. Cost trends over the past decade suggest that greenfield liquefaction plants in the past decade cost between about 25 $/TPA and 40 $/TPA more than expansion projects (i.e., adding additional trains to an existing site). Adding an additional train to an existing liquefaction site is clearly cheaper and less risky than developing a greenfield site.
The full costs of building a new liquefaction plant (i.e., including gas field development, feed gas pipelines, and port facilities) in 2012 dollars are clearly much greater than the cost of the liquefaction train EPC costs described earlier.
Examples from company reports of full unit cost ranges for plants recently built, under construction, or in planning are:
- 1,500 to 2,000 $/TPA: Sabine Pass (US), East Africa, Kitimat (Canada);
- Over 2,000 to 2,500 $/TPA: PNG LNG, Queensland CSG-LNG projects (most of these CSG-LNG projects breached their capital budgets in 2012 / 2013);
- Over 2,500 to 3,000 $/TPA: Australia NWS projects (Gorgon, Browse), Tangguh Train 3 (Indonesia);
- Over 3,000 $/TPA: Australia NWS projects (Pluto, Wheatstone, Prelude, and Ichthys), Abadi (Indonesia), Shtokman and Yamal (Russia Arctic Coast).
Clearly, the problem with LNG supply is that the facility to produce LNG (i.e., the liquefaction plant) requires a lot of time and capital to build. In addition, a liquefaction plant is generally not built until there are enough proven reserves of natural gas established to feed into it. In general, for a base load liquefaction plant to be economical, it is necessary to have a large gas production stream (>500–600 MMscf/d) available for 20 to 30 years; this translates to a need for recoverable gas reserves on the order of 5 to 10 tcf to supply these long-haul LNG projects (Kellas, 2003).
Typically, for one million tons per year of LNG (47 Bcf per year) produced by a liquefaction plant for a 20-year period, about 1,5 tcf of natural gas reserves are required (Sen, 2002).
The large capital cost involved with each element of the LNG value chain imposes substantial financial demands on LNG businesses. Consequently this has limited participation in the industry primarily to large, well-financed corporations with experience in LNG handling. One way to minimize the substantial risks has been to obtain long-term supply contracts (20–25 years in duration), with a “take or pay” clause that obligates buyers to pay for gas at a certain price, even if the customer is unable to take delivery of the LNG.
Cost reduction
Significant reductions in LNG supply costs were experienced between 1999 and 2004, which promoted the involvement of smaller oil and gas companies to enter into operatorship of liquefaction projects (e.g., Marathon in Equatorial Guinea; Hunt in Peru). Note that LNG costs vary considerably in practice, largely as a function of capacity, particularly the number and size of individual trains in liquefaction plants and shipping distance.
Those cost reductions came largely from improved efficiency through design innovations, economies of scale through larger train sizes, and competition among manufacturers. Despite the fact that cost inflation has taken its toll on LNG supply chain costs as mentioned earlier, smaller companies are eager to join the liquefaction sector (e.g., Apache in one of the liquefaction projects proposed for Kitimat on Canada’s Pacific coast).
Further advances in LNG technology can be expected in liquefaction, regasification and shipping, which should lead to lower overall project costs in the future. Shipping cost reductions have been achieved in the past decade by increasing carrier size (e.g., Qatar’s Q-flex and Q-max vessels), where larger LNG carriers equipped with BOG reliquefaction capabilities are able to reduce unit transportation costs on long LNG supply routes. However, the main obstacle to very large LNG carriers across the industry is the capability of existing ports and jetties to receive the LNG tankers, as they were designed for smaller vessels.
Reducing storage tank costs, from a materials and construction perspective, has the potential to reduce the costs of Process of Liquefied Natural Gas regasificationLNG receiving terminals. Today’s onshore storage tanks are based upon the self-supporting tank technology, and the membrane technology can bring significant cost reductions. The perception of steadily falling costs for LNG projects has been dashed in the last several years. The main issues that have caused rising costs in the LNG industry are low availability of EPC contractors as result of extraordinary high levels of ongoing petroleum projects worldwide, high raw material prices as result of a surge in demand for raw materials, lack of skilled and experienced workforce in the LNG industry, and the project’s financial risks (Hashimoto, 2011).
Increasing LNG project costs are adding uncertainty to already complex LNG value-chain projects. Uncertainties in costs, coupled with the ever-present uncertainties of gas price and changes in regulation in supply and receiving countries, increase the investment risk and can delay investment decisions. Additional delays in the time to first gas for an LNG project can affect the value of the project negatively and may result in missing a competitive gas supply or demand window (Resley and Reinsvold, 2008).
LNG contracts and project development
As the LNG industry grows and diversifies more sophisticated supply chain structures and contractual interactions have developed in conjunction with the more flexible, short-term LNG trading arrangements that seem destined to expand in coming years. The multiple components of the Offshore supply chain of Liquefied Natural GasLNG supply chain (Figure 1) mean that robust contractual relationships between the parties operating and controlling infrastructure along that supply chain are essential for the trade to operate effectively. Cross-involvement of participants (Figure 1) from their traditional positions in the LNG supply chain became common during the 1990s in conjunction with new liquefaction projects (e.g., Qatar, Oman, Trinidad).
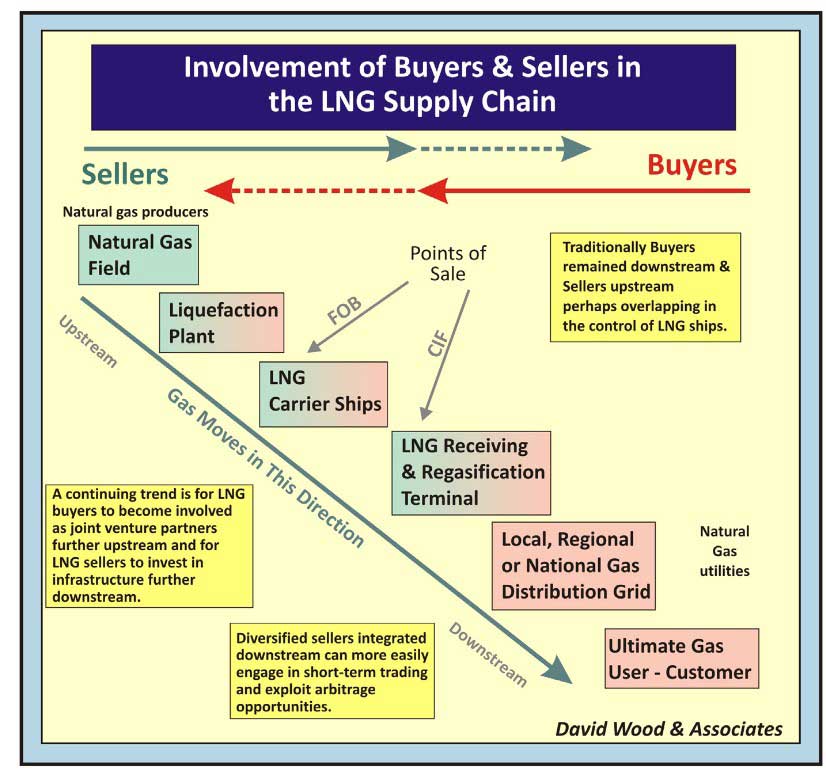
This trend expanded significantly in the past decade and seems likely to continue to do so (e.g., many Asian utilities and state-owned entities have taken positions in upstream liquefaction projects around the world, while many major oil and gas producing companies have taken positions in regasification, shipping, and gas distribution networks).
Evolution away from integrated LNG supply chains
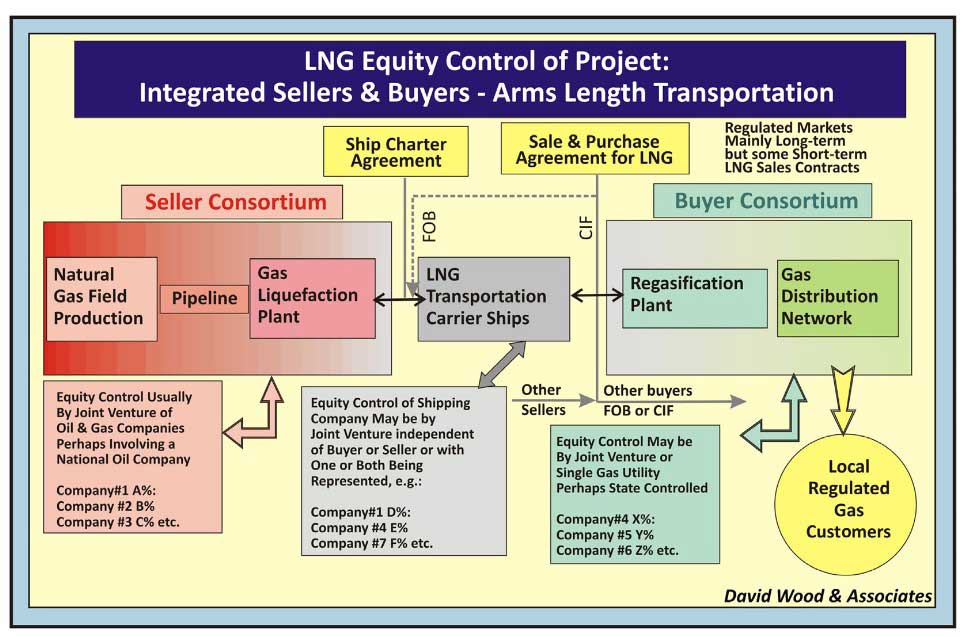
Some 20 years ago the traditional model for all LNG supply chains saw integrated upstream groups (gas production plus liquefaction plus shipping), consisting of major international oil and gas companies (IOCs) and state-owned national oil and gas companies (NOCs), selling LNG to integrated downstream groups, consisting of creditworthy state-controlled gas and/or electricity utilities (SGUs) primarily in Asia and Western Europe (Figure 2).
Moreover, the LNG sales contract was long-term (20 years or more), with CIF or DES (i.e., INCOTERMS abbreviations for cost insurance and freight or delivered ex-ship) delivery terms, involving rigid take-or-pay terms with prices indexed to oil price (i.e., Asian buyers) and/or liquid petroleum products and competing (i.e., European buyers), but including a floor price to protect investors in liquefaction plant construction from price collapse.

Sales contracts with at least two LNG buyer consortia were involved in providing diversified off-take security for each liquefaction plant. Such contractual arrangements suited both buyers (i.e., long-term security of supply at prices linked to main competing fuels) and sellers (i.e., guaranteed sales at or above a minimum price to underpin investment and guarantee a long-term, low-risk healthy return on investment). Contracts were relatively simple and projects relatively easy to finance and insure with limited credit risks for lenders, because of the take-or-pay terms, the floor price, and creditworthy buyers enjoying the benefits of monopoly gas markets.
During the 1990s partially nonintegrated General information and Rules for Ships carrying LNG and LPGLNG supply chains emerged with buyers involved in separate arms-length consortia operating the shipping and purchasing the LNG on an FOB (i.e., INCOTERMS abbreviations for free on board) basis at the liquefaction plant port (Figure 3). This provided long-term buyers, particularly Japan and South Korea, more flexibility in managing their LNG supplies. It also offered those buyer nations and their utilities opportunities to share more directly in the profitability of LNG shipping, expand their domination of LNG ship building, and increase their influence over long-term shipping charters associated with the major LNG supply chains. Equity interests in the arms-length shipping company usually involved participants from both upstream and downstream consortia.
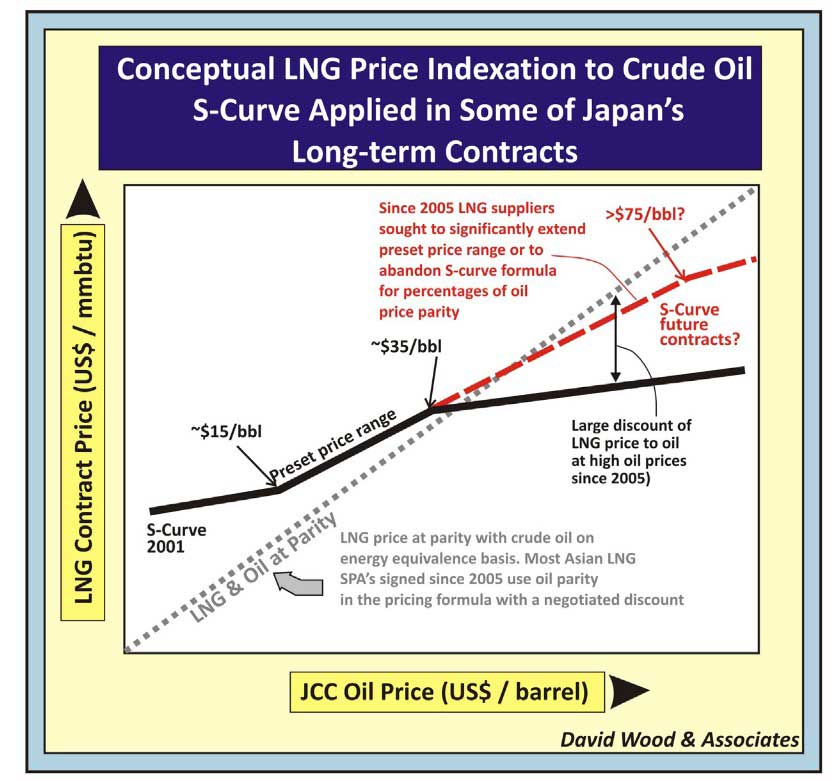
The LNG markets gradually evolved to include substantial amounts of FOB sales contracts as well as the more traditional CIF contracts. Sales terms otherwise remained similar with long-term take-or-pay arrangements. In Japan the Japanese Crude Cocktail (JCC) became the oil price benchmark for LNG (Figure 4). In some contracts floor prices were replaced by moderated crude pricing equations that softened LNG price increases in high oil price environments and LNG price decreases in low oil price environments, providing a more stable LNG contract pricing mechanism (e.g., the so-called S-curve pricing formulas secured by Japanese buyers in the 2000 to 2003 period). LNG delivered prices remained higher in Asia than in Europe due to more competitive gas supply and prices in Europe.
Tightness of LNG supplies to Asian markets at several periods since 2005 has resulted in an increase in short-term LNG cargo trades and redirections. This, and high oil prices, have provided LNG suppliers the upper hand in the Asian market LNG price negotiations in recent years.
This is quite different from the prevailing market situation in 2001to 2003when buyers had the advantage and it was possible to negotiate low prices with very limited price escalation (e.g., supply to the first two receiving terminals in China, involving supply from NWS Australia and Tangguh, Indonesia; initial supply to India from Qatar). Prevailing market conditions often determine what pricing formulas can be agreed upon at any given time. In contrast to the oil-indexed LNG pricing in Asia, in the liberalized gas markets of the United States and United Kingdom, LNG buyers struggle to guarantee delivery of fixed volumes to specific customers on a long-term basis.
Shorter-term contracts with flexible volumes at prices indexed to the regional gas benchmark prices (e.g., Henry Hub in the United States; NBP in the United Kingdom), not oil prices, and with no specified floor price are favored in those markets (Wood and Mokhatab, 2006a; Wood et al.,2008b). However, these fail to provide long-term offtake security for LNG suppliers as illustrated by the impact of sustained low Henry Hub gas prices on LNG imports to the United States since 2009.
Read also: Cargo Temperature Control and Cargo Vent Systems
Since the 1990s Japanese and South Korean LNG buyers have sought minority nonoperated equity interests in the development of upstream components of the LNG supply chain (i.e., liquefaction plants and gas fields). This has enhanced their security of LNG supply and also provided them with valuable knowledge of the complex technical and operational issues associated with LNG supply. IOCs also realized that there was potential to extract value along the supply chain by taking equity positions in LNG shipping and regasification to tie in with their gas trading businesses in emerging deregulated gas markets of Europe. Contractual initiatives and risk taking by IOCs will also be involved in FLNG developments (Wood and Mokhatab, 2006b).
Evolution of less-integrated LNG supply chains
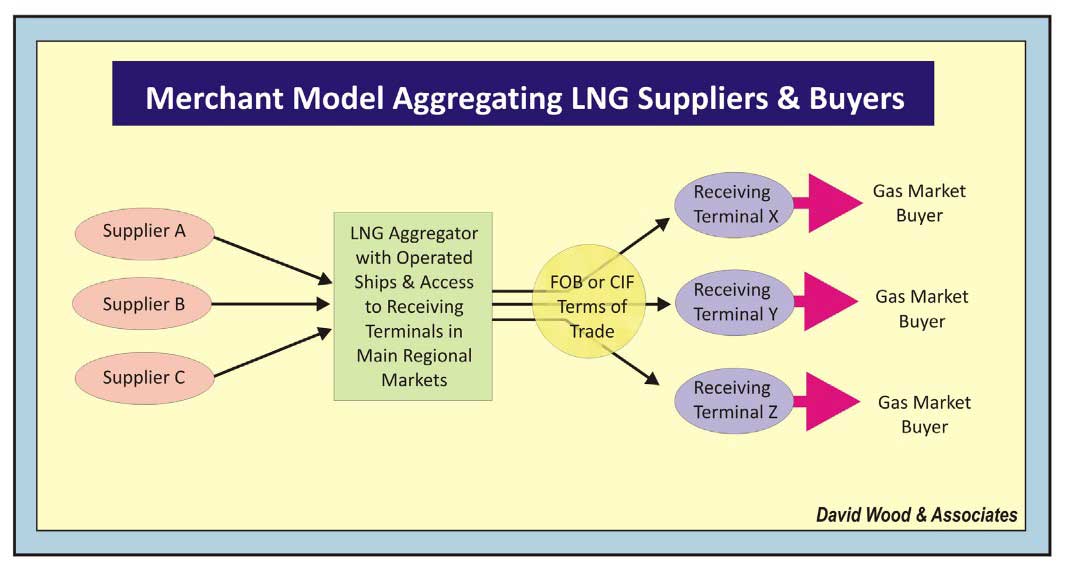
In certain LNG supply chains the components have become even more fragmented since the late 1990s. Liberalization, and in some cases full deregulation, of the downstream gas market sector, short-term contracts, swap sales, and introduction of more flexibility in the destination clause in many of the more recent sales contracts have introduced much more complexity to the LNG supply chains and the contracts governing them. The building of many new receiving terminals worldwide, commencing in Europe, has also resulted in both long-term and short-term LNG sales becoming more diversified. IOCs have exploited their competitive advantage acting as aggregators along the supply chains (Figure 5) and developing a merchant model.
By owning shipping capacity that is uncontracted to specific LNG supply chains and with access to LNG receiving terminals in many countries IOC have become effective LNG aggregators of being able to secure and deploy cargoes at short notice to exploit opportunities to Ship/Shore Interface in Gas tradingsupply LNG on short-term SPAs to different markets at different times. The merchant model also involves the aggregators purchasing some LNG on an uncontracted basis without a specified destination, with the aggregators taking the market risk from the LNG suppliers (Figures 5 and 6).
In certain upstream markets gas fields located in different licenses held by different joint venture groups have combined to fund the building of tolling liquefaction plants. In such cases the liquefaction plant and upstream gas fields supplying the liquefaction plants are not integrated in either ownership or operatorship (e.g., Liquefaction projects in Trinidad and Egypt).
In such arrangements it is now possible to have several upstream components to the LNG supply chain:
- Gas fields involving several equity groupings (often including the NGC) subject to different types of fiscal arrangements (e.g., negotiated production sharing agreements and tax–royalty licenses). Because governments take the major share of revenues under production sharing agreements (commonly 70-90 %) they are often keen to see LNG revenues flow all the way back to the gas field licensees rather than revert to the liquefaction plant that may benefit from tax holidays or uplifts that would limit the government take.
- Feed gas pipelines to liquefaction plants involving distinct equity holdings, tariff structures, and taxation terms.
- One or more liquefaction plants with several trains, each with distinct equity holdings established on a fixed rate of return construction basis, perhaps reverting to state ownership once payback is achieved, and charging each gas supplier a negotiated tariff for liquefying gas and loading LNG for export.
Similarly it is possible to have several components in the downstream LNG supply chain if open-access rules (i.e., often termed third-party access) are applied to the import and regasification terminal. Several different companies could contract portions of the capacity available in an LNG receiving terminal from its owners for specified periods at market rates. This would enable each of these capacity holders the ability to source LNG from different supply chains and deliver Process of Liquefied Natural Gas regasificationregasified gas to different buyers through capacity purchased in the transmission system.
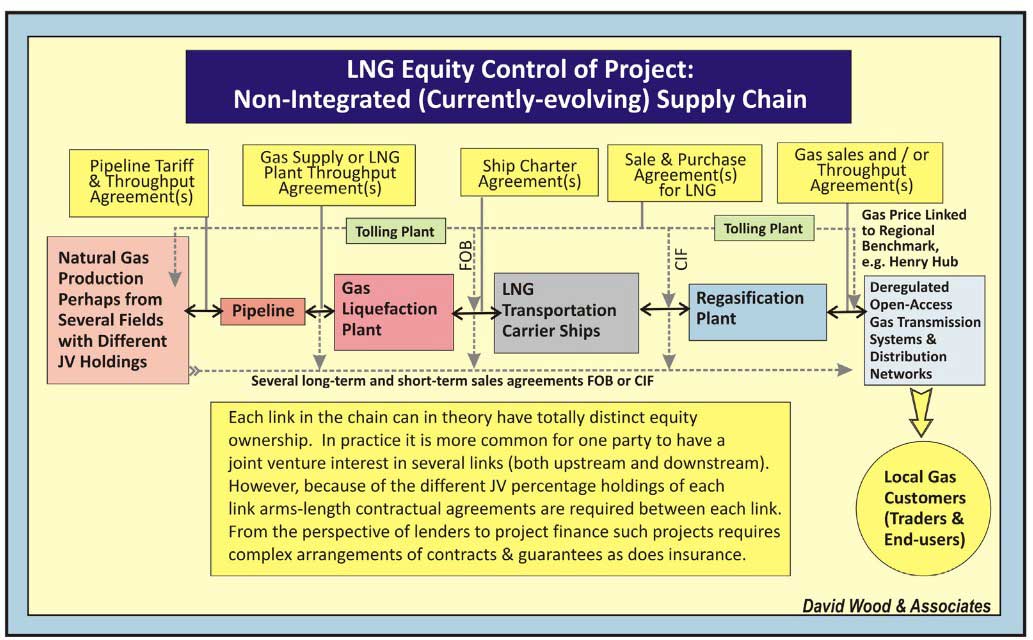
The import and regasification terminal also then operates essentially as a tolling plant charging each capacity holder a processing fee for receiving and regasifying its LNG (e.g., Grain LNG terminal in the United Kingdom with National Grid as operator and more than five LNG suppliers contracting long-term capacity in the plant through periodic auctions).
Issue of open-access to regasification terminals
Selling LNG into the deregulated and liberalized markets of North America and Western Europe has led to somewhat more restrictive contractual arrangements evolving at the downstream end of the LNG supply chain (Figure 7). Rather than move progressively toward this less-integrated supply model many LNG suppliers have secured exemptions from open-access rules providing them with competitive advantage in return for committing the capital investment to build or expand regasification terminals.

Some issues also revolve around open-access rules for the gas pipeline transmission systems and distribution networks, coupled with many exemptions to such open-access rules negotiated for new LNG regasification terminals. In December 2002 the US Federal Energy Regulatory Commission (FERC) ruled that the proposed LNG import terminal at Hackberry, Louisiana could be built without complying with the open-access requirements that previously had been strictly applied to all parts of the gas transmission chain as part of ensuring open competition in the deregulated gas market.
That’s interesting: Materials of construction LNG and LPG tanks
This “Hackberry Decision”, as it is known, encouraged proposals to build several new receiving terminals in the United States without developers being forced to offer capacity to third parties at “market” rates. Such open-access exemptions have proved critical in securing equity investment to build terminals in the United States and Europe by providing the shareholders in the regasification projects guarantees that they will maintain control over a large percentage or all of the LNG capacity of the plant for a substantial period of time, enabling them to realistically recover and benefit from their investment of risk capital.
Project finance of LNG facilities
Several recently constructed LNG supply chains have led the diversification of LNG supplier and buyer countries away from those traditional LNG buyers with high credit ratings (e.g., Argentina, Chile, China, India, Mexico, and Turkey). These LNG buyers pose financing and insurance challenges and concern for sellers over the long-term fiscal and contractual stability.
At the upstream end countries such as Nigeria, Egypt, Yemen, Equatorial Guinea, Peru, Russia, Trinidad, and Angola pose challenges for:
- financing;
- insurance;
- security of supply;
- and fiscal stability.
Concerns over lack of experience and best-practice standards have also raised concerns for some regarding operational reliability and safety for new-entrant countries to the LNG industry.
The ongoing diversification of the LNG markets has raised issues about LNG quality and specifically about NGL content with respect to lower calorific value and Wobbe Index limits on pipeline gas specifications in the United States and United Kingdom relative to Asia and most of Western Europe. LNG from liquefaction plants in Alaska, Algeria, and Trinidad has traditionally met these lower NGL content specifications.
On the other hand, LNG from most liquefaction plants in the Middle East, West Africa, and Asia has not met such specifications. LNG quality clauses are therefore key sections of LNG sale and purchase agreements. Quality issues may require investment from one party at some point along the supply chain to adjust the Fundamentals of Liquefied Natural Gascomposition of the LNG to match the market requirement. Adjustment usually involves either the removal of NGL or the dilution of the regasified LNG with an inert gas (usually nitrogen), or in some cases boosting calorific value by adding liquefied petroleum gas. This quality adjustment is most likely to be at the import terminals and conducted by LNG buyers. However, LNG quality specifications often influence the price that a buyer is prepared to pay for a specific LNG cargo, and that will be determined within the contractual framework.
Diversification, deintegration, and deregulation are adding complexity to the contractual frame-work of LNG supply chains on an ongoing basis. The large amounts of capital required at the upstream end of all LNG supply chains (i.e., gas field development and building new liquefaction plants) means that it is common practice for such projects, whether integrated or nonintegrated, to be financed largely with debt (e.g., debt: equity ratio 4:1 or 3:1) on a nonrecourse or, more typically, limited-recourse basis.
Building LNG infrastructure in developing countries, in order to secure adequate debt finance, frequently also involves guarantees and loans from export credit agencies (ECAs; Wood, 2008) as well as commercial bank loans and in some cases bonds (Figure 8). Such project finance layers another level of complexity into the contractual framework and introduces more rigorous requirements for the contracts to dovetail, guarantees, insurance, and such to provide security to lenders. The production sharing agreement or license terms under which the Government approves the plant remains the ultimate contractual driver.
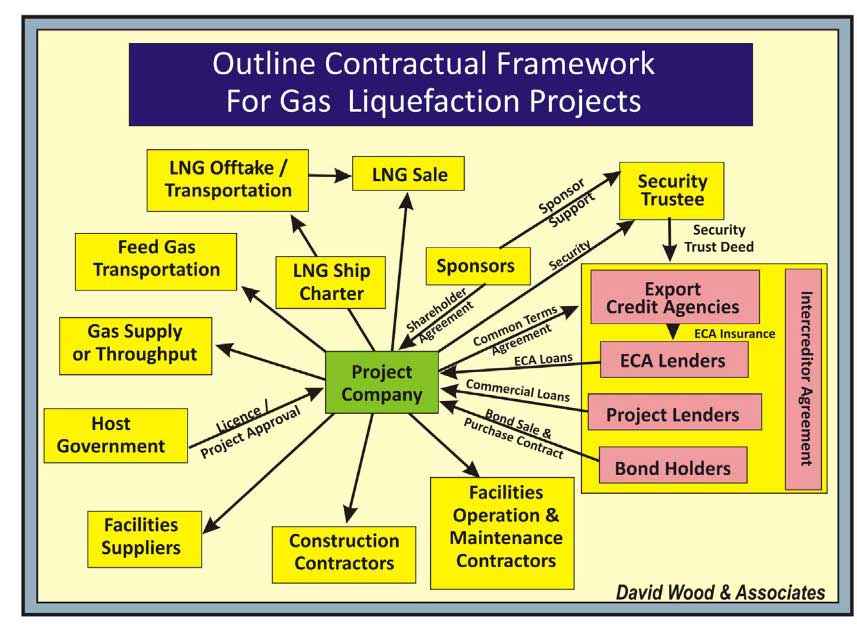
Because so much debt finance and high upstream taxation rates are involved in such projects the rules allowing deduction of interest paid on project debt from taxation liabilities can make significant impact on the overall profitability of a liquefaction project. The government approval of the credit agreements is therefore often an integral part of the project approval process.
The LNG industry has evolved and diversified quite dramatically on a global scale in recent years. Increasingly more countries supply and buy LNG for both peak-load and base load gas supplies. This has resulted in more complex contractual relationships and structures of some modern LNG supply chains. Less integration exists along several recently developed LNG supply chains. IOCs, NOCs, and utilities now participate at several points along a typical supply chain in order to extract more value, spread risk, and establish more security of offtake and/or supply. Although long-term supply contracts still underpin the supply chains, short-term trading opportunities continue to increase. Contractual complexity, increased diversification, and deintegration result in greater risks and opportunities (Wood, 2005b).
The Asian market for LNG continues to be the most important LNG market worldwide with significant demand growth forecast in China, Japan, Korea, and Taiwan over coming years (Wood and Mokhatab, 2011). The development of a Singapore LNG gas hub (due onstream in 2013) is also likely to change the dynamics of Asian short-term LNG market.
Cargo Tank Instrumentation on Gas TankersGas liquefaction projects linked to deep-water and/or distal offshore field developments and unconventional gas (e.g., coal bed methane in Queensland) in a number of Southeast Asia countries and Australia seem best placed geographically to meet a significant portion of the demand growth of this market over the next decade.
However, competition is emerging to supply this market from:
- Russia;
- the Middle East;
- East Africa;
- and North America (e.g., Kitimat and other liquefaction projects in Western Canada).
Contractual and pricing terms that for several years have favored LNG suppliers are likely to come under pressure as more competition and diversity of short-term supply develops.