One of the key issues for the design of membrane type (NO.96, Mark III and CS1) Liquid Natural Gas (LNG) ships is to predict sloshing induced “design loads” for insulation systems, especially when a design concept or type of operation deviates significantly from present experience. Examples are a large increase in ship size or operation in unrestricted partially filled conditions, which have not been previously envisaged.
- Introduction
- LNG Sloshing
- Slamming Effect – Induced Whipping on Global Loads
- Parametric Roll and Sloshing
- LNG Sloshing Phenomenon
- Design Load Assessment Procedure Based on Comparitive Approach
- Selection of Reference and Target Ships
- Wave Environment
- Operational Conditions
- Numerical Analysis to Select Critical Conditions for Model Tests
- Data Measurement
- Testing Duration
- Correction for Hydroelastic Effects Through Data Filtering Technique
- Statistical Post Processing
- Assessment of “Design Loads”
- Effect of Slamming Induced Whipping on Global Loads
- Sloshing and Parametric Roll
- Conclusions
- LNG Sloshing
- Effect of Slamming – Induced Whipping on Global Loads
Extensive experimental and theoretical studies have been carried out by MARINTEK and Lloyd’s Register to investigate sloshing impact loads inside prismatic membrane tanks. Different tank geometries have been used. In the tests, high sloshing pressures were measured and the temporal and spatial distributions of high peak pressure were predicted. Principally, a practical procedure for assessment of “design loads” for the membrane systems has been developed.
In addition to sloshing, increases in global loads due to bow and stern slamming can be another important factor to consider in large LNG ship design. Previous experimental studies indicate that the maximum midship bending moment can increase by 30-150 % as a result of slamming induced whipping. Slamming also induces large vertical accelerations at the bow and stern. Good design of the bow and stern geometry can provide effective reduction of slamming loads and whipping responses. This aspect is discussed.
The coupling of sloshing and ship motions may increase the likelihood of a large LNG ship experiencing parametric roll, especially when one or more cargo tank(s) is not fully filled (less than 90 % full) and the ship encounters a wave period close to both the natural period of tank sloshing and half of the natural roll period of the ship. The bow and stern geometries also influence the likelihood of experiencing parametric roll.
Introduction
LNG Sloshing
One of the most significant hazards for a membrane type LNG ship is that the containment system could be breached as a result of excessive tank sloshing loads. This can lead to hull failure (brittle fracture due to exposure to the extremely low temperature associated with LNG), with the possible consequential loss of life, cargo, and the ship, together with the associated legal, economic and environmental consequences. To safeguard against such an event, a design principle for the membrane system applied to date is to avoid violent sloshing rather than to withstand it. A barred filling range between 10 % of tank length as height and 80 % of tank height is therefore imposed. Since the 1960’s, ship sizes have gradually increased from a capacity of 60 000 m3 to 155 000 m3. The strength of the membrane systems has also been enhanced and as a result, a very good safety record has been established.
Trends in the world energy market show that the demand for natural gas is rising fast. The market for natural gas demands the transport of larger volumes of gas, and, paradoxically, the delivery of smaller parcels to more locations. This sets two challenges to the industry:
- To build large LNG ships with capacity of 200 000 m3 or more, a dramatic increase over the largest size of 155 000 m3 built so far, and;
- To operate LNG ships, including membrane designs, with the greater flexibility of loading provided by partial filling of cargo tankers.
Demand for large LNG ships is driven by demand for low unit transportation cost, while demand for the partial filling is driven by parcel trading which usually employs conventional sized ships with a capacity of no more than 155 000 m3. In addition, offshore loading and off-loading is becoming a preferred choice owing to increased concerns regarding safety. Offshore loading and offloading requires LNG ships to be capable of operation in unrestricted partially filled conditions.
MARINTEK and Lloyd’s Register started conducting comprehensive model test and theoretical studies in 2001. The goal was twofold, namely to improve understanding of the LNG sloshing phenomena, and to develop a practical procedure for the assessment of design loads for membrane systems.
Slamming Effect – Induced Whipping on Global Loads
Draft restriction in many ports means that the size increases of large LNG ships would, with LNG terminals, result in increased length and breadth. Limited draft and the need for large propulsion power may result in twin screw designs. These changes are likely to make the hull more flexible (a lower hull girder natural frequency), with a large flare at the bow and flatter bottom at the stern (higher slamming loads). In brief, the design changes make the hull more vulnerable to bow and stern slamming and consequently to the effects of induced whipping.
For a large ship with a large flare and flat stern, the slamming induced whipping could increase the vertical bending moment amidships by 30-150 % and result in large accelerations at the bow and stern. Good local geometry design in the bow and especially in the stern can effectively reduce slamming loads and, hence, the whipping response.
Parametric Roll and Sloshing
It is widely reported that large container ships with a small GM have experienced parametric roll, with amplitudes up to 40 degrees, in service. Parametric roll occurs in head seas when the wave encounter period is close to half the natural roll period. For a large LNG ship, if one or more tank(s) is partially filled with a filling height less than about 90 % of the tank height, the fluid motion inside a tank can make the ship more vulnerable to parametric roll when encountering a wave period close to both the natural period of tank sloshing and half the natural roll period. The bow and stern geometries, loading and operational conditions influence the likelihood of parametric roll developing. Efforts should be made to reduce the risk of parametric roll by attention during the design and the operation of large LNG ships.
LNG Sloshing Phenomenon
Assessment of full scale sloshing loads using model experiments is not straight forward. Understanding the physical properties of LNG and the corresponding sloshing phenomenon is of paramount importance. The fluid motion inside a LNG tank depends on the ship motions in waves. Hence, it is essential to find the correct wave conditions for critical ship motion prediction. Usually, linear ship motion programs can be used to predict ship motion responses and show good agreement with experiments. Since transient motions and maximum acceleration are important for the sloshing loads, the nonlinear effect of the ship motions should also be considered. To predict full scale design loads, one needs a correct scaling law. Parameters such as density, density ratio between liquid and gas, viscosity, ullage pressure, surface tension, compressibility of liquid and hydroelasticity, could be important in scaling the model test sloshing loads to full scale.
The type of impact can be totally different at high and low filling levels. At filling ratios of 40 % or above, the high pressure occurs near a corner on the tank roof and usually decays very fast. This phenomenon differs significantly from that at low filling levels. At a low filling level (20-30 %), high impact is likely to be on the tank side, affecting a large area and lasting longer. It results in a different risk level in terms of potential damage to the membrane system. Parameters such as rise time and the duration of impact loads on a given area are important in defining and determining a dynamic loading factor. To find the dynamic capability of an insulation box possible hydroelastic effects must be known in order to estimate an appropriate safety margin.
Use of Froude scaling to predict LNG sloshing loads inside a membrane tank may be questionable, since density ratio between liquid and gas, viscosity, ullage pressure, surface tension, compressibility of liquid and hydroelasticity may all affect the peak pressures. The characteristics of membrane insulation systems differ from those of steel, and LNG has, seemingly, very different properties from water. The latter is used in the model tests. However, we believe that Froude scaling is suitable for predicting the Dynamic Strength Analysis for Membrane Type LNG Containment System Due to Sloshing Impact Loadglobal sloshing loads and average impact pressure or impulse of an impact. One should be very careful in considering the effect of the pressure peaks. The pressure peak with maximum magnitude may not induce the maximum stress in the membrane system if it lasts considerably shorter than the natural period of the system. What is important is the impulse of the pressure peak for a loading duration that is a significant fraction of the natural period for the relevant failure mode of the structure. Based on this, a simplified method has been developed to account for hydroelastic effects. The details are given in Step 7 of Section 3.
One should use hydroelastic analysis (LNG/membrane) to resolve the significance of the total impulse for each pressure peak. The effects of ullage pressure as well as the density ratio between liquid and gas are reported to be important for determination of the maximum slamming pressures. The scale effects of viscosity, surface tension and compressibility of the gaseous and liquid phase can be investigated by a comparison between model test data with different scales. Since the scale effect may be important for determination of the impulse of the pressure peak, one should choose the scale to be as large as possible.
In this study, comprehensive sloshing model tests were carried out to measure impact pressures. Linear time domain ship motion analysis was used to determine the worst motion responses of the ship in irregular waves under 20-year North Atlantic sea states, and also the motion responses around cargo natural periods at different filling ratios (20, 30, 50, 70, 80, 90 and 95 % of the tank height). A 140 500 m3 LNG ship with four cargo tanks was modelled. The ship motion analyses were carried out in head to beam seas at service speed for operational conditions and at 5 knots for survival conditions. CFD and ship motion response spectrum analyses were used to select 30 critical cases for the model test programme. The most exposed tank (No. 2) was modelled.
The physical tests were carried out for 30 critical combinations of loading condition, sea-state, tank filling, ship speed and wave heading for the 140 500 m3 ship. The wave headings varied from head seas (longitudinal), quartering (diagonal) to beam seas (transverse). Motions in 4 degrees of freedom, namely surge, sway, roll and pitch, were simulated in the model tests based on a representation of the ship motions in critical sea-states. 3 hours full-scale time was used for each test condition. The pressures are measured at 20 simultaneous positions where maximum impact pressures are expected to occur. The measurement area of the pressure sensors is 2×2 mm. In addition, six force panels with a full-scale size about 1×1 m were used to measure the average pressures on a panel.
At high filling levels, high pressures are measured in the experiment, especially in the head seas. High pressure impacts usually occur near the corners of the tank roof. At low filling levels the most critical wave direction is beam seas. The high pressure impacts usually occur on the tank sides or at the lower part of the upper sloping panels.
Design Load Assessment Procedure Based on Comparitive Approach
The aim of the study is to determine “design loads” for the membrane system that are representative and conservative. From the above discussion, it is clear that determination of the absolute design loads is an extremely complicated process. It requires the determination of:
- sloshing load and its associated impact duration and area,
- resistance capability of the membrane system under the corresponding dynamic loads, and,
- adequate safety margin.
This study and all other studies reported so far concentrate only on the sloshing load assessment. Without detailed knowledge of the dynamic resistance capability of the membrane systems, it is difficult to determine correctly the “design loads” or safety margin based on the absolute approach.
The industry is now working on the resistance and safety margin issues. However, it requires considerable time and effort before any conclusions can be reached. To provide a safe and reliable solution to the problem within the time frame required by our clients, Lloyd’s Register and MARINTEK have developed a practical procedure based on a comparative approach. The basic concept is to compare sloshing loads of a large LNG ship or LNG ships in a defined partially filled condition with that of a conventional design under the currently approved filling restrictions. The aim is to assess the relative load increase, rather than the absolute loads in the specified conditions.
Read also:Det Norske Veritas Fatigue Analysis of Natural Gas Carriers
The fundamental assumption of the comparative approach is that the current membrane systems are safe in conventionally sized LNG ships operating under the restrictions of the currently approved barred filling range. This assumption is supported by the safe operational record of the LNG fleet in service.
The comparative approach reported here is based on the model test results. The procedure includes the following key steps.
Selection of Reference and Target Ships
A conventionally sized LNG ship is modelled as the reference ship to set reference loads for comparison. In this study, a 140 500 m3 LNG ship with four cargo tanks was selected. To assess sloshing loads in large LNG ships, a large ship is to be modelled as the target ship. The two models should be to same or similar scale. To study a conventional LNG ship in Coupling Between Liquefied Gas and Vessel’s Motion for Partially Filled Tanks Effect on Seakeepingpartially filled conditions, the second model may not be required. The model scale should be not less than 1:70. The numerical analyses carried out prior to the model tests in this study showed that No. 2 tank is most vulnerable to sloshing damage. Hence, only the No. 2 tank was modelled.
Wave Environment
The North Atlantic wave data as defined by IACS Rec. 34 is to be used as a basis for assessing sloshing loads for a ship in unrestricted service.
However, partially filled operation is often required only in specified or restricted areas. In such cases the wave data for the specified areas is to be used. The data must contain sufficient wave records for derivation of the wave envelopes, which represent the worst wave conditions for a given return period such as 1, 20 or 40 years, as mentioned in step 3.
Operational Conditions
Good seamanship is a basic requirement for ship operation and the requirements for class assume ships are operating in accordance with good seamanship. The procedure assumes that a master will voluntarily reduce speed and face head or near head seas when meeting a severe storm. The following operational speeds are assumed.
| Full service speed | when Hs ≤ 5 m |
| 2/3 of service speed | when 5 m ≤ Hs ≤ 10 m |
| 5 knots | when 10 m ≤ Hs ≤ 40-year wave height in North Atlantic |
Here, Hs is significant wave height. For the reference ship, a 20-year significant wave height is used.
In beam, stern and stern quartering seas the maximum sea state considered is limited to a 1-year significant wave height. This is because such cases are treated rare events following, for example, loss of power or steering capability. The combined probability of occurrence of such an event when encountering a 40-year storm is low.
The 1, 20 and 40-year wave envelopes in the North Atlantic are presented in Picture 1.

Numerical Analysis to Select Critical Conditions for Model Tests
Numerical analysis can be used to select critical wave conditions in order to reduce the number of model test cases required. The critical conditions are irregular waves with Hs/Tz selected on or below the corresponding wave envelopes, which induce maximum cargo impact velocities inside a cargo tank.
Two types of wave conditions should be considered.
- The wave conditions which induce the maximum ship motion responses is sway, roll, surge and pitch;
- The wave conditions with periods close to cargo natural periods in both longitudinal and transverse directions at the filling level under investigation.
Wave period variations of ±1 second in Tz were added to all critical waves selected from the numerical analyses in this study. This was to avoid missing the most critical cases. The study found that the second type of wave condition is often the most critical. The coupling effect between cargo sloshing and ship motion is to be considered by numerical simulation. The time histories of the ship motion response predicted from the numerical analyses are used as motion inputs to the model tests.
Although most tests are carried out in irregular waves, limited regular wave conditions should also be tested to investigate the effect of swells.
Data Measurement
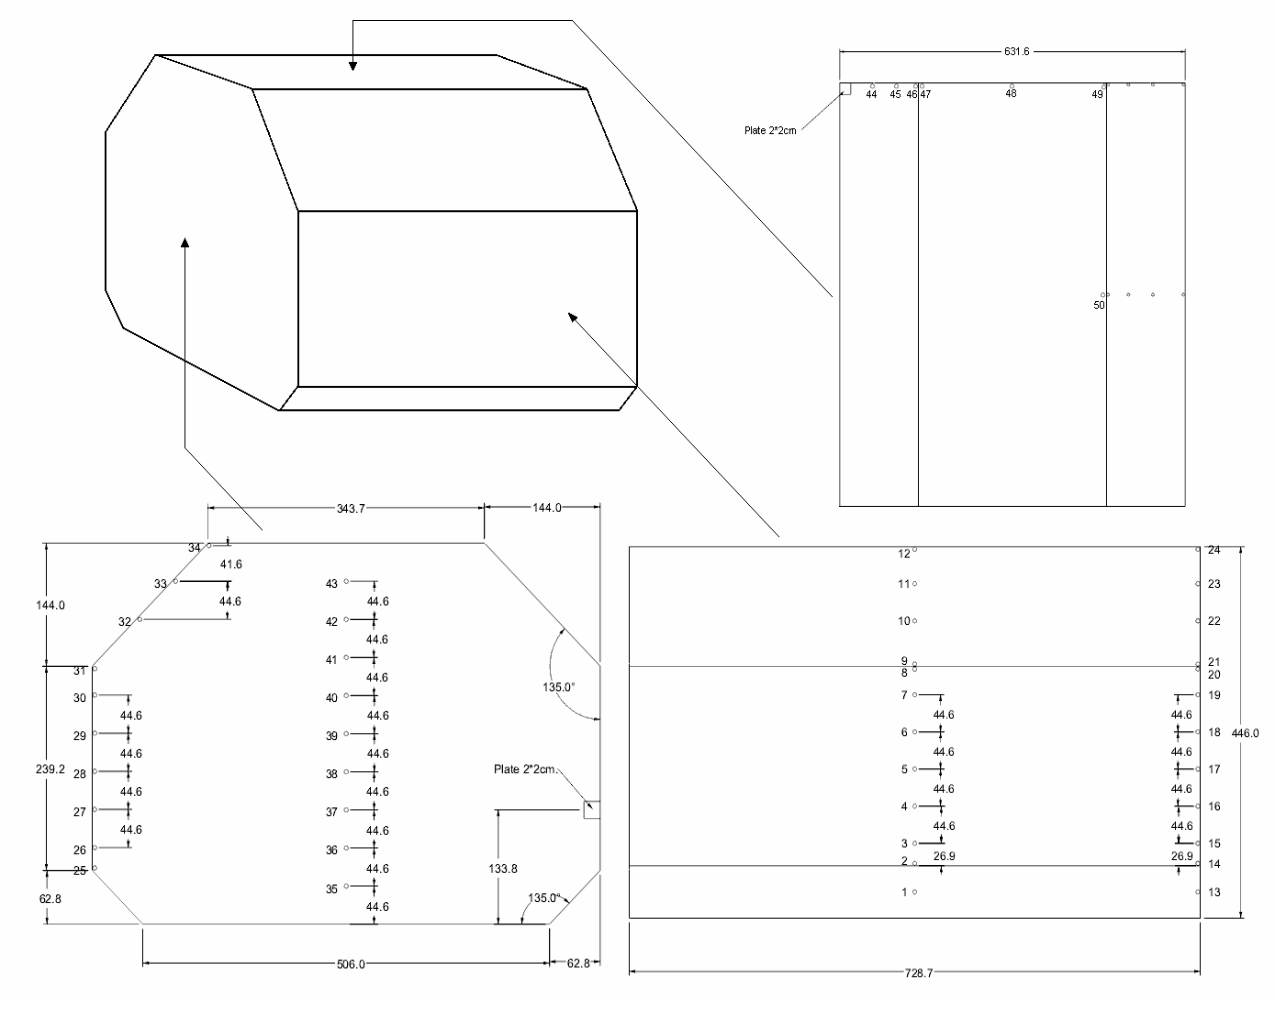
Sufficient pressure gauges are to be fitted to all critical locations in the models. Picture 2 shows the pressure gauge arrangement for the reference ship of the present study. The measurement surface of the pressure gauges should have an area similar to that of the insulation boxes but at the appropriate scaled dimensions. The sampling frequency should not be less than 10 kHz in model scale.
Testing Duration
To obtain sufficient measurements for determining impact loads, the testing duration in irregular waves should not be less than 3 hours in full scale. For most critical cases, in which the maximum impact loads are measured for each wave direction and filling level, one or more repeat tests should be performed using a different tank motion realization, to ensure that the total test duration in irregular waves is no less than 9 hours in full scale.
Correction for Hydroelastic Effects Through Data Filtering Technique
Individual peaks of the sloshing induced pressures are not considered to result in high stress levels in the membrane systems. What is important is the total impulse of the impact. Picture 3 illustrates a typical time history of a sloshing induced impact.
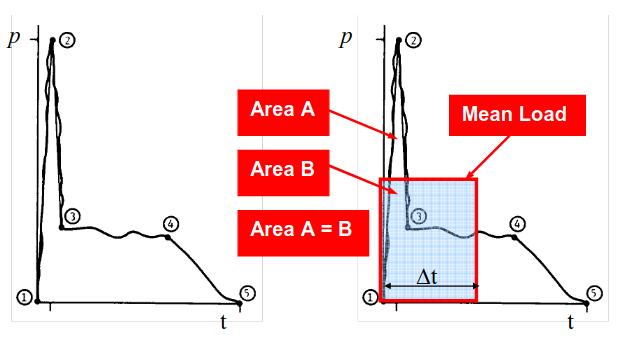
The initial pressure rises from point 1 to 2 typically in 1 to 5 ms in full scale. This duration could be shorter than the natural period of the membrane system and is unlikely to cause significant stress in the structure because of the interaction between the fluid and the structural response.
The right-hand side of Picture 3 shows a simplified approach used in this study to account for the hydroelastic and dynamic effect. It is based on determination of the “mean pressure” over a short duration ∆t, instead of the peak value. The “mean pressure” represents the impulse of the impact over duration ∆t. To select a suitable duration, ∆t = Dt, Dt/2, Dt/4 and Dt/8 were used to filter all measured pressure signals. Here, Dt is estimated to be 0,25 of the first natural period of the membrane structure in LNG. All comparisons between the reference and target ships and the various operational conditions were carried out based on the pressures filtered at the same ∆t to ensure consistency. A more detailed explanation is given in step 9 below.
Statistical Post Processing
The measured maximum loads are random in nature. They should not be used directly as a basis for the comparative approach even though a data filtering process is applied. To achieve consistency, all comparisons should be made based on extreme loads having the same probability of exceedance, rather than the measured maxima. Hence, statistical post processing is necessary.
Two approaches can be used. One is to use a probability distribution fit, e. g. a Weibull fit, to predict the expected extreme loads over 3 hours based on the filtered signals. The loads at this probability level are used as the basis for the comparison.
The second approach is to use the mean of the top 3, or the mean of the top 10 percent, of the largest loads measured during a 3-hours test based on the filtered signals. This approach is simple and reasonably reliable when used with the comparative approach.
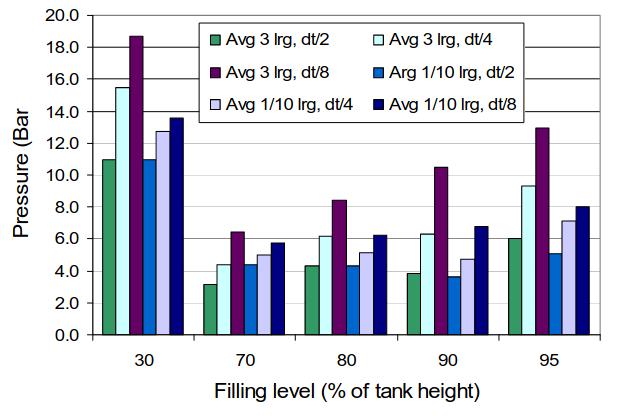
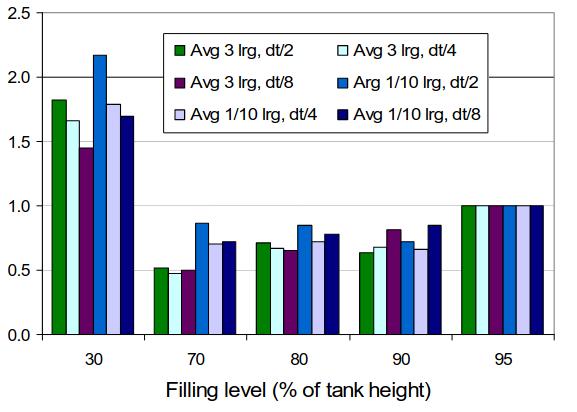
Some results of the present study based on the second statistic post processing approach are presented in Pictures 4 and 5.
Assessment of “Design Loads”
Picture 4 shows the maximum loads obtained at different filling levels in a conventional size LNG ship (140 500 m3) in the North Atlantic environment. As expected, the value of ∆t affects the amplitudes of the final loads. However, when comparisons are carried out on the basis of the same ∆t, as shown in Picture 5, the results, in terms of percentage load increase/decrease as compared to the loads at 95 % filling level, are reasonably consistent. Hence, the loads at 95 % filling were used as the reference load since these are the highest within the currently approved filling range.
A similar exercise was also carried out for a 200 000 m3 plus LNG ship with four cargo tanks. Approximate load increase ratios comparing the 140,500 m3 and 200 000 m3 plus LNG ships at different filling levels are presented in Picture 6. It is emphasised that this information is for illustration only and cannot be scaled for actual loads.
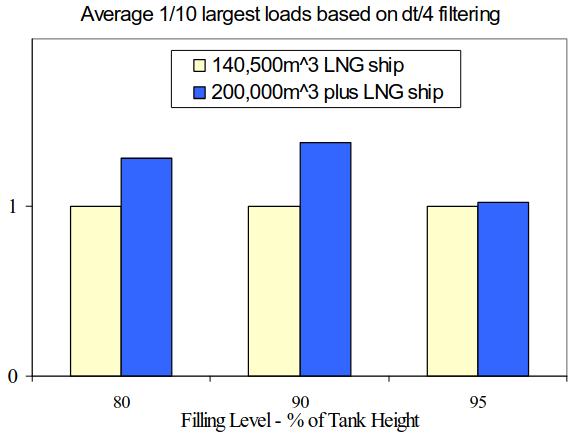
The results from the partial filling tests show that partial filling at 30 % level can induce travelling waves and increase sloshing loads by up to 50 % when compared to the maximum loads measured at 80 % filling or above. The impact area is also increased. The results also show that the sloshing load at 70% filling is no more severe than that at 80 % filling or above.
The test results for the large LNG ship show that the sloshing loads increase with dimension of the LNG tank.
Effect of Slamming Induced Whipping on Global Loads
Extensive research projects on impact loads and structure responses on large ships have been carried out both by MARINTEK and by Lloyd’s Register. The aim has been to investigate bow flare and stern slamming induced vibration and whipping responses on large ships. For LNG ships whipping could present a problem, especially when ship length and breadth are increased significantly for larger capacity ships, while the draught is retained due to port restrictions. The increase in length results in increase of the natural vibration period of the hull. The deadrise angle of the bow flare reduces as the ship size increases, since the draught remains essentially unchanged. All these factors tend to increase the slamming loads and the slamming-induced whipping response.
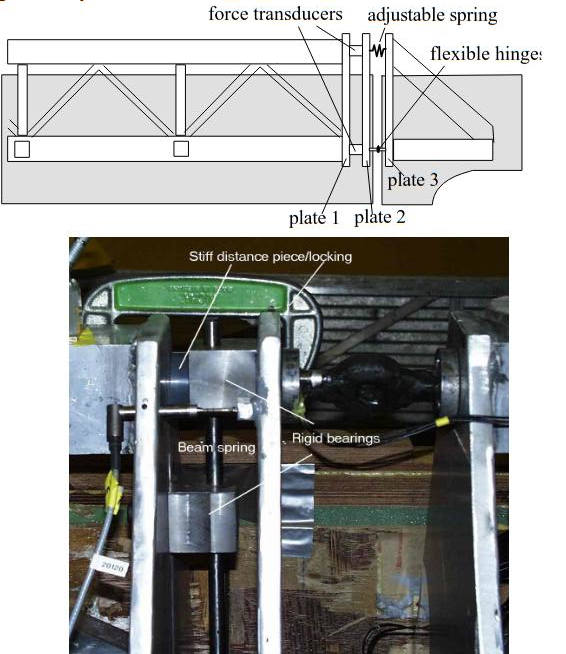
Experimental methods have been developed at MARINTEK for predicting slamming-induced whipping responses of large ships. A four-segment model was used to predict whipping responses and slamming loads on large ships. The model consists of a hull model made in a stiff foam (Divinycell) reinforced by wooden plates. The hull model was equipped with a rigid aluminium structure framework along the main part of the ship length. The framework was used to ensure that the segments in the model were as stiff in bending as practically possible. In the connection between segments, the end of the framework was welded to a 20 mm thick aluminium endplate. After welding of the frame, the endplates were machined in the area where the springs and force transducer were connected to enable correct assembly of the segments. The foam model was rigidly connected to the frame by means of glass-fibre reinforced material. These arrangements are shown in Pictures 7 and 8.
Most experiments are carried out for cruise ships and container ships. Measurements are performed by introducing transverse cuts in the model vertically near bow, stern and at mid-ship. The important parameter for whipping responses due to bow flare and stern slamming is the duration and rise time of total bow flare and stern slamming forces. In total, eighty different stern and bow flare geometries have been tested at MARINTEK in the last four years. From the experimental data one can identify important parameters for bow flare and stern slamming as function of significant wave height, wave period, speed of ship, wave direction and bow and stern geometry.
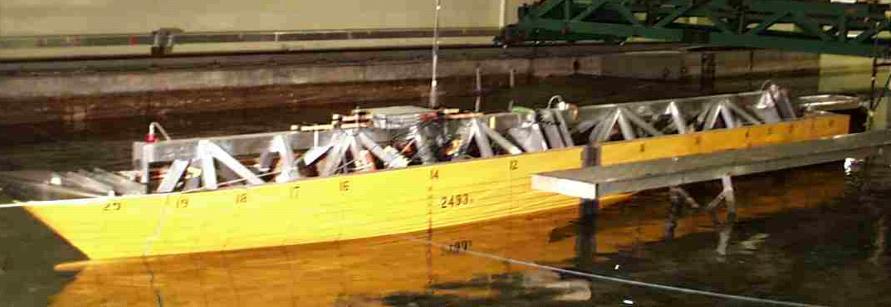
A typical ship model is shown in Picture 8. During whipping tests the total bow slamming force, stern slamming force and total mid-ship bending moment were measured in addition to wave elevations at FP and AP.
The total bending moment can be split into two components:
- Low frequency contribution (wave-contribution).
- High frequency contribution (whipping-contribution).
Contributions from wave and whipping can be found by high and low-pass filtering of the measured signal. Typical time histories of the measured vertical bending moment (VBM), wave and whipping contributions are shown in Picture 9.
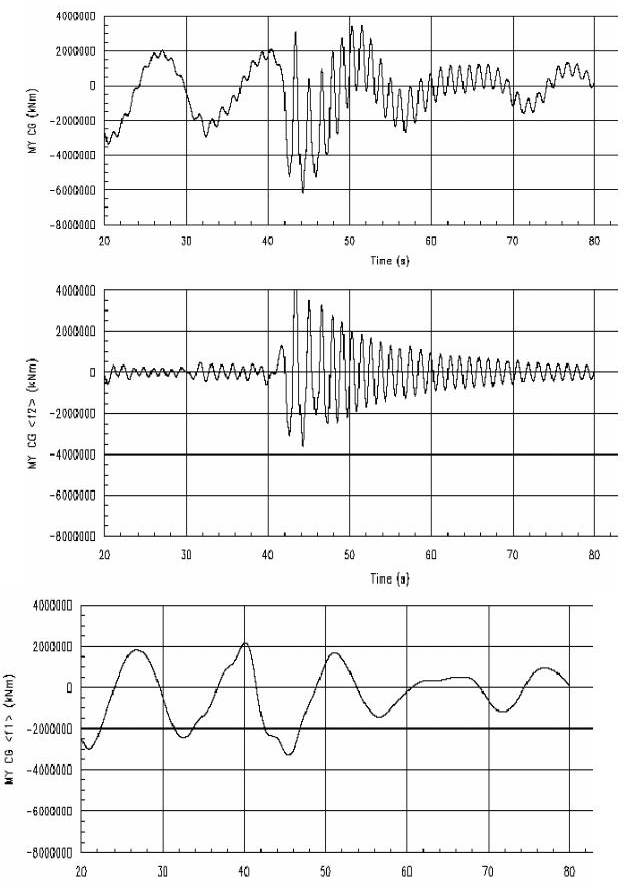
In this case the whipping contribution is larger than the wave contribution. Generally, the whipping contribution can be between 30 % and 150 % of the wave contribution in extreme wave conditions. It varies depending on ship size, type and local bow and stern geometries. Large contribution of whipping to vertical bending moment amidships is mainly induced by bow or/and stern slamming. The bow slamming forces are largest in head seas with high forward speed. The mid-ship bending moment increases significantly with forward speed. The whipping responses in large waves can be 3-4 times larger at 10 knots compared to zero speed.
Stern slamming is likely to occur in following seas at low speed. Usually the stern slamming could be significantly reduced by a slight change of stern geometry. For certain stern geometries, stern slamming occurs in head seas at relatively low speed. For these ships in head seas, the bow slamming force increases with forward speed, but stern slamming force increases when reducing speed. An optimal forward speed to reduce the total slamming contribution to the mid-ship bending moment can be determined. Since the whipping responses are dependent on the bow and stern geometry, optimization of bow and stern geometry can significantly reduce the whipping responses. Therefore, it is extremely important to investigate the whipping responses in Planning the Design, Construction and Operation of New LNG Transportation Systemsdesign of large LNG ships.
To investigate the effects of the bow and stern slamming on the mid-ship bending moment in different sea states, both bow and stern forces and relative motions are measured. Picture 10 shows an example of the incident wave, relative motions at FP and AP, bow and stern slamming forces, and total mid-ship bending moment in head seas.
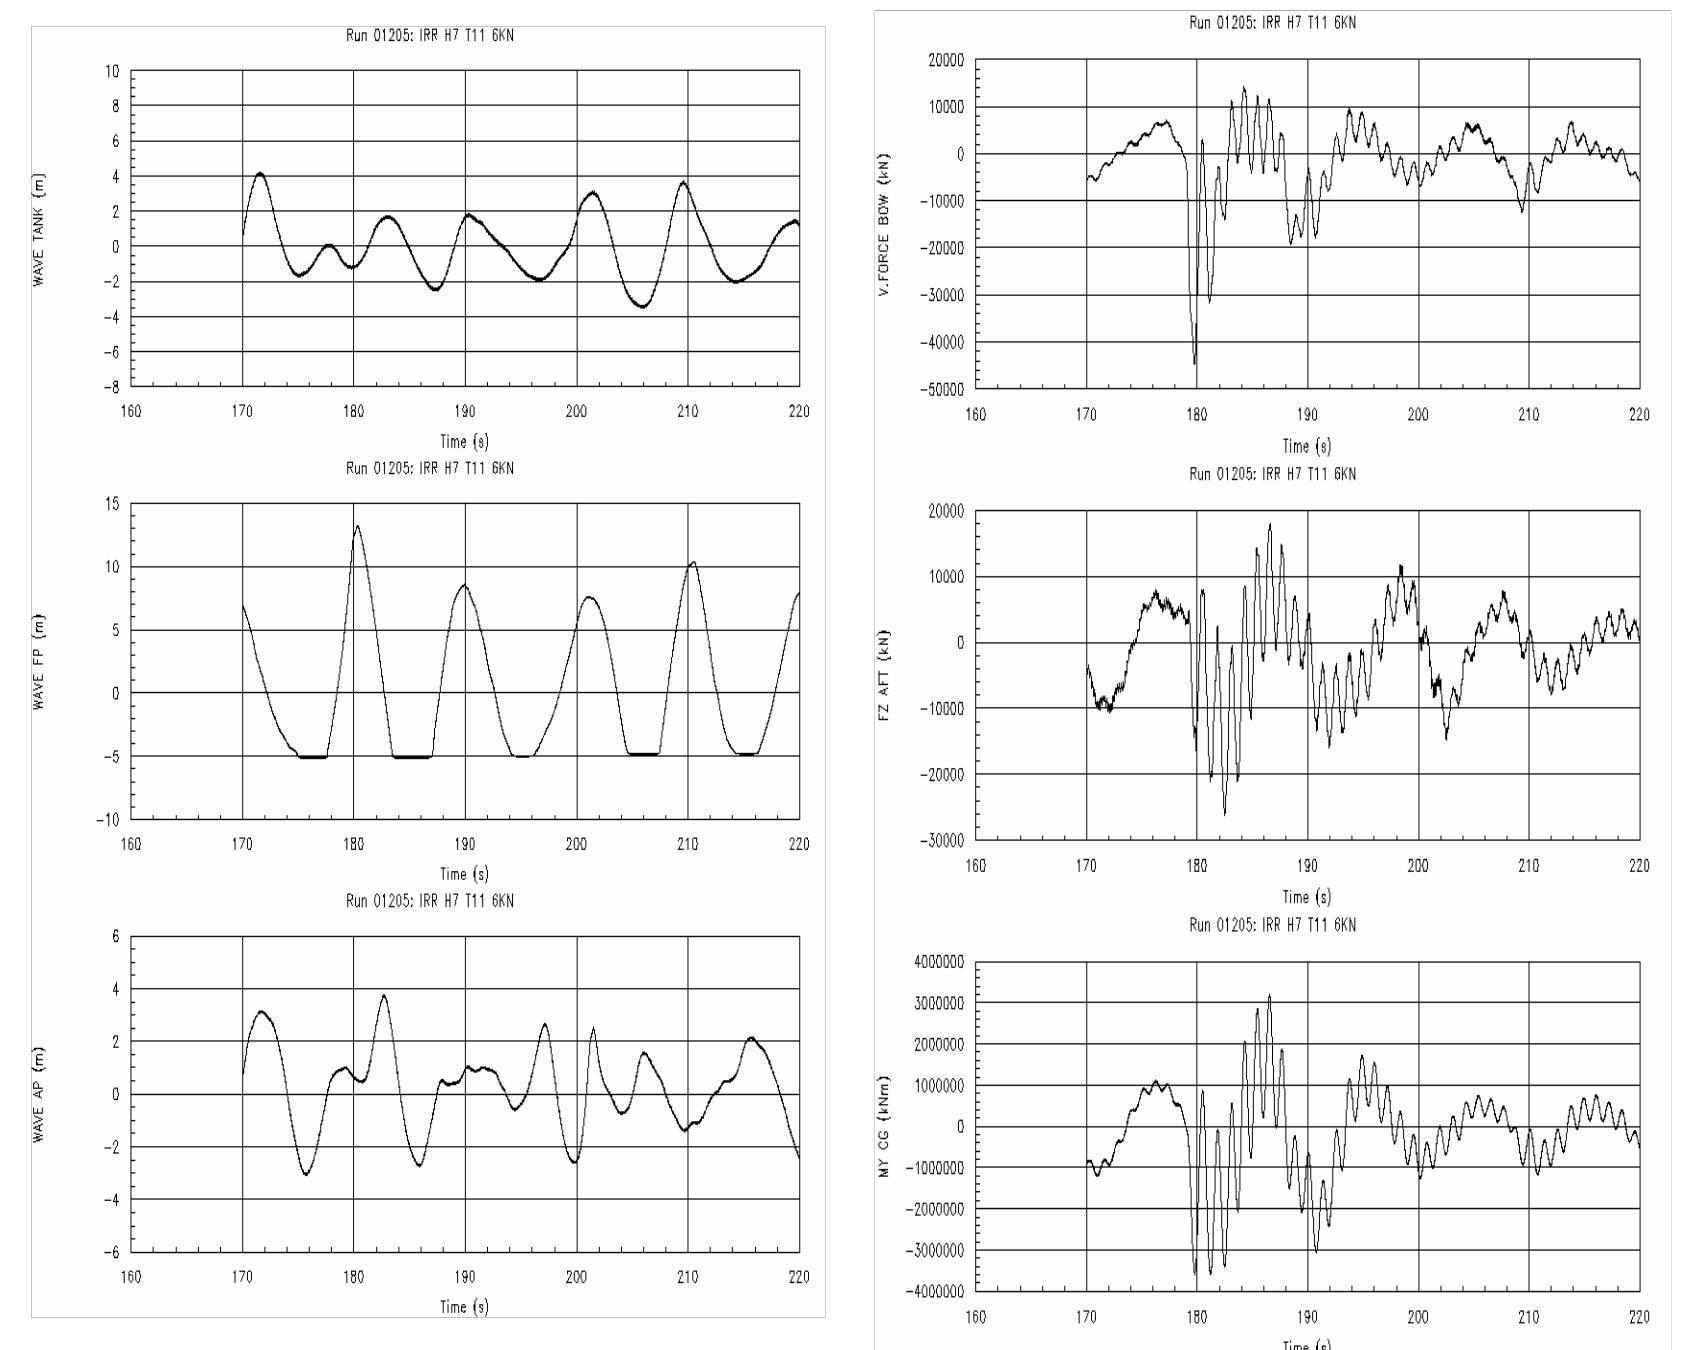
The incident wave is measured by a wave probe located half ship’s length ahead of the ship model. The whipping response is mainly due to the bow flare slamming. The second example is shown in Picture 11 in following seas.
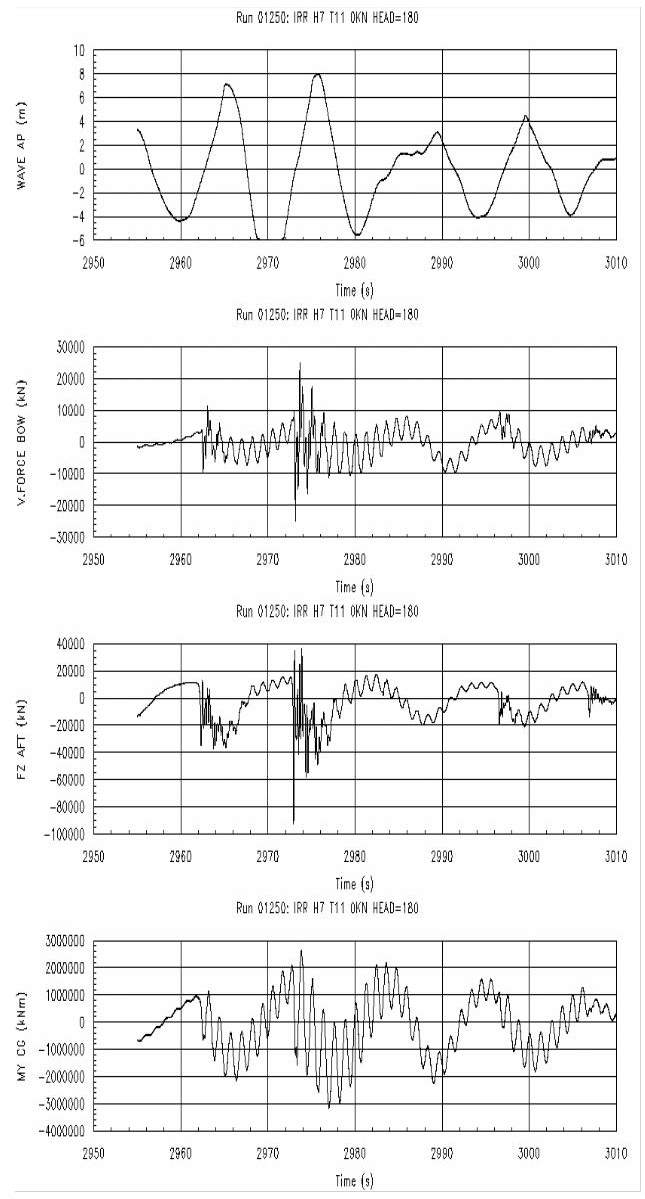
The results of relative motions at AP, bow and stern slamming forces and the total mid-ship bending moment are shown. In this case the whipping response is mainly due to stern slamming. The cut value of relative motions is due to the wave probes being out of water, since the relative motion measured by the wave probes is very large. Both examples show that the whipping responses contribute significantly to the global hull girder loads.
Model test results show that structural damping affects the resulting maximum mid-ship bending moments significantly, especially when both bow flare and stern slamming occur. Bow flare slamming usually occurs first, followed by stern slamming a few seconds later.
When stern slamming occurs, the whipping responses due to bow flare slamming still have 30 to 50 % of the amplitude remaining. Then the whipping responses due to stern slamming will be added to the responses due to bow flare slamming. The model tests showed that the worst bow flare slamming occurs when three large waves travel together. The first two waves will create a large relative motion between the bow and water surface and the third one gives a large impact. The model tests have been validated against full scale data measured by Lloyd’s Register. Good agreement was achieved for both wave and whipping induced responses.
Sloshing and Parametric Roll
It has been reported that some large container ships have experienced large roll excursions up to 40 degrees in head seas, which is referred to as parametric roll. The parametric roll occurs when the wave encounter period is close to half of the roll natural period of the ship. This phenomenon has been described by many authors, for instance Faltinsen. The instability may result from the stern geometry, especially for a ship with a near flat stern submerged just below the mean water line. In large waves the time dependent part of GM could be large for this form of ship. Such instability increases the likelihood of parametric roll.
For large LNG ships the natural period of roll motions is about 14 to 25 seconds, depending on filling ratios, ship geometry and loading conditions. The natural period of the cargo sloshing could be 7-8 seconds, which is close to half of the roll period. This means that a large LNG ship with one or more tank(s) not fully filled (filling level less than 90 % of the tank height) can be vulnerable to parametric roll, when encountering a wave period close to both the natural period of the cargo inside a tank and half of the roll natural period of the ship.
For the majority of the ships that are vulnerable to parametric roll, the excitation force comes from the bow flare. In large waves the nonlinear force in the bow area is the primary source of roll excitation. Water entry of a symmetric cross section with a heel angle will introduce a roll moment. The water exit force in the bow area could also be important to parametric roll, since there is a scale effect on the excitation forces. The excitation force due to the water exit may be considered as a negative added mass effect. It is very difficult to predict. For the water entry the “pile up effect” can be predicted well by using the Wagner approach or the fully non-linear solution of Zhao and Faltinsen. The scale effect of ‘pile up effect’ is small and can be neglected. The exit problem is a very complex problem. A simple test can demonstrate the problem, but it is difficult to find a simple scaling law which can be used in engineering work. Another difficult issue is the prediction of roll damping for the parametric roll, in which the amplitude of the roll motion is large and so is the non-linear effect of the roll damping. Correct prediction of the roll damping is a challenging task in itself. Experimental results have shown that the roll damping is extremely important in determining the maximum roll response. Generally, decreasing the deadrise angle of bow flare increases the excitation forces and at the same time it also increases the roll damping.
It is almost impossible to find a numerical code (or CFD) to predict the excitation force and roll damping for parametric roll. To provide a practical solution, a simple model for studying parametric roll motion is suggested. A one degree of motion model for roll is used with the excitation force from the bow region. The equation can be written as:
Here:
- is the acceleration in roll;
- B44 is the damping force term;
- C44(t)η4 is the restoring force and;
- Fex is the excitation force in roll.
I44 is the initial moment known from mass distribution. A44(t) is the added mass in roll. The A44(t) can be divided into two parts, one is added mass due to roll motion and the other is due to sloshing. The first term can be predicted by assuming that the natural period of roll is large. That means the added mass in roll for frequency tending to zero can be used. The second term, which depends on the fluid motion inside a tank, can be important when the encounter frequency is close to the first natural period of the tank. This term can be estimated by using WAMIT for solving the fluid motion inside a tank.
B44 is a function of time and roll velocity (
), mainly coming from the viscous effect, which can be estimated by using an empirical formulae or from model test and full scale data. As discussed earlier, the impact forces may increase the roll damping since the instantaneous roll velocity will increase the roll moment.
C44(t) can be divided into two parts, one is time independent and the other is time dependent. The time dependent part is important for parametric roll and has been included in the analysis of parametric roll of Abicht.
The excitation force Fex can also be divided into two parts, one from external forces, mainly from the non-linear force at the bow and stern, and the other contribution from internal sloshing loads.
The Fex can be estimated from model tests or theoretical calculations. The first part of the contribution of non-linear excitation can be measured by using a similar segmented model to that used in measuring the whipping response, which has been described in Section 4.
Theoretical calculations can also be used to predict the external loads. Linear strip theory can be used to predict ship motions and the relative motions between the wave surface and the ship at each section. Nonlinear correction of the hydrostatic (Froude-Krylov) force and slamming loads should be applied and included in the analysis. The slamming load prediction is usually based on 2-D approach such as the generalized Wagner solution of Zhao et al. By comparing 2-D slamming loads and measured slamming loads, we found that three-dimensional and forward speed effects are very important for determining the slamming loads. All linear theories treat forward speed based on an approximate correction
No fully linear theories exist to account for the forward speed effect. When one compares the linear ship motion predictions with forward speed with experimental results, one may find that for some speeds and some ships the results agree well, in other conditions they do not but, when one compares ship motions without forward speed with the linear program, like WAMIT, the results usually agree well, as long as the incident wave amplitude is small and the encounter frequency is not close to the natural roll period. This is mainly attributed to the forward speed effect, as steady velocity potential is used. We have two parameters, namely wave amplitude and forward speed, to consider. It is therefore difficult to find a consistent linear theory to predict the ship motions at forward speed.
A simulation program for parametric roll, based on a parameter study, is being developed. The results will be presented in the near future.
Conclusions
LNG Sloshing
Design loads for the membrane insulation system are difficult to determine based on the absolute approach without comprehensive knowledge of the dynamic resistance capability of the membrane systems. Until such information is readily available, the comparative approach provides a practical solution to the problem.
The results show that partial filling at 30 % level can induce travelling waves and increase sloshing loads by up to 50 % when compared with the maximum loads measured at 80 % filling or above. The impact area is increased as well. Based on the available service experience and damage records, industry generally agrees that safety margin of the membrane systems is no more than 2,0 for convention size LNG ships under the currently approved filling restriction. On this basis, it is concluded that the study does not find evidence to support the view that unrestricted partial filling is safe for a LNG ship. However, partial filling outside the currently approved filling range, even unrestricted partial filling, may be permissible for service in restricted areas. The feasibility can be assessed based on specific wave data and the comparative approach presented.
The study shows that for a conventional size LNG ship (140 500 m3) the sloshing load at a filling ratio of 70 % is no more severe than that at 80 % or above. Lloyd’s Register has reduced the upper barred range limit for conventional size LNG ships from 80 % to 70 %. This provides a ship with the flexibility required to carry any cargo volume on board by appropriate redistribution between tanks.
The sloshing loads increase with the dimensions of the LNG tanks. Due to lack of service experience, designers should be prudent when considering large increases in tank dimensions over the existing designs.
Effect of Slamming – Induced Whipping on Global Loads
Extensive research projects on impact loads and structure responses on large ships have been carried out by MARINTEK and Lloyd’s Register. They include full scale measurements and a test program using a four- segment model, in order to predict slamming loads and whipping responses. The results show that whipping can increase vertical bending moments amidships by 30 % to 150 % in extreme waves, depending on ship size, type, local bow and stern geometries. Therefore, it is important to investigate the potential excitation sources and responses of whipping during design of large LNG ships to minimize whipping and ensure adequate structural design.
For a large LNG ship, the natural period in roll is about 14 to 25 seconds, depending on filling ratios, ship geometry and loading conditions. The natural period of the cargo, when a tank is not fully filled (less than 90 %), could be 7-8 seconds. This means that the ship can encounter a wave with period close to both the cargo natural period and half of the roll natural period. Hence, the ship could be vulnerable to parametric roll. The bow and stern geometries, loading and operation conditions influence the risk of parametric roll. Efforts should be made to reduce or avoid parametric roll during design and operation phases of large LNG ships.