The study of all gas laws, thermodynamic principles and re-liquefaction processes is a key issue in the fields of physics and chemistry. These concepts play an important role not only in science, but also in various technical fields, including engineering, energy, metallurgy, and much more.
- The Gas Laws and Thermodynamic Principles
- Liquefied gas mixtures, their vapour pressures and compositions
- The bubble point’ and “dew point” of mixtures
- The laws of thermodynamics
- Enthalpy and Mollier charts
- Thermodynamic systems – isothermal, isentropic and adiabatic processes
- Heat transfer
- Practical examples of heat transfer
- Rollover
- Reliquefaction
- Indirect cycle
- Direct cycle
- Cascade cycle
- LNG reliquefaction cycles
In this tutorial we will look at the basic aspects of gas laws and thermodynamic principles, and also pay attention to re-liquefaction processes, which are an important step in many technological processes. We will present these topics in an accessible manner, taking into account both theoretical aspects and their practical applications.
The Gas Laws and Thermodynamic Principles
The behaviours of gases under different conditions were investigated independently by a number of researchers during the early days of scientific investigation and the Gas Laws were derived from their observations. They describe the behaviour of “superheated” vapours (ie a gas removed from the liquid surface and no longer in equilibrium with that liquid). When a gas is superheated the molecules are sufficiently so far apart that they do not exert any forces on each other.
The Gas Laws describe the relationships between pressure, volume and temperature for a fixed mass of gas. One variable is kept constant while the relationship between the other two is recorded. These laws are often called the “Ideal Gas Laws” as they assume the gas molecules behave in an ideal way and with no interaction between them. In reality there is no such gas but, under the moderate range of temperatures and pressures we encounter in the liquefied gas trades, most superheated cargo vapours follow these laws so sufficiently closely that we can use them for practical purposes.
Figure 1 outlines the three basic gas laws. They cover changes at constant temperature (isothermal), at constant pressure (isobaric) and at constant volume (isovolumetric).
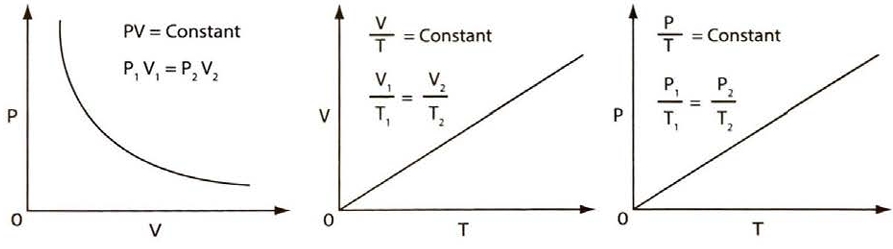
a – Boyle’s Law for gas at constant temperature; b – Charles’ Law for gas at constant pressure; c – the Pressure Law for gas at constant volume
Boyle’s Law
Boyle measured the variation of a volume of a gas while the pressure on it was varied and its temperature was kept constant. Boyle’s Law states that, at constant temperature, the volume of a fixed mass of gas varies inversely with its pressure. (Note that the absolute pressure of the gas is used in this case and not its gauge pressure, see article Properties of liquified gases“Saturated vapour pressure (SVP)“).
This relationship is illustrated in figure 1 (a) and can be expressed as:
If the gas is compressed from an initial condition, described by ′P1 & V1′ to a final condition of ′P2 & V2′, then Boyle’s Law can be written as:
Charles’ law
Charles kept the pressure of a fixed mass of gas constant and then measured the volume change while varying the temperature. He found that as the temperature rose, the volume increased in a straight line relationship. The volume increase is approximately 1/273 of the gas volume at 0 °C for each degree Centigrade rise in temperature. This Law is illustrated in figure 1 (b) and can be expressed as:
or
When repeated for a variety of different gases, experiments showed very similar results. When the lines plotted from the experimental data were extrapolated, it indicated the temperature at which the gas volume reduced to zero would always be the same (see figure 2).
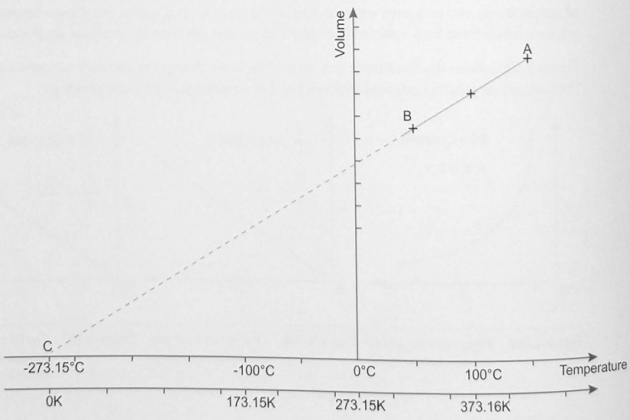
*C is the point where the extension of the line AB meets the temperature scale in degree Celsius. This point is the start of the absolute temperature scale.
This temperature is defined as the “absolute zero” of temperature and has the value of minus 273,15 °C (-273,15 °C). An “absolute scale of temperature” was established, with this point as the zero point, and is called the Kelvin scale. The 1 Kelvin interval on this absolute scale has precisely the value as 1° increment on the Celsius scale. The only differences between the two scales are that the Kelvin scale does not use the “degree” symbol for temperatures (ie “T°”) and that the zero point is 273,15 degrees below zero Celsius (in other words, 0 K = minus 273,15 °C (-273,15 °C)).
In all scientific calculations of gas properties the absolute temperature is used. When differences in temperature are being considered it is normal to use °C readings, which do not cause problems as the interval used for both scales is identical and the temperature difference has the same numerical value.
The Pressure Law
This Law states that the absolute pressure of a fixed mass of gas varies directly with its absolute temperature at constant volume. The gas pressure increases by 1/273 of the absolute value at 0 °C for each degree Centigrade rise in temperature. The pressure law is illustrated graphically in figure 1 (c) and can be expressed as:
or
Avogadro’s Law (sometimes referred to as Avogadro’s Hypothesis or Avogadro’s Principle)
Avogadro proposed that the volume of a gas was related to its mass. He discovered that the quantity of gas equal to its molecular weight in grams occupies a volume of 22,4 litres at 0 °C and atmospheric pressure. Avogadro defined these conditions as “normal temperature and pressure” or “NTP“.
In addition, Avogadro proposed that this volume contained the same number of atoms or molecules for any gas, a number calculated to be 6,022 × 1023. He defined this quantity as a “mole“, and defined the volume occupied by a mole of a gas at NTP as the “molar volume”.
Avogadro’s Law is independent of mass units, so it is possible to define a molecular number and volume for units such as kilograms or pounds. However, the “gram-mole” is the most commonly used, so it is the unit assumed unless stated otherwise.
General gas Law
If the various Gas Laws are combined with Avogadro’s, a General Gas Law can be derived that relates the pressure, volume and mass of a gas to its temperature (all units are absolute). This can be stated as:
Where “n” is the number of moles of the gas and “R” is called the “Universal Gas Constant“.
Graham’s Law
Graham discovered that the rate at which a gas passes through a small orifice in a container is inversely proportional to the square root of the molecular mass of the gas. So if the molecules of gas “A” have a mass four times heavier than the molecules of gas “B“, then gas “B” will escape through a small pinhole twice as fast as the heavier gas.
This principle is commonly used in the liquefied gas industry to test equipment for leakage. For example, the welds of some membrane containment systems are leak tested with helium gas (molecular mass = 4) as this will leak at twice the rate of methane (molecular mass = 16).
Liquefied gas mixtures, their vapour pressures and compositions
Dalton’s Law
Dalton discovered that when a mixture of several different gases occupy the same space, each gas behaves as though it occupied that space alone. This rule applies if the gases do not react with each other. The pressure exerted by each gas is called its partial pressure. The total pressure exerted by the gas on the entire space is the sum of the partial pressure of each component.
This can be expressed as:
(where p1 + p2 etc are the partial pressures of each component).
Raoult’s Law
Raoult discovered that if the properties of different chemicals in a mixture are similar, the partial vapour pressure of each component is equal to the vapour pressure of the pure component multiplied by its mole fraction in the mixture. In other words, the vapour pressure of the solution depends only on the vapour pressure of each chemical component (as a pure liquid) and the mole fraction of the component present in the solution. The common hydrocarbon cargoes follow this behaviour very closely, so Raoult’s Law can be used to describe their behaviour.
Raoult’s Law can be expressed as:
Where:
- Pmt is total SVP of liquid mixture (m) at temperature (t);
- Pnt is SVP of the pure component (n) at temperature (t);
- Fn is the mole fraction of component (n) in liquid mixture.
For example, for an LPG of the following composition at minus 40 °C (-40 °C):
| Table 1. Raoult’s Law | ||||
|---|---|---|---|---|
| Component (n) | Mole Fraction of Component in Cargo Liquid (Fn) (% mole/100) | SVP of component at -40 °C (Pnt) in bara | Partial Pressure of Component at -40 °C = (Fn × Pnt) bara | Composition of Cargo Vapour (% mole) (Partial Pressure/SVP of Mixture) × 100 |
| Ethane | 0,002 | 7,748 | 0,0155 | 1,4 |
| Propane | 0,956 | 1,130 | 1,0803 | 97,8 |
| n-Butane | 0,030 | 0,170 | 0,0051 | 0,5 |
| i-Butane | 0,012 | 0,284 | 0,0034 | 0,3 |
| 1,000 | Σ = 1,1043 | 100,0 | ||
| SVP of mixture = 1,1043 | ||||
This example shows how a small amount of a more volatile component in the liquid mixture, ethane in this case, can significantly increase the vapour pressure of the cargo. The components of the liquid mixture are in solution with each other, so a low boiling component like ethane can remain in the liquid phase at temperatures well above the saturation temperature of the liquid. However, the vapour phase will contain a much higher proportion of such volatile fractions than is present in the liquid mixture. In this example the mole percent of ethane in the liquid is 0,2 %, while it comprises 1 ,4 % mole of the vapour.
If the components of a gas mixture are known, it is possible to perform a variety of calculations using the following relationships.
For example, for a typical composition of natural gas shown in table 2, the molecular mass of the mixture and the mass percentage of each component can be determined from the percent mole analysis of the vapour.
Molecular mass of mixture
Molecular mass of a gas mixture
where:
- Mi = component molecular mass;
- Vi = percentage component volume.
Mass percentage
Percentage mass of component = ViMi/Mmix
where:
- Mmix = molecular mass of gas mixture.
Relative vapour density
Relative vapour density of a gas mixture (at 0 °C and 1 bar) = Mmix/Ma
where:
- Ma = molecular mass of dry air = 28,97.
| Table 2. Calculation for molecular mass of a natural gas mixture | ||||
|---|---|---|---|---|
| Gas component | Mole percentage in mixture (V) | Molecular mass of component (M) | Molecular mass of mixture MiVi 100 | Mass percentage in mixture |
| Methane | 83,2 | 16,04 | 13,35 | 37,6 |
| Ethane | 8,5 | 30,07 | 2,56 | 13,0 |
| Propane | 4,4 | 44,09 | 1,94 | 9,8 |
| Butane | 2,7 | 58,12 | 1,57 | 7,09 |
| Nitrogen | 1,2 | 28,02 | 0,34 | 1,7 |
| 100,00 | Mmix = 19,76 | 100,00 | ||
| Relative density of mixture = 19,76 /28,97 = 0,682 (air = 1) | ||||
The bubble point’ and “dew point” of mixtures
The temperature at which a pure liquid will start to evaporate depends on the pressure exerted on its surface. The process will continue at the same temperature provided that the pressure is kept constant. Conversely, if superheated vapour is cooled to that same pressure, the vapour will become saturated at the same temperature and will all condense to become liquid again at that temperature.
For a mixture of liquefied gases, the liquid will behave differently due to the differing volatilities of its components. The “bubble point” of a liquid mixture is defined as that temperature at which the liquid will just begin to evaporate at a given pressure as the temperature rises. The “dew point” of a vapour mixture is defined as the temperature at which the vapour just begins to condense at a given pressure as the temperature decreases.
Read also: Dual-Fuel-Electric LNG Carrier Propulsion
For a liquid mixture in equilibrium with its vapour, the bubble point and the dew point are at different temperatures because their compositions are different.
This behaviour can be represented on a phase equilibrium diagram and a typical example for propane/butane mixtures is shown in figure 3, showing the vapour/liquid equilibrium data for mixtures with varying mole percentages of the less volatile component (butane) in the liquid. Equilibrium data will be related to the pressure of this system, which in this case is at atmospheric pressure.
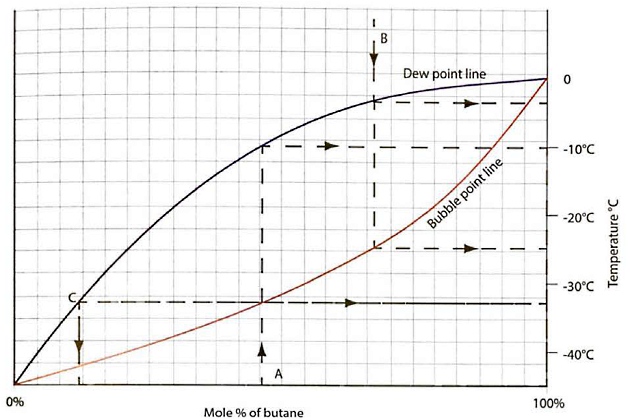
The two curves of figure 3 show the bubble point and dew point lines for the mixture over a composition range from pure propane (ie 0 % (mole) butane) to pure butane (100 % mole). Note that at the two extremes, ie for pure propane or pure butane, the bubble point and dew point temperatures are the same and correspond to the atmospheric pressure saturation temperatures.
From the diagram it can be seen that a liquid mixture with the composition (A) will start to evaporate at minus 32,5 °C (-32,5 °C), which is its bubble point. However, this mixture is only vaporised completely when the liquid temperature rises to minus 10 °C (-10 °C) and is in equilibrium with its vapour.
Conversely, a vapour mixture of composition (B) will start to condense at minus 3 °C (-3 °C), its dew point temperature, but will only condense completely when the vapour temperature has been reduced to minus 25 °C (-25 °C) (ie the bubble point for that composition).
Equilibrium diagrams can also be used to estimate the composition of the vapour in equilibrium with a specific liquid composition. Take, for example, a cargo liquid with composition (A) carried at atmospheric pressure and its initial bubble temperature of minus 32,5 °C (-32,5 °C). At this temperature, the composition of the vapour in equilibrium with the liquid is given by (C).
“Batch” versus “flash” vaporisation
Analysis of phase equilibrium diagrams shows that if the BOG is drawn off from a liquid cargo of mixed hydrocarbons, the composition of the vapour is different from the composition of the bulk liquid. This process is known as “flash vaporisation” or “weathering“. Conversely, if it is required that the vapour composition is the same as the liquid properties, the bulk liquid has to be evaporated simultaneously, which is known as “batch vaporisation“. A common example of this is the “forced” vaporisation of cargo for use as fuel onboard LNG carriers; “natural” vaporisation is the same process as flash vaporisation or weathering.
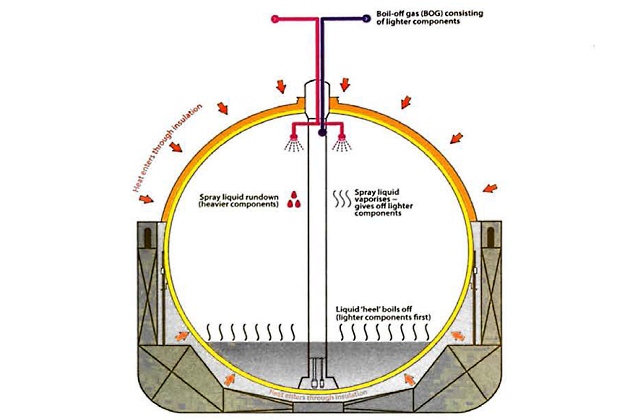
If the lighter ends of a smaller cargo amount (heel), are used for fuel, this will alter the composition of the remaining heel, which will increasingly contain a higher proportion of the heavier components.
The laws of thermodynamics
Zeroth Law
This states that:
If a body “A” is in thermal equilibrium with body “B” and body “C” is also in thermal equilibrium with body “C”, then body “A” is also in thermal equilibrium with body “C”.
This law introduces the concept of thermal equilibrium between independent bodies. (This concept was recognised after the other laws were established, so it is designated as “zero“).
First Law
This states that:
The heat lost from a source is equal to the total heat gained and work done on the bodies that receive that heat.
This law introduces the concept that heat and work are equivalent. It is sometimes known as “the law of conservation of energy” as it states that energy cannot be created or destroyed. Energy can, however, change form and flow from one point to another, while the energy of an isolated system does not change.
Second Law
This states that:
Heat always flows naturally from a hot body to a cooler one.
This law introduces the concept that heat is a natural process of energy transfer to or from a system, other than by transfer of matter or by doing work on that system. It introduces the concept that heat flow is directional.
The second law of thermodynamics can be understood to say that, unless hindered from doing so, energy disperses spontaneously and becomes spread out rather than localised. This describes common experience, such as an object cooling down if it is warmer than its surroundings or warming up if it is colder than the surroundings.
Third Law
This states that:
The entropy of a system approaches a constant minimum value as the temperature approaches absolute zero.
Entropy is a measure of the dispersal of energy within a system and of how close the internal energy of that system is to the absolute minimum value. Entropy is also a measure of the availability of the energy in a system to do work and can be understood as a measure of “before and after” conditions, quantifying how much the energy of the system has been spread out during the process.
Enthalpy and Mollier charts
We can see from the laws of thermodynamics that temperature alone is not a complete measure of the energy contained within a system, particularly if the system has a significant volume of gas that may have much of its energy in the form of pressure. The total internal energy in a system includes sensible heat, latent heat, kinetic energy and potential energy. Enthalpy is used to measure the total thermodynamic energy content of the material, regardless of its phase.
Enthalpy (H) is defined as:
Where (in SI units):
- H = enthalpy (kJ/ kg);
- U = internal energy (kJ/ kg);
- P = absolute pressure (kN/ m2);
- V = total volume of the system – liquid plus vapour (m3);
- M = mass in the system (kg).
Enthalpy is a useful measure of how the energy of a fluid changes as it passes through any thermodynamic process, especially reliquefaction cycles that include evaporation, compression, condensation and expansion. The changes of enthalpy around the cycle are of practical interest for the thermodynamic analysis of the process, rather than the absolute enthalpy values. Therefore, enthalpy is usually measured from an arbitrarily chosen zero point.
The relationship to enthalpy versus absolute pressure for liquids and gases can be plotted on a diagram known as a Mollier chart. This provides a visualisation of how enthalpy changes as the Auid passes around the reliquefaction cycle. A simplified version of a Mollier chart for propane is shown in figure 5. (Note: The enthalpy scale is based upon the assumption of 419 kJ/kg at 0 °C in the liquid phase).
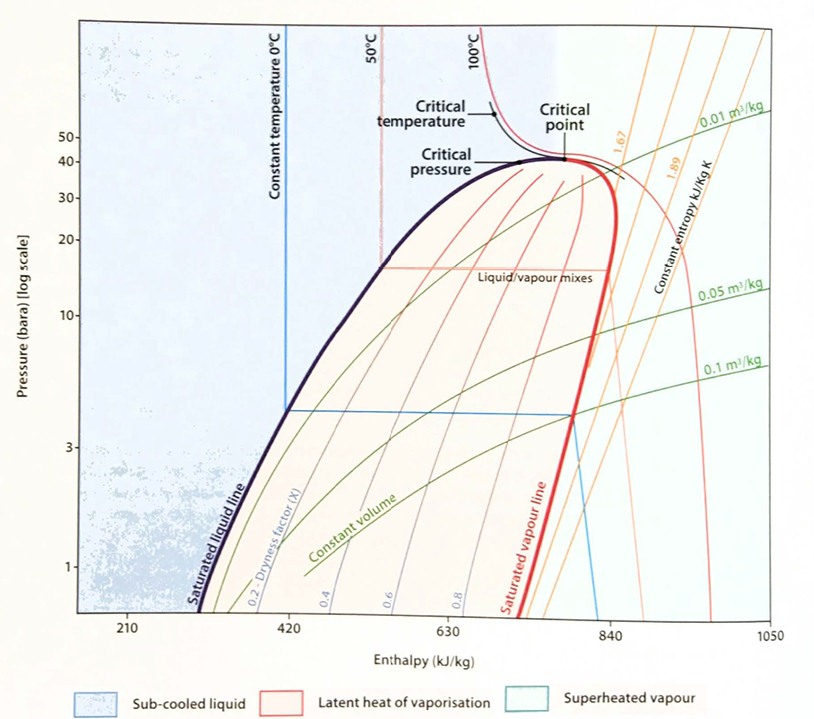
The chart plots the enthalpy on a linear scale along the x-axis and the absolute pressure in a logarithmic scale on the y-axis. The main feature of the diagram is the rounded conical shape of the liquid/vapour mixture area. This is bounded by the “saturated liquid line”, which runs upwards from the bottom left then levels off and turns down again as the “saturated vapour line” to meet the x-axis again. The apex of the curve is known as the “critical point”.
Fluid in the area to the left of the saturated liquid line is a sub-cooled liquid. In the area to the right of the saturated vapour line it is superheated vapour. This is the area where the General Gas Law equation applies (ie P × V = n × R × T).
The area between the lines of saturated liquid and vapour indicates mixtures of liquid and vapour. Lines running through this area indicate two-phase mixtures with the same proportion of liquid and vapour, which is called the “dryness factor”. A dryness factor of 0,4 means that 40 % of the fluid is vapour while 60 % is liquid.
Lines of constant temperature run down from the top left of the chart until they reach the saturated liquid line, when they turn and run horizontally until they reach the saturated vapour line. When the line leaves the central area it turns down in on arc towards the x-axis. The horizontal part of the line between the curves indicates the latent heat at that particular point, which is seen to vary according to the pressure applied. The value of the latent heat decreases as the pressure increases, until it becomes zero at the critical point.
It will be interesting: Overview of Alternative Propulsion Systems for the LNG Vessel
From this observation it is clear that at certain temperatures it is not possible to liquefy a gas by increasing the pressure alone; the gas will first need to be cooled to the critical temperature or below. This can be understood as the need to reduce the speed of the gas molecules so that they will stay together when pressurised, rather than bounce off each other.
The critical temperatures of some common cargoes, such as ethylene and ethane, are in the ambient range. For methane it is below normal ambients. However, for most cargoes this critical temperature is well above ambient, which is why they can be carried either pressurised or refrigerated.
Lines of constant entropy are also shown on the Mollier chart. These are particularly important for superheated vapour, as the process of gas compression in this area will usually take place with little or no change of entropy.
There are Mollier charts available for all of the common liquefied gases and they can be very helpful for monitoring the efficiency of the reliquefaction process on board ships.
Thermodynamic systems – isothermal, isentropic and adiabatic processes
Isothermal
An isothermal process is one that takes place at constant temperature, for example phase changes from liquid to vapour. Boyle’s Law is an example of an isothermal process. If an ideal gas is compressed isothermally, the heat created by the work done on the vapour will be dissipated. Conversely, if this gas is expanded then external heat has to be taken into the system to maintain the temperature constant.
Isentropic
An isentropic process takes place without any change of entropy in the system.
Adiabatic
An adiabatic process is one that occurs without transfer of heat or matter between the system and its surroundings. The word adiabatic means “not able to pass through“, which describes the boundary of the process that, in turn, is defined as providing perfect thermal insulation and total impermeability to the system. A reversible adiabatic process is one where the heat flow in to or out from an external source is zero. This is also an isentropic process as the entropy of the system remains constant.
In a reliquefaction plant, work is done on the gas passing through the compressor. This work becomes internal energy in the gas, which in turn increases its temperature due to the elevated pressure and the raised internal energy levels.
In practice, the compression work on the gas is done so quickly that there is very little time for heat to escape from the system. Therefore, the process is very close to being adiabatic, so it follows the curve AB in the pressure/volume graph for that gas (figure 6).
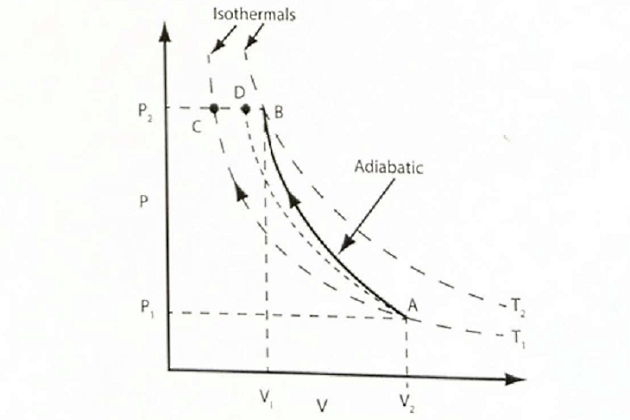
Conversely, if the process takes place very slowly, the heat from the compression work has time to leave the system so the process is isothermal and follows the line AC in figure 6.
The actual changes of volume, pressure and temperature that occur in a real compression cycle actually follow a curve somewhere between the adiabatic and the isothermal lines, approximately the curve AD in figure 6.
Note: the isothermal lines shown in figure 6 are similar to that shown in figure 1 (a) as Boyle’s Law is on isothermal process, except here there are two curves, one for a lower temperature (T1) and another for a higher temperature (T2).
The equation for an isothermal compression process (ie complying with Boyle’s Law) is: PV = constant.
The equation for an adiabatic compression process is: PVk = constant
where “k” is the ratio of principal specific heats for the substance (ie the specific heat of the liquid divided by the specific heat of the vapour).
Compressed Natural Gas Carriers Applied to Remote Marginal Gas Field DevelopmentsGas compression in a reliquefaction cycle is very close to being a reversible adiabatic process, so the changes in pressure and temperature can be plotted on a Mollier chart and should, ordinarily, follow the lines of constant entropy very closely.
Heat transfer
Heat is transferred from a warm body to a cooler one, as described in the Second Law. This transfer of heat can occur in three different ways:
Conduction
This is where the heat passes through a solid body by energy transfer between the adjacent molecules or between bodies that are in contact with one another.
Convection
This is where energy is transferred by the collective movement of higher energy molecules through a fluid (ie a liquid or a gas).
Radiation
This is where heat energy passes by electromagnetic radiation, often invisible to the human eye. Infrared heating lamps and microwave ovens are common examples of radiant heat transfer.
In nearly every case heat transfer involves one or more of these methods, so the total heat transfer is usually described using an equation developed by the French physicist, Joseph Fourier:
Where:
- Q = Total heat transferred (by all modes);
- H = Heat transfer coefficient (an average of heat transfer by the different methods);
- A = Total heat transfer surface area;
- T = Temperature difference between the bodies that are emitting and receiving the heat.
It is important to use consistent un its of measurement across all the factors in this equation.
Practical examples of heat transfer
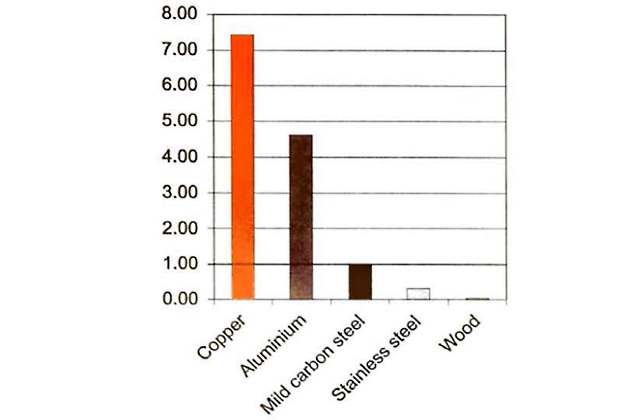
Figure 7 shows the heat transfer rates through various materials compared to mild carbon steel, which is given the arbitrary value of “1”. It shows that heat passes through aluminium more easily than through mild carbon steel or stainless steel. This is one reason for the difference in some of the operational characteristics between the various LNG containment systems.
The overall effect of heat entering the cargo causes the liquid near the tank surface to heat up very slightly, typically by less than 1 °C. This warming reduces the density of the liquid so that it forms a convection current and rises to the surface of the cargo, where it forms a very shallow boundary layer that is slightly warmer than the bulk cargo.
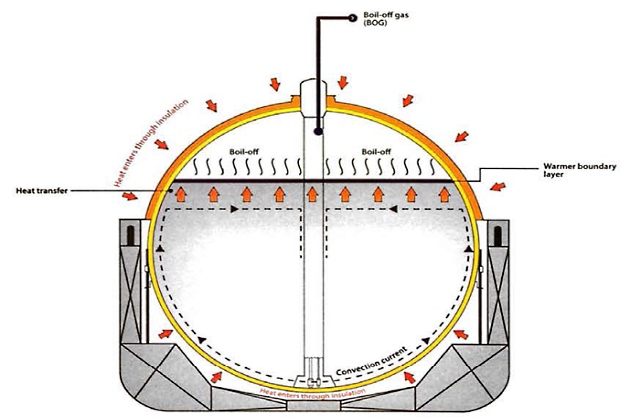
This boundary layer is where the liquid evaporates and becomes vapour. This process cools the liquid, which then circulates back down into the main part of the cargo. Overall, the temperature of the bulk liquid cargo is not affected by this process, which is mainly a surface effect.
Rollover
“Rollover” is a phenomenon that only arises with cryogenic liquids and it can only happen if stratification has occurred, ie two separate layers of LNG with different densities exist. The phenomenon can occur onboard LNG ships or in receiving terminals, both onshore and offshore. Rollover is characterised by the rapid release of vapour within an LNG tank, caused by the spontaneous mixing of LNG layers that have developed inside that tank.
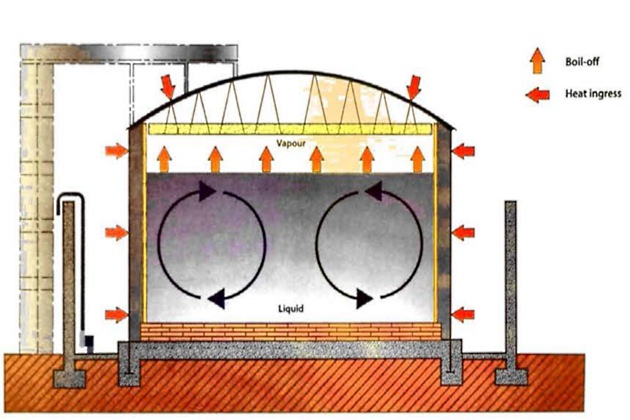
Stratification of LNG can occur when a LNG tank is filled with LNG of different densities. Figure 9 shows a tank with normal non-stratified convection heat transfer.
By contrast, figure 10 shows the conditions in a tank where stable stratification has been caused by filling a storage tank with liquids of different densities, with the higher density layer below the low density layer.
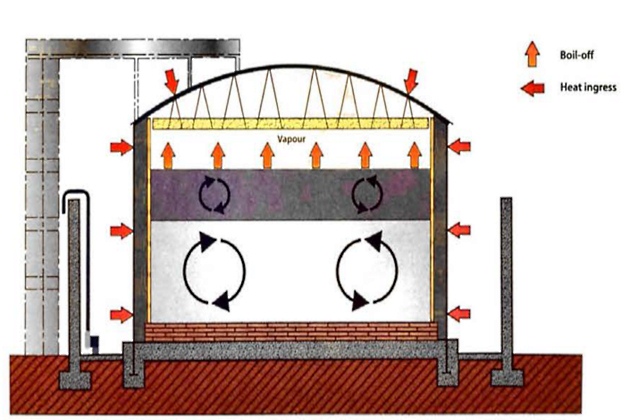
In the short term this is stable, but each layer establishes its own convection currents and there is very little heat or mass transfer between them due to the very low thermal conductivity of LNG.
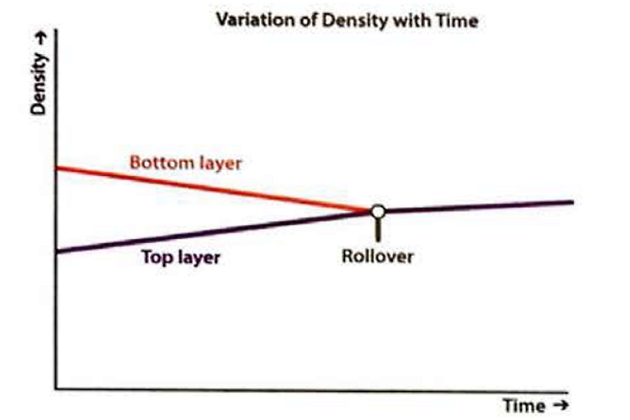
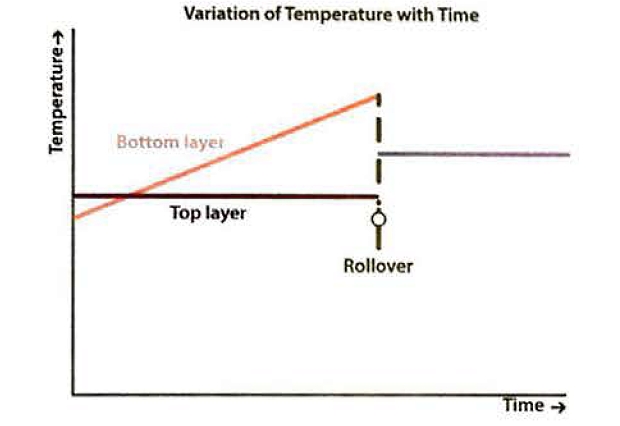
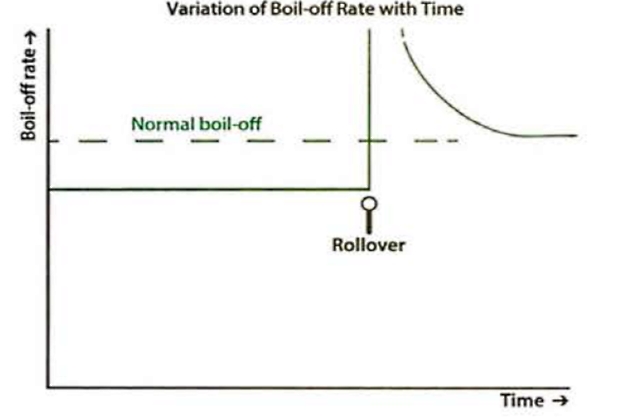
However, the heat that is passing into the lower layer through the tank wall and floor causes a rise in temperature and a decrease of density within that lower layer. The effect is even more pronounced if the density of the upper layer increases because the lighter BOG is removed. The variations of temperature, density and BOR with time are shown in figure 11. When the densities of the upper and lower layers are approximately equal, the lower layer will suddenly rise up through the upper layer and release the stored-up energy rapidly, generating large volumes of BOG in a short period. This is rollover.
The only certain way to avoid rollover is not to mix LNG parcels with widely differing compositions into the same tank. A more detailed discussion of how to avoid rollover risks in practical operations is given in References 2.8 and 2.9, SIGTIO’s “Guidance for the Prevention of Rollover in LNG Ships”, and GllGNL’s “Rollover in LNG Storage Tanks”.
Reliquefaction
Reliquefaction is the process by which BOG from a storage tank is converted back to a liquid. We use the term reliquefaction but it is the same process as liquefaction, the only difference being the source of the gas – ie under reliquefaction the gas has already been liquefied and you are dealing with the boil-off from that liquid. On board ship, the main purpose of reliquefaction is to provide a means of cargo pressure/temperature control, as required by the IGC Code.
Liquefaction of a gas occurs when its molecules are pushed closer together. The molecules of any gas are relatively far apart from each other, while the molecules of a liquid are relatively close together. Gas molecules can be squeezed together by one of two methods: by increasing the pressure on the gas or by lowering the temperature of the gas. For example, oxygen normally occurs as a gas. However, by applying sufficient amounts of pressure and by reducing the temperature by a sufficient amount, oxygen can be converted to a liquid.
Read also: Effects and Risks of Underwater Explosion for Gas Carriers
Two key properties of gases are important in developing methods for their liquefaction: critical temperature and critical pressure. For example, the critical temperature for carbon dioxide is 31 °C which means that no amount of pressure applied to a sample of carbon dioxide gas above 31 °C will cause the gas to liquefy. At or below that temperature, however, the gas can be liquefied provided sufficient pressure is applied. The corresponding critical pressure for carbon dioxide at 31 °C is 73,8 bar. In other words, the application of a pressure of 73,8 bar on a sample of carbon dioxide gas at 31 °C will cause the gas to liquefy.
A difference in critical temperatures among gases means that some gases are easier to liquefy than are others. While the critical temperature of carbon dioxide is high enough that it can be liquefied relatively easily at or near ambient temperature, the critical temperature of nitrogen gas, by comparison, is minus 147 °C (-147 °C), presenting greater challenges.
There are three types of reliquefaction plants used on board gas carriers:
- An indirect system, where cargo or evaporated cargo is cooled or condensed by refrigerant without being compressed.
- A direct system, where evaporated cargo is compressed, condensed and returned to the cargo tanks.
- A cascade system, which is a variant of the direct system, where evaporated cargo is compressed and condensed in a cargo/refrigerant heat exchanger and returned to the cargo tanks. Note – the IGC Code refers to the cascade system as a “combined” system.
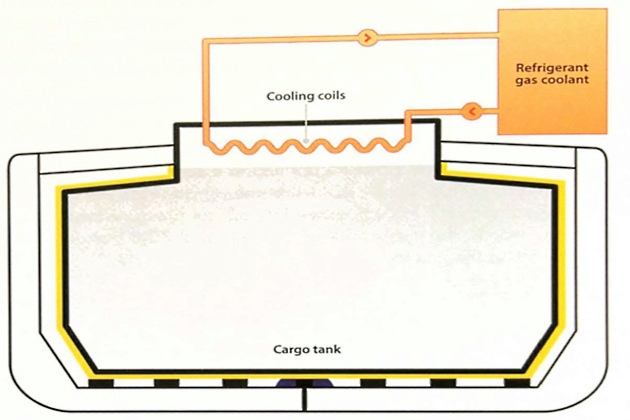
Indirect cycle
The indirect cycle is descriptive of a system where an external refrigeration plant is employed to condense the cargo vapour without it being compressed. This cycle is relatively uncommon as its use is limited to a small number of cargoes. It requires, for efficiency, a very cold refrigerant and large heat exchange surfaces. This type of reliquefaction plant is required by the IGC Code when carrying certain cargoes requiring Type 1G ships.
An indirect cycle system is shown diagrammatically in figure 12.
Direct cycle
The direct cycle is descriptive of a system that takes the BOG from the storage tanks (produced either from the heat ingress from the surrounding environment or during loading as flash and/or displaced gas), compresses it and then condenses it back to liquid before returning it to the tanks. Direct cycles are used on some LPG and chemical gas carriers, where their use is not precluded by the IGC Code (see indirect cycle above).
The pressure to which the gas has to be compressed is governed by the temperature of the seawater, which is used to condense the gas. If the reliquefaction system removes heat from the cargo tanks (by the action of removing vapour and returning liquid) at the same rate as is input from the environment, the pressure will be maintained at a constant level in the tanks. If the system removes heat faster than it is input, the temperature and pressure of the cargo will be reduced (ie cooling down of the cargo).
The thermodynamics of a single stage cargo refrigeration cycle
A single stage cargo reliquefaction system onboard a gas carrier generally operates in a similar way to a domestic refrigerator, but with the cargo as the working fluid. The thermodynamic performance of the system can be understood with reference to the gas laws and laws of thermodynamics. A simplified diagram of a single stage direct reliquefaction cycle is shown in figure 13.
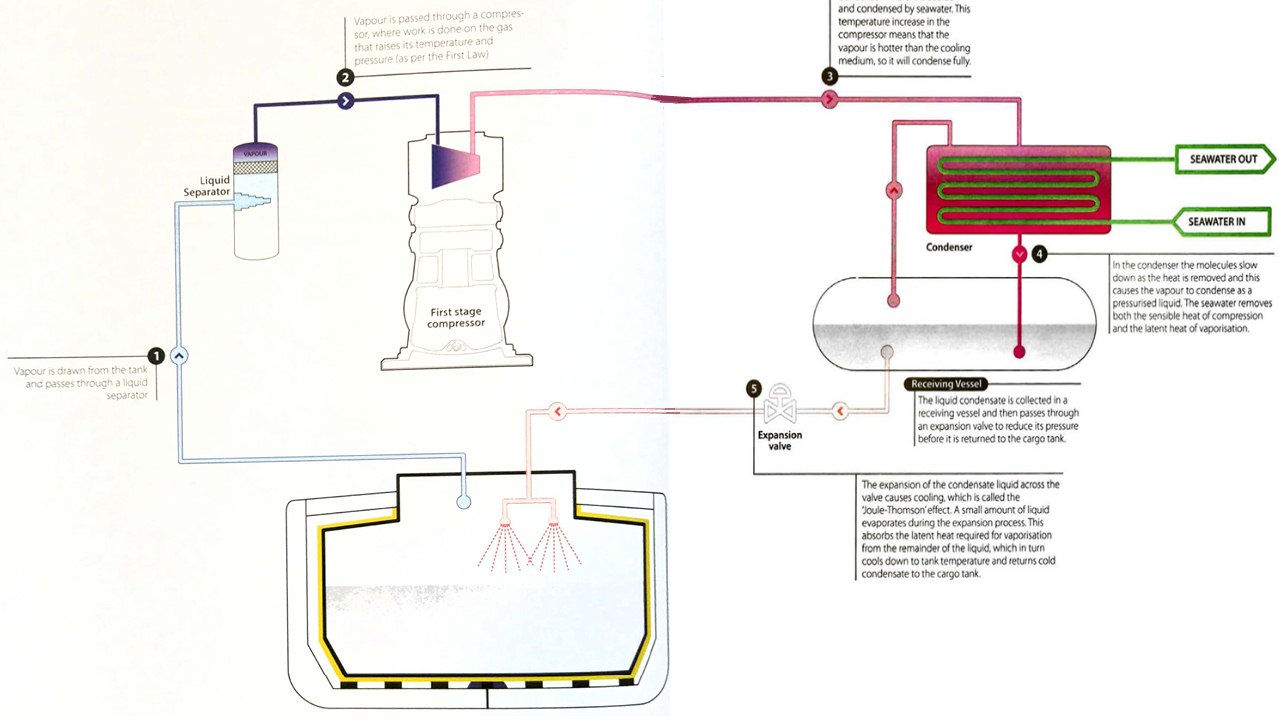
The cargo tank contains cold liquid. Even though insulated, heat will flow in to the system from the outside in accordance with the Second Law. This heat will overcome the latent heat of vaporisation and evaporate some of the cargo, which will in turn increase the cargo tank pressure.
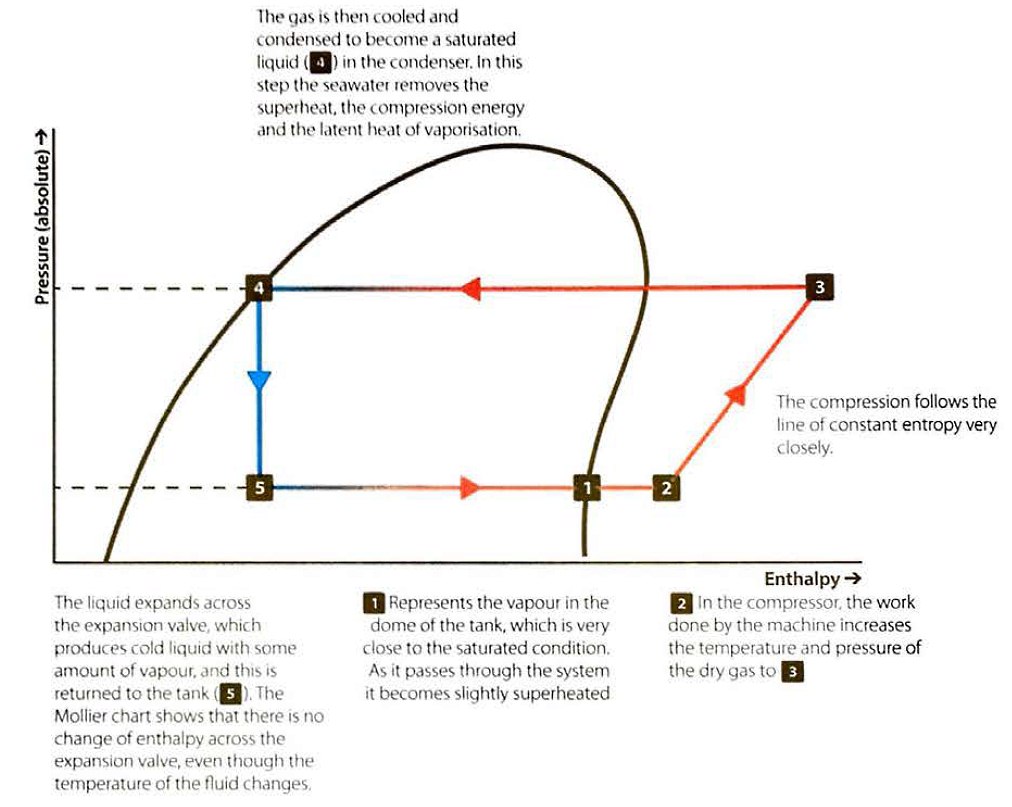
We can analyse the process using a Mollier chart. To keep the cargo tank pressure consta nt, any heat entering the tank has to be extracted in the liquefaction process, together with any heat introduced by the compressor. While the condensate temperature decreases as it passes through the expansion valve, this is only due to the Joule-Thomson effect. There is no change of enthalpy in the condensate and the expansion process follows a vertical line on the Mollier chart. This is because the latent heat a bsorbed for the vaporisation exactly matches the change in sensible heat a s the condensate cools.
The real cooling effect of the cycle is the removal of sensible heat and the latent heat of vaporisation from the full flow of gas as it is condensed, cooled and returned to the tank.
Effect of cargo composition on the cargo reliquefaction cycle
Chemical feedstock cargoes, such as ethylene and propylene, are usually carried in a very pure state that simplifies the use of Mollier charts.
However, many cargoes are hydrocarbon mixtures, notably LPG. As discussed in point “The bubble point’ and “dew point” of mixtures” above, the boil-off vapour contains a higher proportion of the more volatile component than the liquid phase does. This affects the performance of the reliquefaction plant.
For example, if a refrigerated propa ne cargo contains 4 % (mole) ethane in the liquid phase when at 1,1 bara, the phase diagram, figure 15, shows that the boil-off vapour will contain 22 % (mole) ethane.
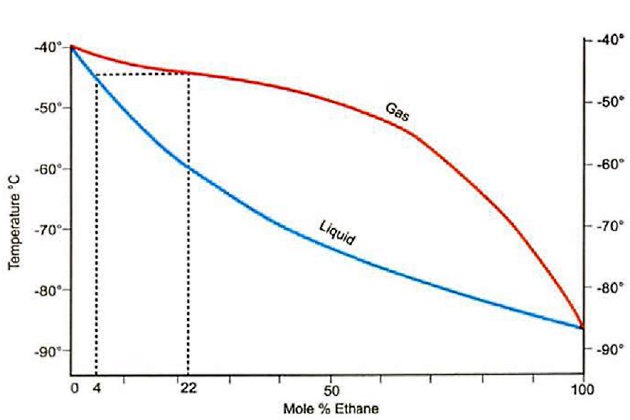
Pressure = 1,1 Bara: Mole % propane = 100 – Mole % ethane
This composition reduces the mass flow through the compressor when compared to pure propane, which in turn reduces the cooling capacity of the system. Higher ethane content also raises the condensing pressure of the vapour, which reduces the compressor capacity.
The thermodynamics of 2- and 3-stage reliquefaction cycles
The single stage reliquefaction system described has limitations, especially in cases where the cargo tank pressure is low and the seawater temperature is high, which increases the compression ratio required. To reduce the adverse effect of compression ratio on the overall cycle efficiency, the compression can be carried out into two stages.
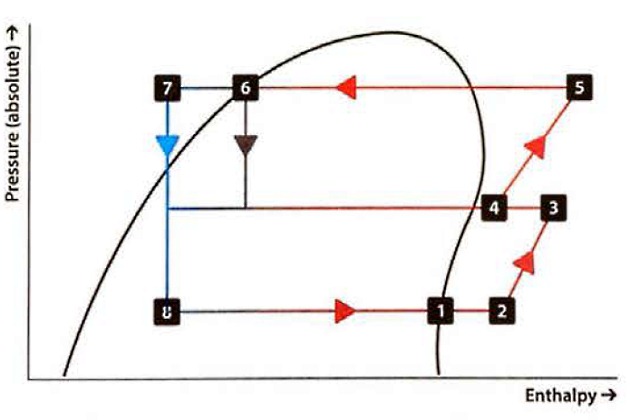
The basic principle is the same as before. Total Weight of Vapour CargoCargo vapour from the tank passes to the first compression stage then, if necessary, it is cooled before entering the second stage compressors to prevent excessive final discharge temperatures. If cooling is needed, the second stage suction vapour passes through an “intercooler”, which is part-full of cool liquid. A small amount of this liquid evaporates to reduce the vapour temperature. The liquid in the vessel is replenished from the condensate returning back to the cargo tank and this condensate is cooled further as it passes through a coil in the intercooler (which is sometimes called an “economiser“). Great care is required when operating the intercooler to avoid liquid entering the second stage of the compressor and causing serious damage.
The Mollier chart shows the process with the numbers on the chart corresponding to those on the diagram of the plant.
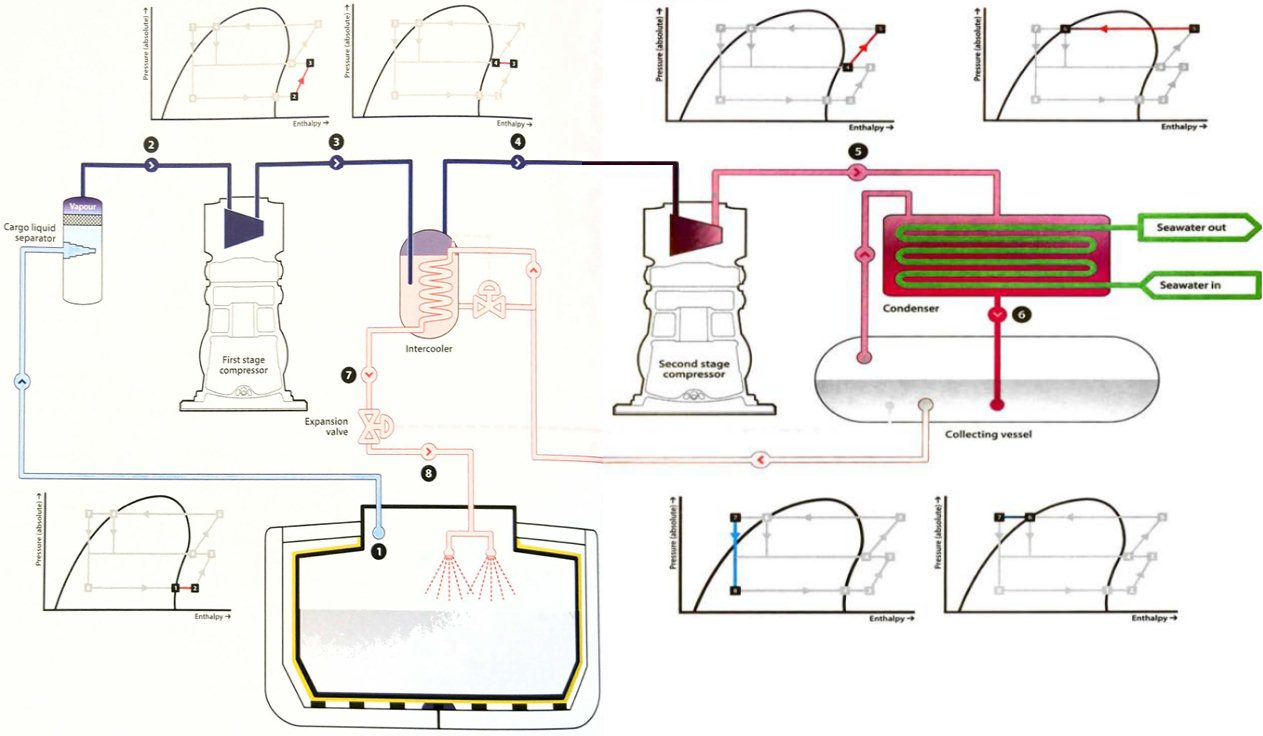
Some ships have 3-stage compression cycles, which operate in a very similar manner.
Cascade cycle
If the critical temperature of the cargo is above the temperature of seawater, as is the case for methane, ethane and ethylene in particular, condensation requires the use of a refrigerant. The cascade system uses two or more vapour compression cycles in series, hence the name “cascade“. A simplified diagram for a cascade cycle using a single refrigerant is shown in figure 18.
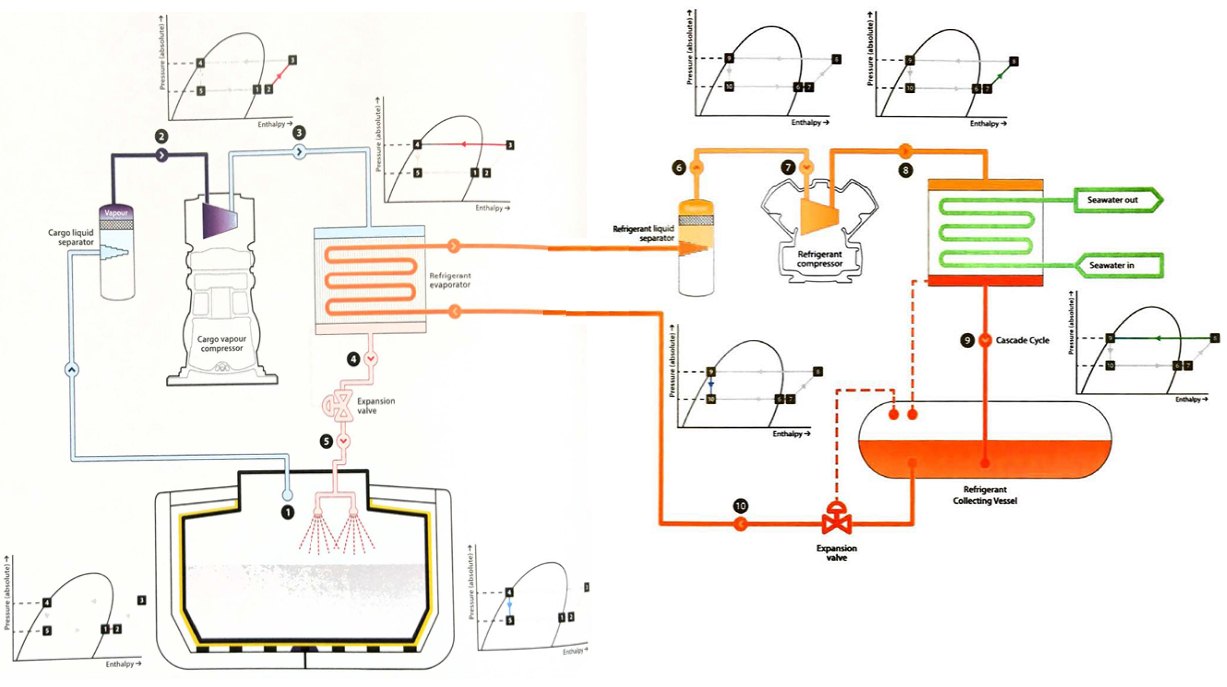
The single stage compression of cargo vapour is identical to the single stage direct cycle, but the cargo condenser is cooled using a refrigerant instead of seawater. The cargo, in the process of condensing, evaporates the liquid refrigerant, with the subsequent refrigerant vapour then taken through a conventional closed-loop refrigeration cycle and condensing against seawater.
Cascade cycles involve more machinery and are more complicated to operate. However, the cooling work is split between the compressors and improves the overall efficiency of the reliquefaction cycle.
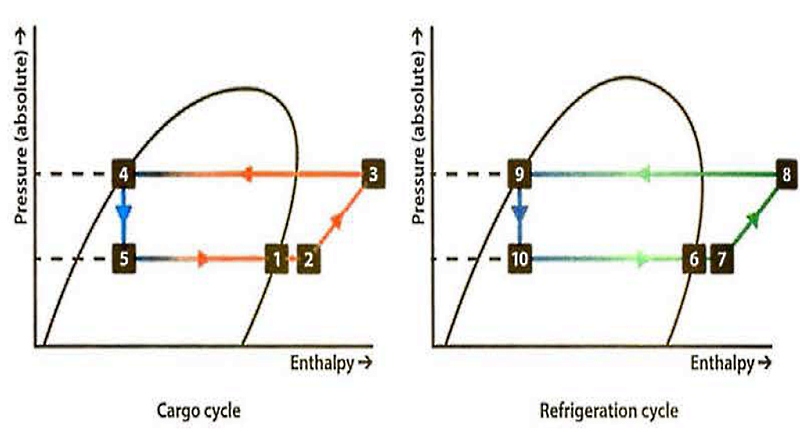
The Mollier charts can again be prepared to show how the plant is operating, with one chart representing the cargo cycle and the other the refrigeration cycle.
LNG reliquefaction cycles
As the boiling point/condensing temperature of the cargo gets lower, more complex reliquefaction systems are required. This is especially true for cryogenic cargoes, such as LNG, which, being a mixture of various hydrocarbons and nitrogen, requires the condensation to be done over a wide temperature range. A simple refrigeration cycle may not be an efficient solution.
Liquefaction processes in operation have a wide range of complexity. They differ in efficiency and size. By adding units or stages, the efficiency may increase, but the size and weight will also increase. Onshore liquefaction plants are outside the scope of this publication, but a general overview of the systems is provided as background when discussing shipboard and floating LNG facility (FLNG) reliquefaction. Generally, onshore facilities do not have strict weight and size constraints so their efficiency is higher, as is the production rate. They can have both a higher equipment count and a large amount of refrigerant storage. On board ship or offshore faci lities, by contrast, space is limited and equipment needs to be robust enough to respond to vessel motion. In addition, the use of hydrocarbon refrigerants on board ship or offshore facilities adds to the complexity of the design of the ship/facility.
It will be interesting: Structural Aspects of Liquefied Petroleum Gas Cargo Tanks Design and Construction
For shipboard applications, the temperature and pressure of the BOG can vary significantly over the course of a voyage, especially if the cargo is also being used as propulsion fuel. BOG composition can also change from voyage to voyage, and cargoes with higher nitrogen content in the LNG have significantly higher nitrogen content in the BOG, which will require significantly colder temperatures in the reliquefaction process, especially if full reliquefaction capacity (ie to match the design BOR) is applied.
LNG liquefaction processes can be broadly classified into three groups:
- Cascade processes.
- Mixed refrigerant (MR) processes.
- Nitrogen expander (turbine based) processes.
Refrigerants
There are many choices of refrigerants, but they mainly fall into two categories: pure component refrigerants or MRs. A pure refrigerant, such as propane, evaporates at a constant temperature. MRs comprise fluid mixtures of different hydrocarbons and nitrogen, with boiling temperatures which cover the whole temperature range.
Pure component refrigeration systems are simpler, but, as basic thermodynamic principles indicate, the most efficient liquefaction system is that which employs a refrigerant whose cooling curve best matches that of the gas being liquefied. Only nitrogen and methane have the capacity to cover the entire LNG liquefaction process by means of a simple vapour compression cycle.
Cascade refrigeration cycle for LNG
A simplified cascade refrigeration cycle is shown in figure 20, and consists of three stages, each using a different pure refrigerant.
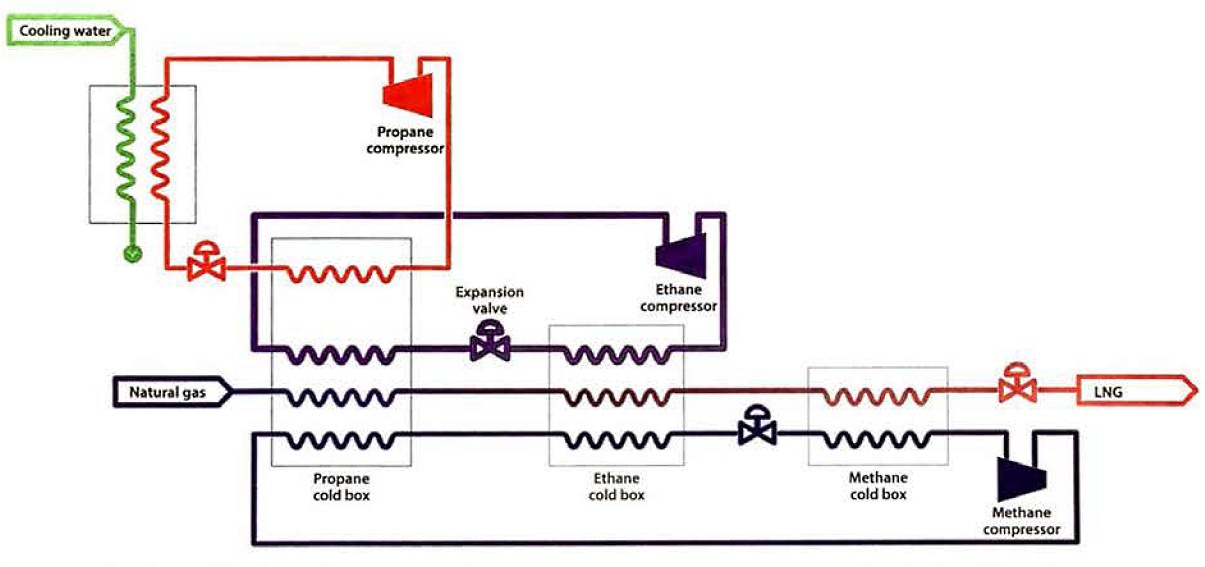
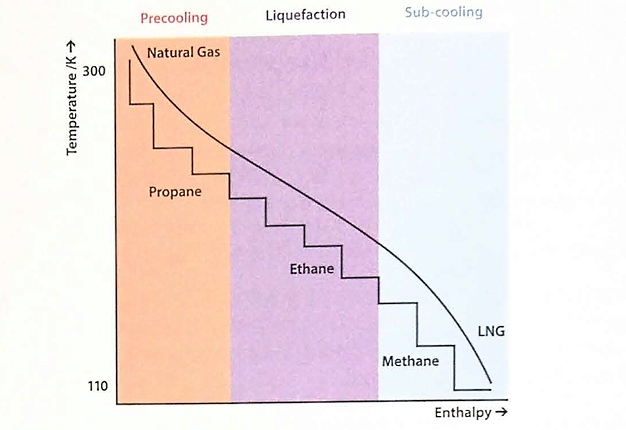
Only one stage for each refrigerant cycle is shown for simplicity, but additional stages can be employed to increase overall efficiency. Typically, each of the three refrigeration cycles would have three compression and expansion stages. Consequently, there are three evaporation temperatures for each refrigerant. Figure 21 shows the corresponding cooling curve for the overall cascade system.
Mixed refrigerant (MR) processes
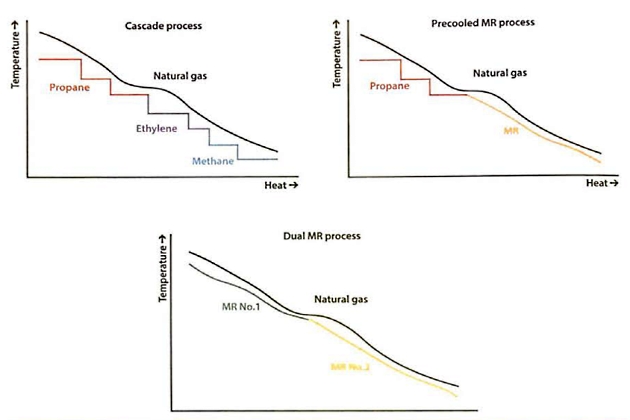
A single mixed refrigerant (SMR) process reduces the number of equipment items compared with the cascade process by employing an SMR whose composition (of hydrocarbons and nitrogen) is optimised to match the natural gas cooling curve as closely as possible.
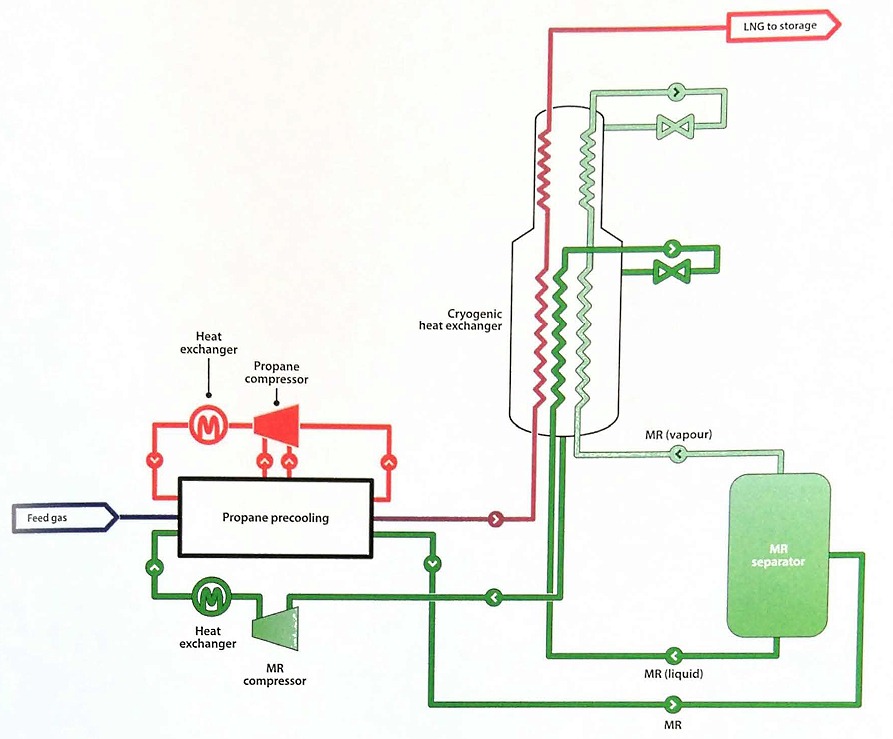
The precooled MR process combines the best attributes of the cascade and MR processes. In its most widely used configuration, a propane refrigeration system is installed in series with a separate MR system. The propane refrigeration cycle precools both the natural gas feed and the MR, and the MR in turn liquefies the natural gas feed. Figure 22 shows the simplified flow diagram for a precooled MR process using propane as the precoolant.
As an alternative to propane, precooling can be accomplished using a separate MR. This variation is known as a dual mixed refrigerant (DMR) process. The compositions of the MRs can be better optimised to match the cooling requirements of the natural gas feed.
Figure 23 shows the comparison of cooling curves for the various reliquefaction processes.
Nitrogen expander processes
The selection of process and refrigerant is greatly dependent on the gas feed composition. For shipboard applications, as noted previously, the system design will, amongst other things, need to take into account BOR fluctuations and composition throughout the voyage. The systems employed on LNG carriers utilise nitrogen as the refrigerant as it is non-toxic and non-flammable. In addition, the nitrogen cycle is a single-component, single-phase (ie all vapour) system that can be manufactured onboard, if needed.
Refrigeration is provided by nitrogen expander process based on a simple Brayton refrigeration cycle. The Brayton refrigeration cycle is also commonly called the reverse-Brayton thermodynamic cycle (the Brayton cycle representing the operation of a gas turbine engine).
A diagram of the ideal Brayton refrigeration cycle is provided in figure 24. In the ideal cycle, warm, low-pressure gas is compressed isentropically. The resulting stream is cooled at constant temperature while rejecting heat to the ambient environment.
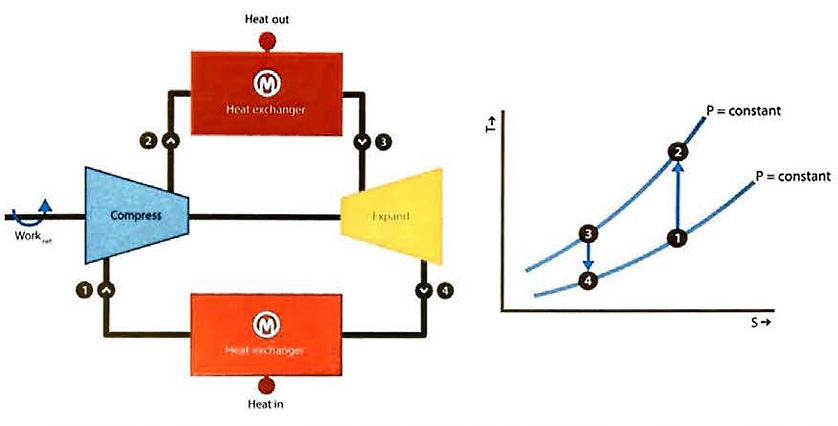
The cooled stream is then expanded isentropically, and the work is extracted to produce a cold refrigerant stream. This cold stream is then warmed while providing refrigeration.
The application of the Brayton refrigeration cycle to the reliquefaction of LNG is shown in figures 25 (a) and 25 (b). In figure 25 (a), the nitrogen is easily compressed and, upon expansion, reaches a temperature that is colder than the liquefaction temperature of the gas feed. The efficiency of the process can be improved by adding multiple levels of expansion, as shown in figure 25 (b).
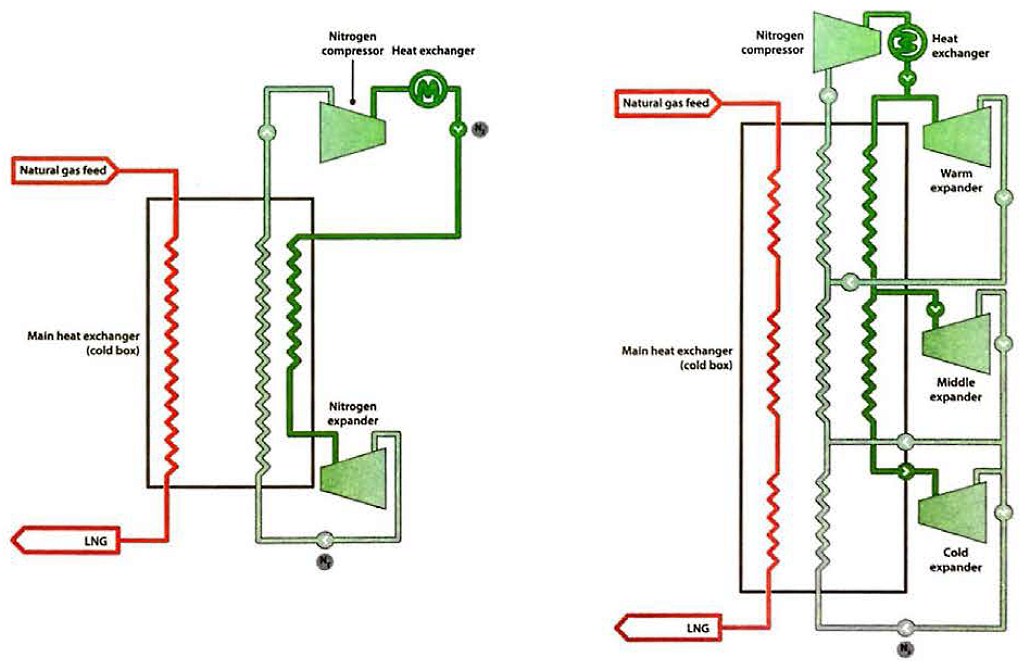
a – nitrogen expander cycle; b – 3-stage nitrogen expander cycle