To calculations of LNG parameters, LNG volume, density at a certain temperature and pressure, energy content, storage capacity and evaporation rate are usually taken into account.
- General
- Data handling: quality
- Data processing
- Data treatment
- Density
- General
- Density calculation methods
- Revised klosek-Mckinley method
- Gross calorific value
- General
- Method of determination of the gross calorific value
- Energy displaced or consumed
- Energy of gas displaced from the LNG tanks
- Energy of gas consumed as fuel by the LNG carrier
- Energy transfer determination
- Energy transfer measurement
- Uncertainty of the energy transfer determination
- Volume
- Cargo Liquid Lines
- Density
- Gross calorific value
- Sampling and vaporization
- Gas displaced
- Gas consumed in engine room
- Combined standard uncertainty and expanded uncertainty of the energy transfer determination
- Rounding of numbers and commercial impact
These parameters play an important role in the design, storage and processing of LNG. Such calculations are necessary for efficient work with LNG.
General
The LNG sampling and vaporization equipment is key to Custody Transfer measurements as far as the determination of LNG quality is concerned. The aim of this equipment is to take representative LNG samples from the LNG transfer line and then to turn the liquid phase of the sample flow into the gas phase while avoiding any fractionation and selective vaporization.
Then the regasified sample flow is carried through a suitable small diameter tubing to a gas chromatograph for continued gas analysis. Typically, an on-line GC is used for this purpose as described in ISO 8943.
Provided that the whole system works properly and is correctly calibrated, the gas analysis provided by the gas chromatograph and its integrator provides the molar composition of the LNG and so reflects the transferred LNG quality. In this way, and based on this molar composition, relevant LNG properties such as gross calorific value and density can be calculated from the composition.
Modern sampling and vaporization units are complemented with auxiliary devices such as pressure transmitters, temperature devices, flow meters, etc. for control purposes.
In general, all signals coming from the auxiliary devices, gas chromatograph, etc. are transmitted to a distributed control system (DCS) for control and monitoring. That means that a lot of information is available for subsequent processing and treatment.
During Liquefied Petroleum Gas Reliquefaction Plant and Boil-Off ControlCustody Transfer process a set of LNG compositions provided by GC is available. Since one unique LNG composition is necessary for calculating LNG relevant properties involved in the determination of the energy transferred, procedures and guidelines have to be stated and defined to deal with the available information.
Data handling: quality
The molar LNG composition provided by the gas chromatograph is used to derive LNG properties. Normally density and gross calorific value are calculated by correlations and procedures from an average LNG molar composition (see belove). If suitable routines are included in the gas chromatograph software it may be used to calculate these properties directly using temperature as an additional parameter.
The set of LNG compositions provided by the gas chromatograph(s) during the Custody Transfer process must be managed to produce a representative composition for the whole LNG (un)loading operation.
That is performed in two steps: processing and treatment.
Data processing
The aim of this step is to eliminate those LNG compositions which were produced by analyses in a period of time during which some operating parameters were outside pre-set limits.
For instance, when:
- the sampling rate is lower than a pre-set value of regasified LNG flow (e. g., 1,0 m3(n)/h);
- the pressure at the sampling point is lower than a pre-set value, e. g., 2 bar (gauge);
- ship’s LNG cargo discharge pumping rate is lower than a pre-set value, e. g., 70 % of nominal rate;
- other criteria particular to the analyses.
After performing this data processing step, a subset of acceptable LNG compositions is ready for data treatment.
Data treatment
The aim of the data treatment is to obtain, from a statistical point of view, a robust and consistent result that best reflects the quality of the whole transferred LNG.
This step consists of:
- performing a statistical test for each analysis and each LNG component in order to determine the presence of outliers;
- evaluating the elimination or not of the detected outliers (the whole analysis must be eliminated);
- calculating the average composition from the analyses not being rejected;
- normalizing the final LNG composition.
There are different approaches to determine the presence of individual values in a set of data that may be inconsistent and may change the final result: graphical consistency technique and numerical outlier tests. These techniques are explained in ISO 5725-2 standard. One of the numerical tests recommended in this standard for dealing with outliers is the Grubbs’ test. Below shows the procedure to apply this test as well as a numerical example.
Grubbs’ test
Grubbs’ test is specified in ISO 5725-2 standard, as follows:
One outlying observation
Given a set of data xi for i = 1, 2, …, p, arranged in ascending order, to determine whether the largest observation is an outlier using Grubbs’ test, compute the Grubb’s statistic, Gp:
where:
and
To test the significance of the smallest observation, compute the test statistic G1:
a) If the test statistic is less than or equal to its 5 % critical value, the item tested is accepted as correct.
b) f the test statistic is greater than its 5 % critical value and less than or equal to its 1 % critical value, the item tested is called a straggler and is indicated by a single asterisk.
c) If the test statistic is greater than its 1 % critical value, the item is called a statistical outlier and is indicated by a double asterisk.
Two outlying observations
To test whether the two largest observations may be outliers, compute the Grubbs’ test statistic G:
where:
and
and
Alternatively, to test the two smallest observations, compute the Grubbs’ test statistic G:
where:
and
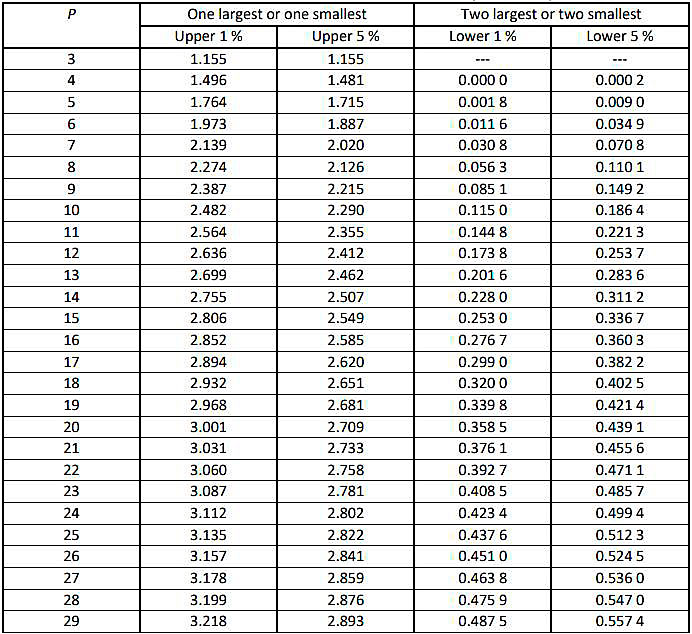
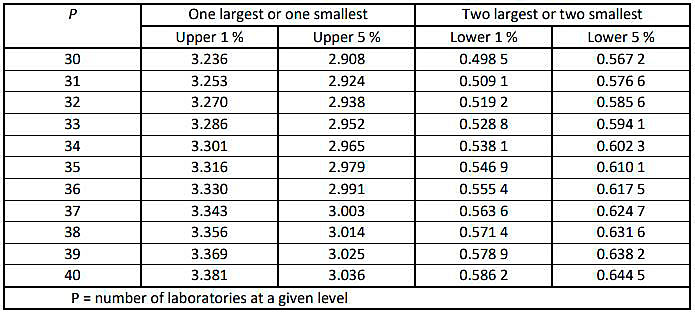
Critical values for the Grubbs’ test are given in table 5 of ISO 5725-2 (see Table).
Application of Grubbs’ test
When analysing a precision experiment, Grubbs’ test can be applied as follows: Apply the Grubbs’ test for one outlying observation. If it is shown to be an outlier, exclude it, and repeat the test at the other extreme (e. g. if the highest is an outlier then look at the lowest with the highest excluded), but do not apply the Grubbs’ test for two outlying observations. If the Grubbs’ test does not show any observation to be an outlier, then apply the double-Grubbs’ test.
Note: p = 147.
Numerical example
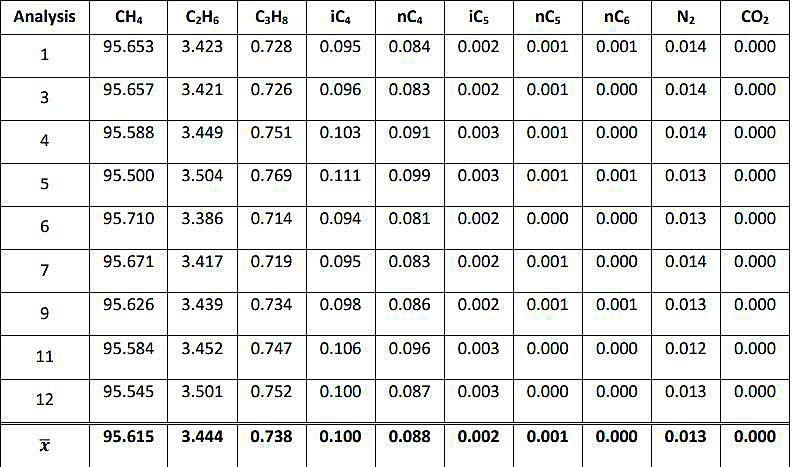
Below, the Grubbs’ test is applied to an example of GC analyses of vaporized LNG, in order to determine the presence of outliers, and eliminate them before calculating the average LNG composition. Table shows the data from the GC.
Note that if one component is detected as outlier, the whole analysis must be eliminated.
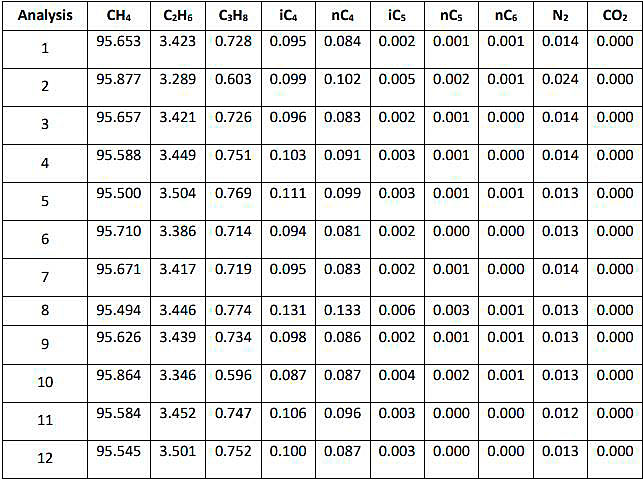
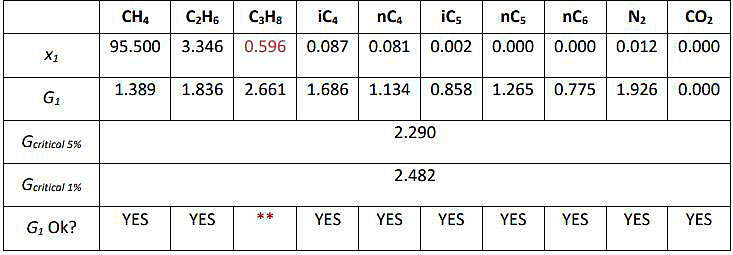
Firstly, the Grubb’s statistic Gp is calculated for each LNG component and compared to the critical values (see Table ). The values of Gcritical are obtained from Table, for p = 12.
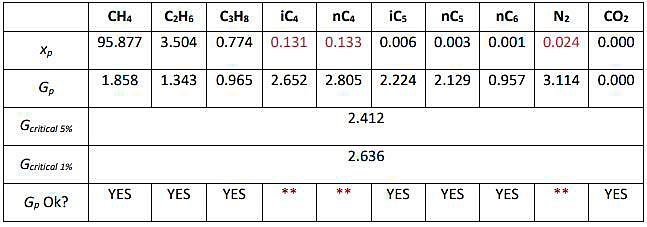
As it is shown in Table , the highest values for the components iC4, nC4 and N2 have been detected as outliers; thus, the two analyses containing these values are excluded (analyses 2 and 8). Next, the test is repeated to the 10 analyses remaining, computing the G1 statistic. The values of Gcritical are obtained from Table, for p = 10.
The lowest value of propane is detected as outlier, and the analysis 10 where it is contained is excluded. Finally, the average composition is calculated with the 9 analyses that have been accepted as correct by the Grubbs’ test.
This data treatment step results in a final LNG molar composition, representative for the whole LNG (un)loading operation, from which the relevant LNG properties can be calculated.
Density
General
There are two ways of determining density:
- the first consists of measuring its average value directly in the LNG carrier’s tank by means of densitometers;
- the second enables the density to be calculated on the basis of an average composition of LNG.
- In-situ measurement with the help of a densitometer takes into account the LNG state of equilibrium and composition, which means that one no longer depends on product sampling and analysis. It would therefore seem to be the best method for measuring the LNG density. Unfortunately, technological progress has not reached the stage where it is possible for a reliable apparatus to be available on board a LNG carrier under normal operating conditions. This is why the second method, which enables the density to be calculated from the LNG average composition, is the one that has been selected here.
Density calculation methods
A variety of calculation methods exists, such as:
- state equations in their integral form;
- method of extended corresponding states;
- hard sphere model method;
- WATSON method;
- ELF-AQUITAINE method;
- graphic method of RC MILLER;
- HIZA method;
- revised KLOSEK-McKINLEY method k1 and k2 tables in Kelvin: K);
- ISO 6578, also using the revised KLOSEK-McKINLEY method (k1, k2 tables in degrees Celsius: °C).
In this handbook, the preferred method is the revised KLOSEK-McKINLEY method, as described in NBS Technical note 1030 December 1980 or in ISO 6578. It is easy to apply and only requires the LNG temperature and composition to be taken into account. The limits of the method also encompass the composition of most LNG produced. Its uncertainty is ±0,1 %, when either the nitrogen or butane content does not exceed 5 %. For these density calculations an electronic spreadsheet or a computer program is often used.
Comparison between the revised KLOSEK-McKINLEY method using tables in Kelvin (NBS) and tables in degrees Celsius (ISO 6578:1991) indicates that they are very similar with a relative difference of about 10-4. Tables according to NBS only mention components up to C5 however, while tables according to ISO 6578 mention components up to C6.
Revised klosek-Mckinley method
Limits of the method
The method can be used within the following limits on composition and temperature:
Formula
This method is based on an empirical evaluation of the molar volume of the mixture in the thermodynamic state of the LNG considered. The density of LNG is calculated as follows:
where:
DLNG – density of LNG;
Mmix – molecular weight of the mixture:
- ΣXiMi:
- Mi – molecular weight of pure component i;
- Xi – molar fraction of component i;
Vmix – molar volume of the mixture expressed in l/mol:
- ΣXi Vi – [k1 + (k2 – k1) · (XN2/0,0425)] · XCH4:
- Xi – molar fraction of component i;
- Vi – volume of the component i at the temperature of the LNG;
- k1, k2 – correction factors.
Tables for calculation according to NBS can be found below. For tables according to ISO 6578, we refer to the standard itself.
Gross calorific value
General
The gross calorific value (GCV) of gas corresponds to (definition according ISO 6976) the amount of heat that would be released by the complete combustion with oxygen of a specified quantity of gas, in such a way that the pressure p at which the reaction takes place remains constant, and all the products of combustion are returned to the same specified temperature t as that of the reactants, all of these products being in the gaseous state except for water, which is condensed to the liquid state at t.
A coherent set is generally selected from the following reference conditions:
- for the determination of GCV:
- t – 0 °C or 15 °C or 15,56 °C (60 °F) or 20 °C or 25 °C;
- for the volume condition:
- p – 1,01325 bar absolute (14,696 psia) or, sometimes, 1,01560 bar absolute (14,73 psia);
and
- t – 0 °C, 15 °C, 15,56 °C (60 °F), 20 °C or 25 °C.
Unless mentioned otherwise the reference conditions considered in this handbook will be:
GCV and Wobbe:
- t – 25 °C.
Gas volume:
- p – 1,01325 bar absolute;
- and t – 0 °C;
referred to as «normal conditions», for which the volume is indicated in m3(n).
Remark: within the European natural gas transmission community these reference values have been established as EASEE-Gas Common Business Practice (CBP)
OTHER RELEVANT STANDARDS & REFERENCES:
1 GPA 2261, Gas chromatography: «Analysis for Natural Gas and Similar Gaseous Mixtures by Gas Chromatography».
2 GPA 2172, Calculation of GHV, Relative Density, Compressibility and theoretical hydrocarbon liquid content for custody transfer.
3 GPA 2145, Table of physical properties for hydrocarbons and other compounds of interest to the natural gas industry (to be used with GPA 2172).
4 ASTM D1945, standard test method for analysis of natural gas by gas chromatography.
5 ASTM D6228, Standard Test Method for Determination of Sulfur Compounds in Natural Gas and Gaseous Fuels by Gas Chromatography and Flame Photometric Detection.
6 HM 21, Calculation procedures for static and dynamic measurement of light hydrocarbon liquids (LNG, LPG, ethylene, propylene and butadienes (replaces IP 251/76).
7 ASTM E 29-13, Standard Practice for Using Significant Digits in Test Data to Determine Conformance with Specifications.
8 General EN standards for LPG facilities:
- EN 1473 – Installation and equipment of LNG – design of onshore installations.
- EN 1474 – part 1, 2 and 3, installation and equipment for LNG – Design and testing of marine transfer systems.
9 INCOTERMS 2010, defining duties of seller and buyer among others:
- FOB – Free on Board (named port of loading).
- CIF – Cost, Insurance and Freight (named port of discharge).
- DES – Delivered Ex Ship (port of discharge) (INCOTERMS 2000)
10 JCGM 100, Evaluation of measurement data – Guide to the expression of Uncertainty in Measurement. JCGN 200, International Vocabulary of metrology. Basic and general concepts and associated terms (VIM)
Another common set of conditions for volume is called «standard conditions» (15 ⁰C, 1,01325 bara) for which the volume is indicated in m3(s). These are recommended by ISO.
In addition, the unit of energy will be kJ, which can be then converted to BTU according to the conversion factor table in ENCLOSURE 1: CONVERSION FACTOR TABLE FOR ENERGY UNITS (1), (2).
The LNG industry should conform to a standard reference condition for the calculation of GCV because the usage of different reference conditions, and the associated misunderstanding, for both LNG and displaced gas can have financial consequences for the buyer or seller of LNG.
Method of determination of the gross calorific value
The gross calorific value can be determined:
- by measurement with calorimeters;
- by computation on the basis of the composition of the gas and the reference data.
Determination with the help of calorimeters
Several types of calorimeters can be used, among them:
- manual calorimeters:
- deflagration calorimeters;
- with auxiliary fluid circulation exchanger;
- automatic calorimeters:
- water flow calorimeters;
- air circulation calorimeters;
- empirical calorimeters:
- with indirect measurement of the heat produced;
- infra-red absorption calorimeters;
- sonic velocity calorimeters;
- optical interferometer type calorimeters;
- rauter gas analyzers.
These devices enable the volumetric gross calorific value to be measured but, as LNG Custody Transfer requires the mass gross calorific value of LNG, the density of LNG must also be determined.
Since the composition of LNG is necessary for the calculation of the density of LNG (see above), the gross calorific value is always calculated from composition data as well. This explains why calorimeters are not used for the purpose of LNG Custody Transfer.
Determination of GCV by calculation
Examples of formula
a) GCV (volumetric) expressed in coherent units, e. g., in kJ/m3(n) or in kJ/m3(s), can be calculated, with one of the following formulae depending on whether the ideal gas or the real gas calorific values are considered:
1) Ideal gas GCV (volumetric):
or
where:
- Xi – molar fraction of component i;
- GCVi (mol) – molar gross calorific value of component i, expressed in kJ/mol;
- MVi – molar volume of component i, expressed in m3(n)/mol;
- ρv, Tv – gas volume metering conditions;
- R – molar gas constant 8,3144621 J/mol/K;
the physical constants GCVi (mol) and R being specified in coherent standards, e. g. all ISO, or all GPA.
Note on the «exact value» of the molar gas constant R. ISO 6976: 1995 mentioned R = 8,314 510 J/(mol.K) and referred to CODATA 1986. ISO 6976:2013 adopted the latest CODATA 2010 value of 8,314 462 1 J/(mol.K).
2) Real gas GCV (volumetric) = ideal gas GCV divided by the compressibility factor Z:
where:
- Xi – molar fraction of component i;
- GCVi (vol) – molar gross calorific value of component i, expressed in kJ/m3(n) or (s)
- Z – compressibility factor of the gas mixture;
the values of GCVi (vol) and the method of calculation of Z being specified in coherent standards.
ISO 6976 or GPA 2172 standard give methods for calculation of Z (and respectively ISO 6976 or GPA 2145 for GCV).
b) GCV (mass) expressed in kJ/kg can be calculated by one of the following formulae:
where:
- Xi – molar fraction of component i;
- GCVi (mass) – mass gross calorific value of component i, expressed in kJ/kg;
- Mi – molecular mass of component i, expressed in g/mol;
the physical constants GCVi (mass) and Mi being specified in coherent standards.
Note: In Japan the above formula is preferred.
or:
where:
- Xi – molar fraction of component i;
- GCVi (mol) – molar gross calorific value of component i, expressed in kJ/mol;
- Mi – molecular mass of component i, expressed in g/mol;
the physical constants GCVi (mol) and Mi being specified in coherent standards.
Examples of charts of basic physical constants. One of the following standards may be used to provide tables of physical constants and methods of calculation of factors necessary to determine the gross calorific value:
- ISO 6976;
- ASTM 3588;
- GPA 2145;
- GPA 2172;
- HM 21.
These standards, or other publications which are used, refer to the results of works enjoying international recognition, and except for ISO 6976, most of them, at least partly, to the works published by the American Petroleum Institute (A.P.I.), in Research Project 44.
Example of calculation. A worked example below.
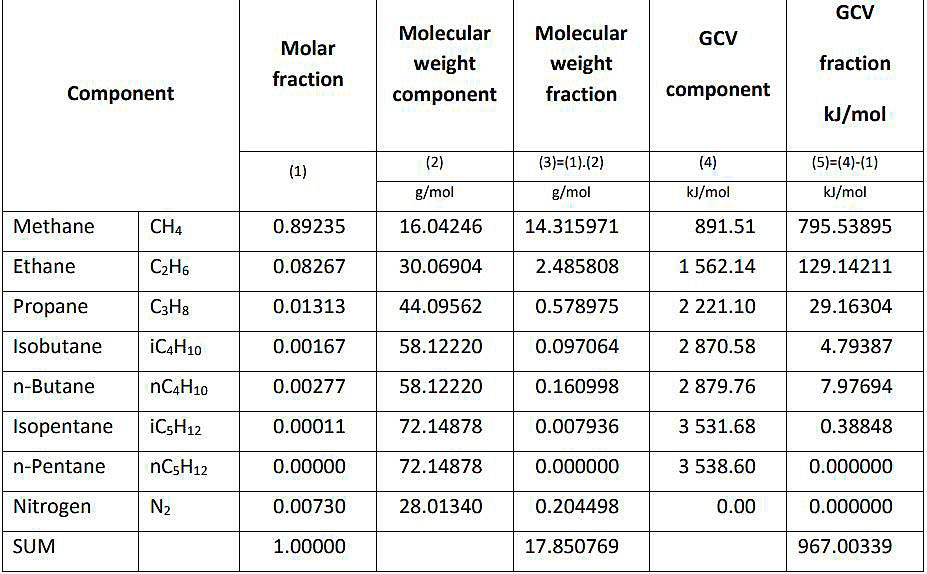
- The constants used in columns (2) and (4) are taken from ISO 6976:2016.
- The gross calorific value is calculated at 15 °C (not at 25 °C).
GCV = 967,00339/17,850769 MJ/kg; 54,171526 MJ/kg; 54,172 MJ/kg;
or = 54,171526 · 0,947817/1 000; 0,051345 MMBTU/kg.
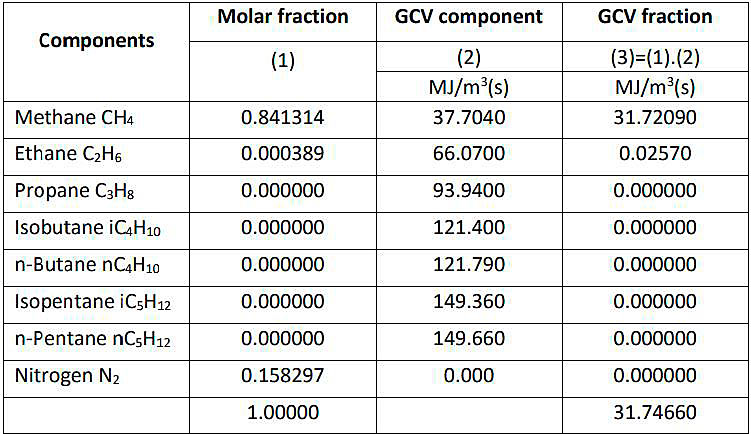
- The constants used in column (2) are taken from ISO 29922:2017.
- The gross calorific value is calculated at standard ISO conditions 15/15 °C (calorific reference temperature 15 °C, gas volume at 15 °C and pressure 1,01325 bara).
GCV = 31,74660 MJ/m3(s) (without Z, the compressibility factor).
Z factor is calculated at 15 ⁰C and constants taken from ISO 6976:2016.
Z = 0,998369.
GCV return gas = 31,74660/0,998369.
GCV (including Z factor) = 31,798463 MJ/m3(s);
or
GCV = 31,798463 · 0,947817/1000 = 0,030139 MMBTU/m3(s).
The worked example is based on the use of reference tables and methods of calculation specified in the ISO 6976 standard (1995 edition).
The calculations carried out, result in the mass based gross calorific value used for the determination of the energy of LNG transferred (Table see higher), and the volume based gross calorific value used for the determination of the energy of the gas displaced (Table see higher).
The formulae chosen here are as follows:
For LNG:
For gas displaced:
Note: In Japan the above (mass-based) formula is preferred also for gas displaced.
with Xi, GCVi (mol), Mi, MVi as defined above and Yi = molar fraction of component i in gas displaced.
It should be noted that the molar composition of the displaced gas is different from the LNG composition. It is determined either by gas analysis or calculated. Practical calculation is possible with a simple formula based on empirical Ki values for each component. Ki for each component is defined as an empirically determined ratio between the molar fraction in the gaseous state and the molar fraction in the liquid state of that particular component.
For practical displaced gas calculations, these Ki values are usually limited to the most significant ones i. e., of the components with the lowest atmospheric boiling points:
- nitrogen;
- methane;
- and sometimes ethane.
Considering the relatively small energy content of gas displaced compared with the energy of the LNG (un)loaded (typically less than 1 %), it is generally viewed that this simple calculation approach results in a sufficiently accurate overall calculation of energy transferred.
The calculations in the example show that the contribution of ethane vapor to the GCV of gas displaced is very marginal. Therefore, it can be argued that for simplicity it may even be dropped in the calculation of this GCV. Nitrogen is then the only component of which the molar fraction should either be measured in the gas returned flow, or be calculated as shown in the example higher. The following typical Ki values for nitrogen, methane and ethane at near atmospheric pressure and temperatures around -160 °C are:
- KN2 – 23 (range: 20-26);
- KCH4 – 1;
- KC2H6 – 0,005.
The Ki values for any other component are assumed to be zero.
In this way, starting from the molar composition in the liquid state determined by LNG sampling and gas analysis, the molar composition in the gaseous state can be calculated. In the event that the sum of the thus obtained fractions does not equal 100 %, a linear correction of the value of each component must be carried out.
A standard analysis report could be as follows:
Identification:
- name of the ship;
- date;
- (un)loading terminal and port;
- country (origin and destination);
- beginning of loading/unloading;
- end of loading/unloading;
- reference number.
Basic data
Custody transfer data before and after (un)loading:
- level measurements in each cargo tank;
- temperatures of LNG and displaced gas;
- trim, list and thermal corrections in each cargo tank;
- volume in each cargo tank;
- mean temperature of the LNG;
- mean temperature of the displaced gas;
- summed volume of all cargo tanks before and after (un)loading.
Certificate of (un)loading:
- total volume (un)loaded = difference between volumes before and after (un)loading;
- cargo tanks pressure (absolute and/or gauge) and corresponding mean pressure.
- Port log.
- Notice of readiness.
- Results of continuous/discontinuous sampling (see Selection principles LNG samples and temperature on tankers“Sampling of LNG”).
- Number of (discontinuous) samples.
Result
For the transferred LNG and vapor (displaced gas, etc., see belowe):
- Net (un)loaded LNG volume (m3).
- Net (un)loaded LNG mass (tonne).
- Mean composition of LNG (mol %), including nC+.
- Molecular weight of LNG (kg/kmol).
- Pseudo-molar volume (m3/kmol).
- Corrected molar volume (m3/kmol).
- (Un)loaded LNG density (kg/m3).
- Gas density (kg/m3) at specified conditions.
- Mass gross calorific value (MJ/kg).
- Volume gross calorific value (MJ/m3(n)).
- Wobbe Index (MJ/m3(n)).
- Expansion ratio (m3(s)
m3 LNG). - (Un)loaded energy quantity (GJ).
- Vapor return energy quantity (MJ).
- Any gas to engine room energy quantity (MJ).
- LNG vessel energy consumption during (un)loading (MJ).
- Net (un)loaded energy quantity (GJ or MMBTU).
Energy displaced or consumed
To complete the calculation of net energy of the LNG transferred, the figure derived from the liquid volume calculation may be adjusted for:
- The gas sent back from the ship during the loading operation or the gas transferred to the LNG carrier during the unloading operation expressed in energy terms is determined as described below. This may be referred to as «buy-back» gas. This gas is not commercial natural gas nor vaporized LNG but BOG whose composition is mainly methane and some nitrogen.
- and the gas possibly consumed by the LNG carrier as fuel in the engine room or in the ship’s GCU (gas combustion unit) during the operation, determined as described below. This gas can be either BOG similarly to the «buy-back» gas if the ship takes its fuel gas in gaseous form directly from the vapor header, or vaporized LNG if the ship takes its fuel gas in liquid form from its cargo tanks with a small spray pump before the LNG gets regasified and injected into the engine/burner (e. g. ships with dual fuel motors).
Energy of gas displaced from the LNG tanks
This quantity is determined by the following formula, whether it is received by or sent back to the ship.
where:
- Egas – quantity of energy in gaseous form displaced during loading or unloading, expressed in MJ;
- VLNG – volume of the LNG loaded or unloaded, expressed in m3;
- ρ – absolute pressure in the tanks, expressed in bar;
- T – mean value of the temperatures of the probes not immersed in LNG, expressed in Celsius degrees;
- GCVgas – GCV of the gas in gaseous state contained in the ship’s tanks, expressed in MJ/m3(n) or MJ/m3(s) in accordance with ISO 6976.
As indicated in Mastering LNG Measurement – Essential Practices and Operational Insights“Instruments used”, the parameters ρ, T and GCVgas can be either measured, estimated, or taken as constants determined by experience. Any resulting inaccuracy would only concern the energy of gas displaced which represents less than 1 % (typically about 0,3 %) of the quantity of energy in the LNG transferred and may therefore be negligible. In Japan it is common practice to assume the return gas to be 100 % methane in the calculation of the energy of gas displaced.
For example:
- T – -140 °C;
- GCVgas – 36 MJ/m3(n);
- ρ – 1,150 bar.
and in this case, the formula can be simplified and becomes, with energy expressed in MJ:
Energy of gas consumed as fuel by the LNG carrier
The LNG carrier, subject to agreement of buyer and seller, may use gas as fuel in its engine room during the loading operation (FOB cargo) or unloading operation (CIF or DES cargo), between the opening and closing CTS.
This amount of energy can be determined:
For LNG vessels using boil-off gas as fuel:
- either by the measurement of the total volume of gas Vg consumed (if the gas flow meter on board the LNG carrier measures in m3) and the evaluation of the GCV of gas on a volumetric basis as described above.
With GCVgas in KWh/m3.
For LNG vessels using forced vaporization of LNG cargo, the quality of the LNG (un)loaded can be taken.
- Or by the measurement of the total weight of gas Wg consumed (when gas flow meter on board the LNG carrier measures in kg) and the evaluation of the GCV on mass basis of gas as described above.
For LNG vessels using forced vaporization of LNG cargo, the quality of the LNG (un)loaded can be taken.
- Or by a formula agreed by the seller and the buyer and based on the average gas consumption experienced for a given ship at the occasion of its first (un)loading whilst burning gas as fuel. For new LNG carriers, it is possible to differentiate the consumption in the engines and the GCU (gas combustion unit), because there are independent gas flow meters for engines and for GCU. However, for the old LNG carriers without separate gas flow meters this formula may take into account the duration of the operation, the electrical power consumption of the LNG cargo pumps and/or gas compressors (blowers) and ballasting pumps in operation in the time interval between the opening and closing custody transfer surveys (CTS) and the actual average efficiency of electrical power generators in the engine room. Considering that the amount of energy of gas consumed in the engine room is small compared with the overall uncertainty of the energy of the LNG transferred, parties may agree on a contractually assumed amount of energy of the gas consumed on board during the time interval between the opening and closing CTS’s.
For an LNG carrier of 125 000 to 145 000 m3 LNG with steam boilers and a steam turbine propulsion plant, the energy of the gas consumed in the engine room between the opening and closing CTS may typically amount to some 0,05 to 0,06 % of the total energy of LNG transferred.
Read also: LNGC Fatigue Assessment and Heating System
On the other hand, for an LNG carrier of 155 000 to 175 000 m3 LNG with dual fuel diesel electric propulsion, this percentage may rather be of the order of 0,04 % or even lower.
This percentage will depend on several factors:
- the ratio of BOG consumption versus total fuel consumption in the engine room;
- the energy technology on board the LNG carrier, refer the «Energy Efficiency Design Index» (EEDI);
- the power and energy management in place on board the LNG carrier, refer the «Energy Efficiency Operational Index» (EEOI);
- the time interval between the opening and closing CTS (e. g. extended if the LNG transfer rate has to be reduced for operational reasons);
- the size of the LNG carrier.
The above-mentioned typical percentages refer to standard (un)loading periods of some 12 to 14 hours. The percentage of energy of gas consumed as fuel by the LNG carrier would be higher if the duration of the LNG Gas analysis of LNG on tankerstransfer operation is increased or during a ship-to-ship transfer. But it could also be lower, for instance, when a ship is reloaded at an LNG regasification terminal and the ship’s cargo transfer pumps are not running. In this case the ship’s GCU (gas combustion unit) can be running as well in order to handle the boil-off gas produced, hence reducing the vapor sent back to the shore or ship being unloaded.
The quantity of BOG consumption due to terminal failure or special terminal request (not included in the terminal rules) should not be included in final energy delivery calculation.
For FSRU or FSU there are some circumstances, for which the unloading vessel is forced to burn BOG because the receiving facility does not have the contractually required BOG treatment capacity, e. g., due to insufficient send-out. Under these circumstances, if the unloading LNG vessel has to burn gas for safety reasons to avoid a risk of overpressure in its LNG tanks, the gas burnt in the GCU should not be included in the final energy delivery calculation unless this is contractually agreed.
Energy transfer determination
The activities required for proper custody transfer during LNG (un)loading are described in the previous sections of this handbook. When the measurements and calculations have all been completed the net energy transfer can be calculated by applying the formula in Mastering LNG Measurement – Essential Practices and Operational Insights“Calculation of energy transfer”.
Ship-to-ship LNG transfer operations“Example certificate framework. Energy transfer determination” gives an example framework for a quantity certificate for the LNG terminal’s and ship’s records of an unloading variation.
Energy transfer measurement
All elements enabling the determination of the energy transferred have now been determined. The formula for calculating the LNG transferred (mentioned in Mastering LNG Measurement – Essential Practices and Operational Insights“Calculation of energy transfer”) can now be applied within the framework of Ship-to-ship LNG transfer operations“Example certificate framework. Energy transfer determination” given as an example for:
- Quantity certificate at the LNG terminal;
- Unloading/loading certificate for commercial use.
Uncertainty of the energy transfer determination
The evaluation and expression of uncertainty in measurement shall be in accordance with the principles established in the ISO document Guide to the expression of uncertainty in measurement. The following sections describe the main sources of uncertainty for each variable involved in the energy transfer determination, in order to help users to elaborate the uncertainty budgets. Note that situations with malfunctions are not considered in the calculations.
Volume
There are many measurements involved in the determination of the volume of an LNG carrier. The uncertainty must take into account all of them, although some uncertainty contributions are negligible. The following table shows the main sources of uncertainty in the determination of the LNG volume (see typical values below).
UNCERTAINTY CALCULATIONS
Annex B (normative) of ISO 6976 establishes the following equation to calculate the uncertainty of the gross calorific value on mass-basis:
where:
- (Hc)G – gross calorific value on a molar basis (kJ/mol);
- – ideal gross calorific value on a molar basis (kJ/mol);
- (Hm)G – gross calorific value on a mass basis (MJ/kg);
- M – molar mass (kg/kmol);
- u – standard uncertainty;
- x – mole fraction (-)
NEXT, THERE IS AN EXAMPLE CALCULATION OF THE GCV UNCERTAINTY FOR THE COMPOSITION OF A TYPICAL LNG CARGO
The resulting GCV on mass basis and expanded uncertainty (k = 2) are 54,788 ± 0,024 MJ/kg:
- GCV – 54,787 912 MJ/kg;
- U(GCV) – 0,024 MJ/kg, 0,043 %.
Note: ISO 6976 establishes that the expanded uncertainty shall be rounded to two significant figures, using the normal rules of rounding. The numerical value of the property shall be rounded to the least significant figure in the rounded value of the expanded uncertainty.
For the gross calorific value, the determination of the uncertainty is specified in the ISO standard. However, there are no standards or specifications that establish a detailed uncertainty determination for volume and density.
As a help in the elaboration of the uncertainty determination, typical values of the sources of uncertainty in LNG volume are listed below. Additionally, a brief explanation of the Monte Carlo simulation carried out to determine LNG density uncertainty is given.
Volume:
The following table shows typical values of the sources of uncertainty in LNG volume:
| Sorces of uncertainty in volume | |
|---|---|
| Source of uncertainty | Typical Value |
| Gauge tables | Typically from 0,02 % to 0,3 % (k = 2) |
| Intrinsic Level gauge | Tolerance from ISO 10976: ± 7,5 mm (k = √3) |
| Liquid temperature | Tolerance from ISO 10976: ± 0,2 °C(a) (k = √3) |
| Vapor temperature | Tolerance from ISO 10976: ± 1 °C (k = √3) |
| List (if applicable) | Typical calibration tolerance: ± 0,1 m (k = 2) |
| Trim (if applicable) | Typical calibration tolerance: ± 0,5 ° (k = 2) |
| Tank thermal expansion factor (Spherical tanks) | 10 % (k = 2) |
| (a) Sometimes, a more conservative value of ± 0,5 °C is used. | |
Density:
The LNG density is calculated according to the revised Klosek-McKinley method:
where:
The uncertainty in the density is therefore depending on the uncertainty in:
- Xi – being the mole fraction of each constituent determined by analysis;
- Mi – being the Molecular weight of each of the constituents;
- Vi – being the Molecular volume depending on the temperature of the LNG;
- XM – being the mole fraction of Methane determined by analysis;
- XN – being the mole fraction of Nitrogen determined by analysis;
- K1 and K2 being the correction factors for volume reduction of the LNG mixture depending on LNG temperature and the Molecular weight of the mixture as determined by analysis.
Due to the complex interaction between the uncertainties of all individual contributors a Monte Carlo simulation is used to calculate the total uncertainty of the LNG density.
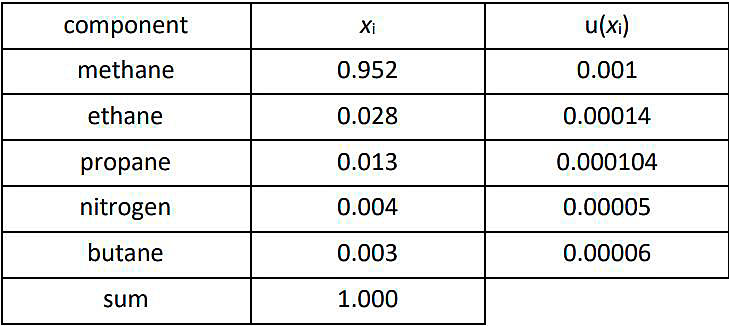
Following uncertainty sources are taken into account.
Where u (xN) is calculated according below formula:
where:
uxm is calculated according below formula:
where:
The uncertainties on molecular mass and molecular volume are based on the measurement of individual components by gas chromatograph is calculated following ISO 6976:
Additional the molecular volume temperature uncertainty is included according below formula:
Both k1 and k2 are depending on molecular weight and LNG temperature and given in tables. The possible error in these values is estimated from maximising the uncertainty in molecular weight and LNG temperature maximum on the interpolations done to get the values for k1 and k2. This error is taken as the standard uncertainty. The combined uncertainty on these correction factors is determined by:
For calculating the uncertainty of the LNG density the contributors with their uncertainty references are:
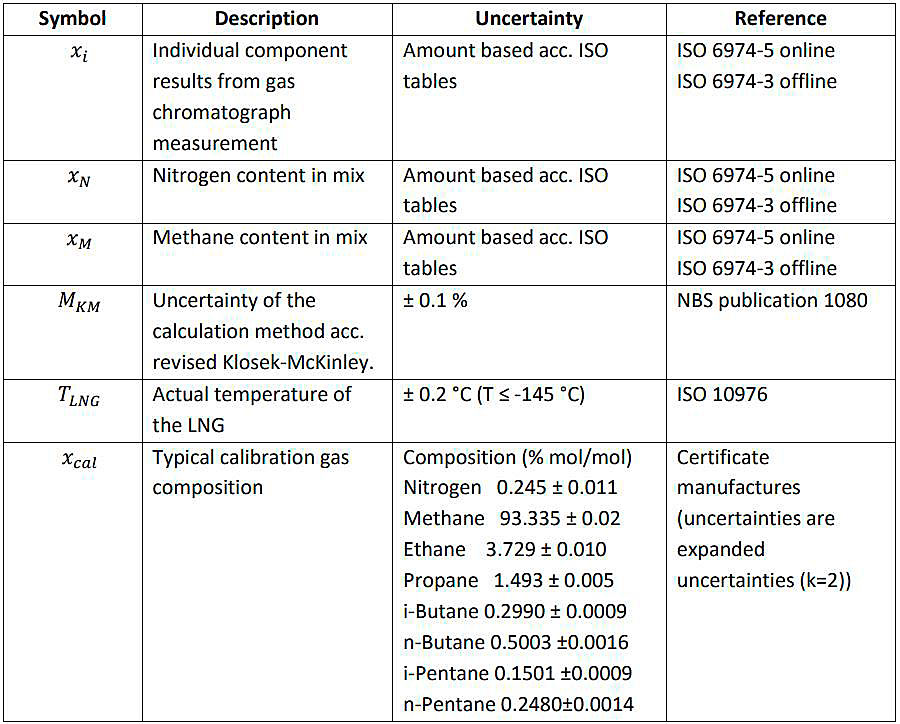
A Monte Carlo simulation based on 10 000 iterations taken into account the following individual uncertainties for the individual contributors as described in above:
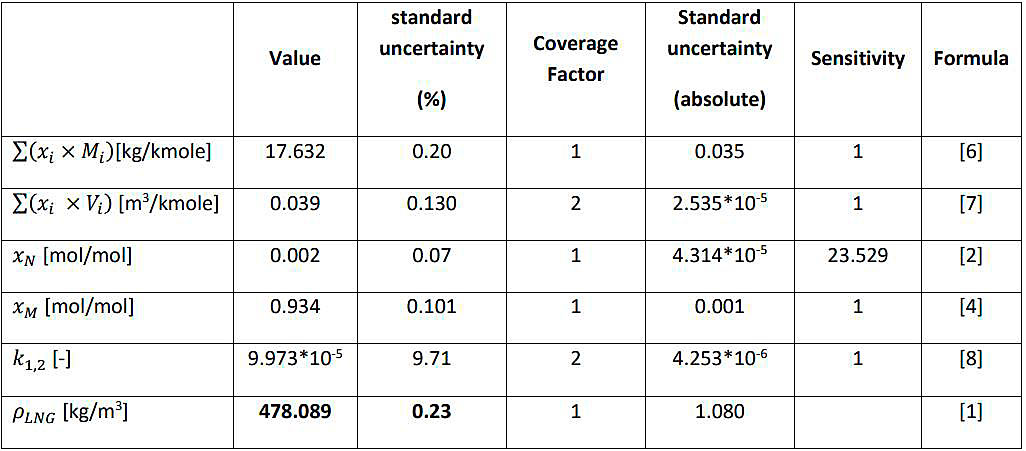
Resulting in a standard uncertainty of 0,23 % (k = 1):
ρLNG = (478,09 ± 1,08) kg/m3 (k = 1).
| Table 1. Sources of uncertainty in volume | |
|---|---|
| Source of uncertainty | Value |
| Gauge tables | Calibration Certificate |
| Level | Note 1 |
| Liquid temperature | Calibration Certificate |
| Vapor temperature | Calibration Certificate |
| List (if applicable) | Calibration Certificate |
| Trim (if applicable) | Calibration Certificate |
| Tank thermal expansion factor (Spherical tanks) | Bibliography |
Note 1: The uncertainty of the level measurement shall be determined taking into account the following sources of uncertainty: intrinsic uncertainty of the gauge, the deviation of the mean (standard deviation), and the uncertainty of the corrections.
The volume uncertainty is strongly influenced by the uncertainty of the gauge tables, which can significantly vary from one LNG carrier to another. The uncertainty generally guaranteed by the contractor’s calibrations is ±0,2 % at ambient temperature. A study carried out by the National Bureau of Standards (NBS) on the calibration of the tanks of LNG carriers shows that the real uncertainty is far better and is about ±0,05 % to ±0,1 %. Also, according to this study, the systematic uncertainty due to the effect of shrinkage of the tanks when they have been cooled down should not be more than 0,07 %. Therefore, for a tank of 26 000 m3, the maximum guaranteed uncertainty is ±52 m3 LNG, but in practice it is around half of that taking into account the NBS study noted above.
In case the LNG carrier is not placed in a well-protected area, the uncertainty due to sagging and hogging should be included in the uncertainty calculation (only for membrane tanks).
The volume uncertainty of one tank can typically vary from 0,20 % to 0,55 % (k = 2). To determine the volume uncertainty of the whole LNG carrier, it is necessary to take into account the correlation between the parameters involved: some sources of uncertainty are highly correlated (tank calibration or measurement system) whereas others can be considered as uncorrelated (each tank has individual gauges for level, temperature and pressure). Nevertheless, it may be difficult to determine the degree of correlation (positive correlation); thus, a conservative approach is assumed and the uncertainty of one tank can be used as the uncertainty of the whole LNG carrier.
Note that in 3,01 edition the volumes of each tank were considered as uncorrelated (independent), obtaining that the uncertainty of the whole volume was less than the uncertainty of one tank. In this edition, a more conservative approach is used, avoiding an underestimation of the uncertainty.
Note for spherical tanks: For spherical tanks, owing to their geometry, the volume uncertainty, as a result of the small inaccuracies of the level gauge, is significantly less than for prismatic membrane tanks.
Cargo Liquid Lines
The previous section addresses the uncertainty Volume measurement methods of LNG transferredof volume measurement of the cargo tanks. To have a full picture, the issue of contents of the cargo liquid lines needs to be considered.
As specified in Volume measurement methods of LNG transferred“Calculation of the volume of LNG transferred” and in the ISO standard ISO 6578, cargo lines should be maintained in the same condition of pressure, temperature and density (liquid or vapor) during the opening and closing Custody Transfer Surveys (CTS).
For most «flat-deck» designs of LNG Carrier (e. g., older membrane-type and IHI-SPB), the arrangement of cargo lines on deck is such that, at completion of cargo operations, all liquid left in the liquid lines can drained by gravity back to a cargo tank.
Once the drainage is completed, custody transfer measurements can proceed as described and there is no need to consider liquid in the cargo lines.
For all spherical tank designs and for maximized membrane type designs where the manifold valves are below the crossover lines, some consideration is needed for undrainable liquid.
Significant volumes of LNG may remain in the cargo manifolds and crossovers after completion of delivery, typically well over 50 m3 LNG for the larger ocean-going LNG carriers. The fact that this volume often exceeds the total accuracy on volume measurement, underlines the importance of the ship’s cargo lines being in the same condition of density (i. e., liquid or vapor), during the opening and closing CTS. If this is the case, the normal approach is to pre-cool and completely fill the cargo lines with LNG prior to the first CTS reading on arrival. The assumption is that LNG volume in liquid lines is the same at the time of both opening and closing CTS readings, and therefore can be ignored in the calculation.
Density
The following table summarizes the sources of uncertainty in LNG density calculation:
| Table 2. Sources of uncertainty in density | |
|---|---|
| Source of uncertainty | Value |
| Calculation method (KMK) | Bibliography |
| Composition | From ISO 6974 |
| Molecular weight | Values taken from ISO 6976 |
| Molecular volume | Bibliography |
| Liquid temperature | Calibration Certificate |
| K1, K2 | Bibliography |
As most input parameters are correlated to the composition analysis, the application of the conventional uncertainty analysis, stated in GUM, is complex. In these cases, the Monte Carlo method is a practical alternative for the evaluation of the measurement uncertainty. In case of LNG density, a Monte Carlo simulation was used for 1 000 different compositions (see higher), obtaining an outcome of the simulation of 0,45 %.
Gross calorific value
The uncertainty of the GCV is described in detail in ISO 6976 (see equation higher), whose sources of uncertainty are:
| Table 3. Sources of uncertainty in GCV | |
|---|---|
| Source of uncertainty | Value |
| Composition | From ISO 6974 |
| Molar mass of each component | Table from ISO 6976 |
| GCV of each component | Table from ISO 6976 |
Using the equations as given by ISO 6976, typical values for the uncertainty of the mass based GCV are between 0,04 % and 0,07 % (k = 2).
Sampling and vaporization
The uncertainty due to sampling and vaporization has an impact on the composition measurement and is therefore influencing both the uncertainties on the GCV and the density. The uncertainty due to sampling and vaporization is obtained from the repeatability of the analyses, which is already included in the calculation of the composition uncertainty from ISO 6974. This uncertainty can be up to 0,3 % (k = 3) according to NBS. Situations where the vaporization fails and the sample is non-homogeneous are not taken into account.
Gas displaced
The gas displaced represents about 0,3 % of the total quantity transferred and the total uncertainty of the parameters used in the calculation is ±1 %. The uncertainty resulting from the calculation of gas displaced in the energy transferred is therefore about ±0,003 % and can be considered negligible.
Gas consumed in engine room
The gas consumed in the LNG carrier’s engine room during the time between opening and closing custody transfer surveys may typically amount to some 0,05 to 0,06 % of the total energy of LNG transferred (see above) and the total uncertainty of the parameters used in the calculation is ±1 %. The uncertainty resulting from the calculation of gas consumed in the energy transferred is therefore about ±0,0006 % and can be considered negligible.
Combined standard uncertainty and expanded uncertainty of the energy transfer determination
The combined relative uncertainty obtained for the energy transferred can be calculated as:
The following table sums up the typical values of the expanded uncertainties involved in the determination of the energy uncertainty (see higher). These values can be used as reference; however, the uncertainty budgets should be determined for each (un)loading.
| Source of uncertainty | Typical Values (k = 1) |
| Volume | 0,10 % – 0,27 % |
| Density | 0,23 % |
| GCV | 0,02 % – 0,04 % |
| Energy | 0,25 – 0,37 % |
The combined expanded uncertainty (also sometimes called «overall uncertainty») of measurement with 95 % confidence level (coverage factor k = 2) of the energy transferred is 0,5 – 0,7 %.
Note: if the correlation between density and GCV (both variables are obtained from the LNG composition) is taken into account (negative correlation in this case: increase of density implies decrease of GCV, and vice versa), the above figures decrease slightly.
Rounding of numbers and commercial impact
According to ISO 80000-1 (Annex B) «rounding» means replacing the magnitude of a given number by another number called the «rounded number». Two different rules (rule A and B according to ISO 80000-1) are in use for this purpose but the rule B is in generally preferable (used in computers).
- The greater in magnitude multiple is selected as the rounded number if the last digit is ≥ 5.
- The lower in magnitude multiple is selected as the rounded number if the last digit is < 5.
Examples:
- 12,24 is rounded to 12,2;
- 12,25 is rounded to 12,3;
- 12,26 is rounded to 12,3.
When a number is given without any further information, it is generally interpreted so that the last digit is rounded. For example, the number 401 008 is assumed to represent a value between 401 007,5 and 401 008,4. In this case, the maximum magnitude of the error in the number 401 008 is ±0,5. Rounding shall not be replaced by truncation (i. e., by simply cutting off the last digits) e. g., 401 007,9 becomes 401 007. In this case, the number 401 007 represents a value from 401 007,0 to 401 007,9 and the error is smaller than 1.
Rounding of numbers shall always be carried out in the last step because rounding in more than one stage may lead to errors. Besides, accuracy can’t change during mathematical operations. On the other hand, numerical values of parameters have an associated standard expanded uncertainty. Uncertainty has to be expressed in absolute terms with two significant figures (see ISO 80000-1 for definition of «significant digits») ant it sets the limit of significant figures of a measure. The numerical value of the property shall be rounded to the least significant figure in the rounded value of the expanded uncertainty.
For the purposes of Custody Transfer Handbook, the unloaded or loaded energy is calculated with the following equation:
Following the rules given before, it is recommended to round off the values of the parameters to obtain an equal number of significant digits for each parameter, such as is mentioned in Table 4. In this case both the volume, the mass based GCV, the density and the energy have a similar number of significant figures Volume measurement methods of LNG transferred“Flowchart for determining the volume of LNG transferred”. An example showing the commercial impact of rounding of numbers is shown below.
EXAMPLE OF COMMERCIAL IMPACT OF ROUNDING OF NUMBERS
The commercial impact is shown in this simple example. Typical reported values are:
- V – 150 000 m3;
- D – 450,30 kg/m3;
- GCV – 54,804 MJ/kg.
Table shows the maximum error (%) and the maximum economic impact taking into account resp. zero, two and three decimal places for volume, density and calorific value. It can be observed that the maximum error is not significant taking into account that the cargo has a value of 35 085 550 $. New economic impact can be observed by multiplying or dividing by 10 if a decimal place is eliminated or added.
| Commercial impact | |||||
|---|---|---|---|---|---|
| Parameter | Units | Value | Real Value Range | Maximum rounding error (%) Note 1 | Maximum rounding error ($) Note 2 |
| Volume | m3 | 150 000 | 150 000,5 – 149 999,5 | 0,00033 | 117 |
| Density | kg/m3 | 450,30 | 450,305 – 450,295 | 0,00111 | 390 |
| GCV | MJ/kg | 54,804 | 54,8045 – 54,8035 | 0,00091 | 320 |
| Energy | MJ | 3 701 736 180 | 3 701 823 395 – 3 701 648 966 | 0,00236 | 827 |
Note 1 Maximum rounding error (%):
- V – 0,5 %/150 000 = 0,00033 %;
- D – 0,005 %/450,30 = 0,011 %;
- GCV – 0,0005 %/54,804 = 0,00091 %;
- E – (3 701 823 395 – 3 701 648 966)/3 701 736 180 · 100.
Note 2
- 1 Megajoule [MJ] = 0,000947813 Million British Thermal Units [MMBtu];
- Energy Cargo (example) – 3 701 736 180 MJ or 3 508 555 MMBtu;
- Price LNG (USD/MMBtu) – 10,00 $/MMBtu;
- Maximum rounding error ($):
- rounding volume – 3 508 555 · 10 · 0,00033 % = 117 $;
- rounding density – 3 508 555 · 10 · 0,00111 % = 390 $;
- rounding GCV – 3 508 555 · 10 · 0,00091 % = 320 $;
- rounding energy – 3 508 555 · 10 · 0,00236 % = 827 $.
| Table 4. Decimal places for parameters | |||
|---|---|---|---|
| Parameter | Units | Deci | Typica |
| Volume (un)loaded | m3 | 0 | 140 000 |
| LNG density | kg/m3 | 3 | 450,341 |
| LNG GCV (on a mass basis) | kWh/kg | 4 | 15,2046 |
| Energy | MWh | 0 | 953 685 |