Bunkering with liquefied natural gas (LNG) is a key element in the maritime industry’s transition to more environmentally friendly fuel. However, like any process involving fuel, LNG bunkering carries certain risks. To minimize them, the concept of an LNG Bunkering Safety Zone was developed. This is not just an area outlined on a map, but a set of strict rules and measures aimed at preventing accidents, and protecting personnel, vessels, and the environment. In this article, we will take a closer look at what this zone represents, why it is so important, and what key safety measures must be observed to make LNG bunkering as safe and efficient as possible.
NOTE: The present Section defines and outlines a number of different approaches for Safety Distance Calculation. None of the approaches are advocated as the right approach. Safety Zones are a geometric definition surrounding the bunkering location. Whether these are providing meaningful protection should be the main question to ask. Section “Meaningful Protection” should, to this end, be read in conjunction with this section to link the determination of a Safety Zone with the actual mitigation of different potential risk scenarios, and practical aspects in the implementation of these zones.
References
The reference standards for the definition, calculation and implementation of Safety Zones are:
| ISO/TS 18683:2015 Guidelines for systems and installations for supply of LNG as fuel to ships | ISO | Both ISO reference documents share the same contents regarding Safety Distances in LNG Bunkering. The same text is repeated in both standards. |
| EN ISO 20519 – Specification for bunkering of liquefied natural gas fuelled vessels | ISO | Calculation methodologies are mentioned (deterministic and probabilistic) with suggested curves for safety distance reference determination. |
References to Safety Distances can be widely found in literature, mostly on calculation of safety distances, comparative exercises on deterministic/probabilistic methodologies, risk assessments and others. This is, in fact, a particular subject where much has been written, where more or less conservatively, different Safety Distance calculation approaches have been developed.
Regardless how many different references might be possible, it is important to note that Safety Zones, unlike Hazardous Zones, are highly context-specific, depending on the
Definitions
Using the definition by SGMF:
In the definition by SGMF further consideration is given, even if in very generic terms, to the extent of the zone, the objective for its establishment. It underlines the temporary nature of the zone which is the greatest distinction when compared to the LNG Bunkering Hazardous Zone: Safety, Classification, and Controlhazardous zones, which are present at all times.
ISO/TS 18683 and ISO 20519 define Safety Zone as the area around the bunkering station where only dedicated and essential personnel and activities are allowed during bunkering.
Objective
The objectives for LNG Bunkering Safety Zone implementation are:
- To control ignition sources in order to reduce the likelihood of igniting a flammable gas cloud that has dispersed following an accidental release of LNG or natural gas during bunkering.
- To limit the exposure to non-essential personnel in the event of potential hazardous effects (e. g. fire) during an incident when bunkering.
- To assess local infrastructure for any potential gas trapping points, where explosive atmospheres may occur, as a result of accidental gas cloud dispersion.
The establishment of a Safety Zone will, in particular, allow for the structured application of safety and operational related restrictions that should, collectively, contribute to the achievement of the objectives above. These restrictions will inevitably be port-specific, reflecting the reality of each port, the local conditions, port own operational activity, potential major accident prevention policy, amongst others.
Restrictions
The restrictions policy to apply within the Safety Zone should be adequate and proportionate to the level of protection necessary for people, infrastructure and other operations within the port area. It is here important to mention that the restrictions to enforce within the Safety Zone will only be meaningful if the necessary strategy, plannification and resources are made available.
Read also: LNG Bunkering Guide – What It Is and How to Use It
Collectively, the restrictions to enforce within the Safety Zone should contribute to the adequate achievement of the objectives expressed in “Objective”.
The following restrictions will typically apply within the LNG Bunkering Safety Zone:
- Smoking is not permitted.
- Naked lights, mobile phones, cameras and other non-certified portable electrical equipment are strictly prohibited.
- Cranes and other lifting appliances not essential to the bunkering operation are not to be operated.
- No vehicle (except the tank truck) should be present in the safety zone.
- No ship or craft should normally enter the safety zone, except if duly authorised by the Port Authorities.
- Other possible sources of ignition should be eliminated.
- Access to the safety zone is restricted to the authorised staff, provided they are fitted with Personal health and safety crew members on board a gas carrierpersonal protective equipment (PPE) with anti-static properties and portable gas detector.
- Ventilation Intakes in the entire Safety zone should be restricted, with tag-out policy applied whenever LNG bunkering in course.
Vehicles, electrical equipment, cranes and other working gear, which are Ex-proof certified, can be considered for use within the Safety Zone. An inventory of this equipment should be part of the LNG Bunkering Management Plan.
All restrictions should be clearly indicated in the Port Regulations or informative notice sent well in advance to operators. Consideration for the elimination of any of the restrictions above should always be based on a Risk Assessment approach.
Calculation
ISO/TS 18683, and subsequently ISO 20519, provides guidance for two different approaches that can be used to determine the safety zone:
- Deterministic approach calculating the distance to LFL based on a maximum credible release;
- Risk-based approach, also known as Probabilistic approach.
The deterministic approach is based on a calculation of the distance to LFL for a maximum credible release conservatively defined as part of the HAZID. This calculation needs to consider both horizontal and vertical releases and subsequent dispersion.
The calculation can make use of analytical calculation tools, based on simple mass rate release, in a similar manner to the approach followed by IEC 60079-10-1, but that would render an extremely conservative approach which would not be realistic in terms of adequate modelling.
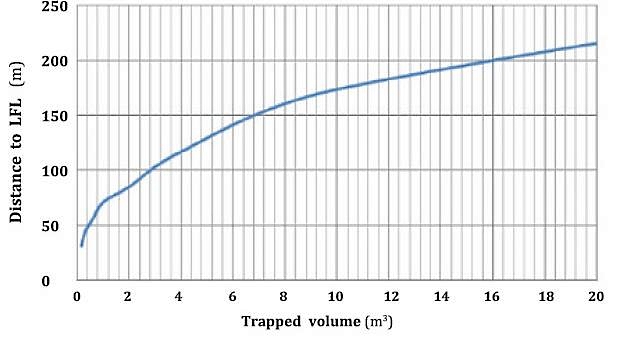
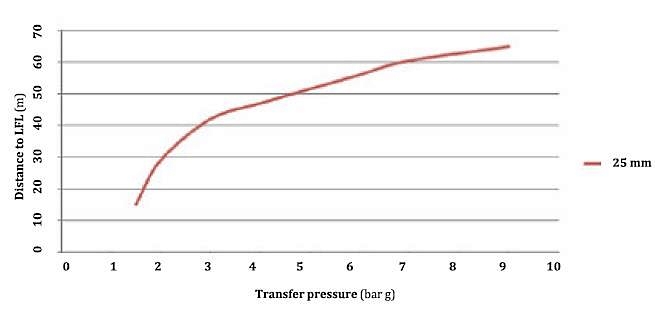
Both ISO references (TS 18683 and 20519) provide for curves to be used, both for:
a release of trapped volume, contained in the bunkering line, between ESDs;
b and continuous release from broken instrument connection (with the example of 25 mm instrument connection hole).
The origin of the curves is however not explained in the ISO standards, with some relatively large distances resulting from their use.
If the risk-based or probabilistic approach is used, this will normally result in a smaller safety zone compared with the distance to LFL for the maximum credible release.
The more complex risk based approach may be used if the simplistic approach results in too large (and conservative) distances from a practical point of view. A smaller safety zone may be accepted provided that it can be demonstrated by the QRA that risk acceptance criteria can be met for 1st, 2nd, and 3rd party personnel. If the risk is acceptable in accordance with the acceptance criteria (as agreed with authorities) the smaller safety zone is acceptable.
Even though, in theory, a risk-based approach could, potentially, be able to define very small Safety Zones, based on a possible ambitious set of safeguards designed, it is important to note that minimum reference Safety Distance should be in place. The LNG Bunkering Safety Zone should never be smaller than:
- the Hazardous Zone.
- Port Specific requirements.
- National Standards/Safety regulation potentially applicable.
To both deterministic and probabilistic approaches, the use of computational tools will be determinant. Direct algebraic calculations are not simple for non-linear processes such as LNG spills, pool formation or gas cloud dispersion. Computational models will be a fundamental support to the structured development of consequence studies that are able to represent more or less accurately.
Deterministic Approach
As expressed in ISO/TS 18683 and ISO 20519 the safety zone is defined as the area within the distance to LFL as determined by a recognized and validated dispersion model for the maximum credible release as defined as part of the HAZID. For LNG, the LFL is approximately 5 % of natural gas in air.
The maximum credible release shall reflect the characteristics of the bunkering facility (dimensions, capacity, transfer rate, temperature/pressure, and if installed, vapour return) as well as the safeguards that are implemented.
The table below (table 1) outlines the existing possible deterministic calculation approaches.
| Table 1. Safety Zone calculation – Deterministic approaches | ||
|---|---|---|
| Method | Description | |
| Analytical | Standard / widely available mathematical equations for modelling light, neutrally buoyant and Dense Gas dispersion. Good for coarse first pass decision making. | |
| Analytical calculations based in first principle mathematical models | Typical data to be used for analytical calculations will involve a variety of different parameters and some factors which should be able to approximate the mathematical models in a context of quasi-static linear algebraic solutions, including geometric representation of gas dispersion plumes. | |
| Relevant references for analytical calculations: | TNO‘s Yellow Book (CPR 14E) providing for many of these models and equations and also. | |
| Milton Beychok’s book “Fundamentals of Stack Gas Dispersion”. | ||
| From TNO’s Yellow Book, the following relevant areas can be found for calculations: | i. Outflow and Spray release | |
| ii. Pool formation and evaporation | ||
| iii. Vapour cloud dispersion | ||
| iv. Vapour cloud explosion | ||
| v. Heat flux from fires | ||
| vi. Rupture of vessels | ||
| vii. Interfacing of models | ||
 | ||
| ISO (a) | Release of the trapped inventory in the bunkering transfer line | |
| Trapped Volume Release | ISO describes a worst case scenario for LNG bunkering transfer which can be defined as the rupture of the bunkering line due to a catastrophic accidental event (such as drift off of the vessel due to a collision or a mooring failure). | |
| Maximum credible release calculation based on the following assumptions: | Activation of the ESD prior to rupture. This would require a pre-warning of some kind, as it is admitted in ISO/TS 18683 and ISO 20519. | |
| Partial failure of the ERC/break away (i. e. only one of the ERC sides fail, resulting in partial release of hose LNG content. | ||
| Based on these assumptions, the release amount is determined as the inventory between the one end of the bunkering hose and the corresponding failing ERC (see figure 2). | 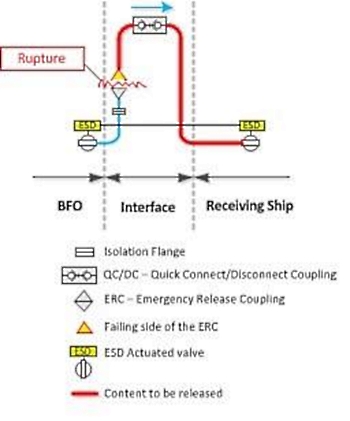 | |
| The ISO assumption of ESD activation prior to rupture, as indicated above, may not be fully realistic. The pre-warning for any catastrophic event will necessarily depend on the effectiveness of the alarms and the specification of the ESD actuation. Complete ESD shut- down may take several seconds, not only due to technical limitations but also to avoid pressure surge. For a realistic modelling of this maximum release scenario it is important to take the ESD shut-down time into account. The volume released will necessarily be more than the one presented in the ISO curve, above in figure 3. | ||
 | ||
| ISO (b) | Constant pressure release of LNG through a broken instrument connection | |
| Continuous release at constant pressure | The maximum credible release is defined as a broken instrument connection. Such scenarios may occur without automatic detection and is conservatively represented by a continuous release through a 25 mm hole. ESD is not activated and the pressure inside the transfer system is maintained by the cargo pumps. The distance to LFL as a function of the system pressure is shown in the table of figure 4. | 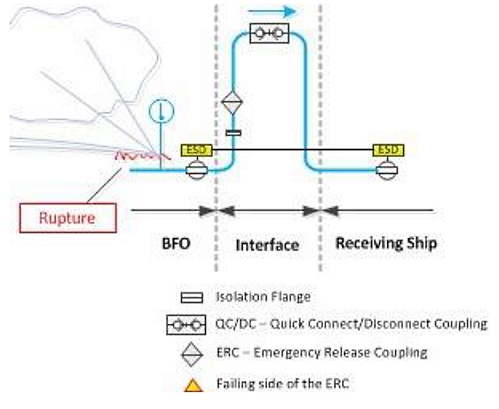 |
| The extent of the LNG Bunkering Safety Zone would, in this case, be a function of how long the release had been running before either ESD was stopped or pump was stopped. Computational modelling of 25 mm constant pressure release has confirmed the impracticable distances from a 25 mm hole. The constant pressure release through an instrument broken connection of 25 mm may be considered too conservative, leading to impracticable safety distances. This has been, for instance, the justification to explore different (smaller and more significant/representative) the case of 13 mm hole hose rupture referred to as “significant credible scenario“, based on IOGP data, where 90 % or more of all potential releases for the bunkering line equipment Flexible hose/line, instrument connections, valves and flanges.x are likely to be from “holes” with a diameter of 13 mm or less. | ||
 | ||
| The use of both ISO (b) and ISO (a) curves is however still the ISO reference for Safety Distance calculations. | ||
| Computational Supported Calculations | Both approaches suggested by ISO/TS 18683, repeated by ISO 20519, are not sufficiently flexible to accommodate for the large variety of possible LNG bunkering scenarios and possible parameter variation. Not only the underlying construction assumptions for the curves are not declared in the ISO references, it is also very difficult to reproduce the values for the curves using numerical analysis and computer modelling. | |
| Due to the large number of variables defining the physical processes involved in LNG pool formation and gas dispersion, the use of computational tools for modelling and analysis has become more and more the support for definition of Safety Distances for recent LNG bunkering projects. The recent tendency for higher LNG transfer rates, higher pressures and increased complexity of bunkering management, from STS to PTS bunkering modes, are some of the reasons to adopt more complex calculation and modelling techniques and tools. | ||
| For the maximum release scenario, the modelling of the LNG release and dispersion need to take into account the following elements: | 1. Properties of the LNG, reflecting release conditions. | |
| 2. Size of the hole, reflecting the installed equipment and validated failure data. If validated failure data is not available, conservative assumptions shall be made; | ||
| 3. Roughness of the surface over which the vapour/gas disperses, (i. e. land or water) | ||
| 4. Release height and dispersion elevation; | ||
| 5. Outflow conditions; | ||
| 6. Release rate, release orientation, available inventory; | ||
| 7. Evaporation/flashing of LNG reflecting LNG properties and heat transfer from ground/water; | ||
| 8. Heavy gas dispersion; | ||
| 9. Structures and physical features that that could significantly increase or decrease dispersion distances. Large objects, such as buildings and ships, and topography, such as cliffs and sloping ground, can constrain or direct dispersion | ||
| 10. Weather conditions at the bunkering location; wind speed, humidity, air temperature and the temperature of the surface upon which the fuel leaks. The chosen conditions should reflect the worst-case conditions that result in the greatest distance to LFL; | ||
| There are currently a large range of options for computational modelling and analysis of LNG accidental release/spillage events. Section “Deterministic Approach” outlines the main types of software tools, listing their most relevant advantages and disadvantages. Different types of modelling and analysis software will essentially differ in terms of computational effort, with Integral Models having the lowest computational requirements, up to CFD Navier-Stokes software, with the largest. | ||
| In cases where the local conditions are dominated by non-linear weather based effects, with complicated infrastructure or other obstacles close to the bunkering location, advanced modelling techniques, such as computational fluid dynamics (CFD) might be required to justify the zone’s shape and extent. | ||
| Verification & Validation procedures (see Section LNG Bunkering Security Zone“Control Zones in LNG Fuelling”) should be considered for all computational calculations. Not only it should be possible to demonstrate that the model is actuallyc. | ||
| Modelling and Analysis through computer tools should be performed by competent expert/professional with demonstrated experience record. | ||
Probabilistic Approach
Recognizing that the deterministic approach may result in impracticable large areas, both through ISO (a) or (b) methods or through any computational maximum credible scenario calculation, ISO/TS 18683, and subsequently ISO 20519, accept smaller zones, provided these can be demonstrated by a Quantitative Comprehensive Guide to Risk Assessment and Process Safety ManagementRisk Assessment, with risk acceptance criteria met for first, second and third party personnel.
A HAZID should be held for initial identification and ranking of LNG bunkering hazardous scenarios where risk matrices are developed reflecting the different risks identified. Subsequent definition of safeguards to bring all risk scenarios to ALARP levels should allow a set of tangible measures to implement (physical barriers, alarms or other safety devices which are either able to reduce the consequence or the probability of a given hazard).
It will be interesting: Balancing Cleaner Fuel and Environmental Impact in LNG Emissions
The risk assessment should address all hazard scenarios ISO Standards define, as a minimum, flash fires, jet fires, and pool fires to be investigated.x as identified in the HAZID and reflect validated (or conservative) failure data. Safeguards identified in the HAZID and be considered in the Risk Assessment, provided these are reasonable, implementable and recognized as relevant for actual risk mitigation.
For consequence modelling all the selected hazard scenarios should be considered, with the modelling of the release and dispersion to be as described in “Deterministic Approach”.
Table 2, below, presents the main elements to be considered, including consideration on Risk Criteria.
| Table 2. Risk Assessment – Specific requirements to set Risk-Based Safety Distances | ||
|---|---|---|
| Risk Assessment | Summary Description | |
| Ignition probabilities | Ignition probabilities shall reflect installations and operations and be applied with reference to IEC 600079-10-1 for: | the hazardous areas; |
| inside the safety zone; | ||
| outside the safety zone | ||
| Target Protection | i. first party personnel (crew and bunkering personnel) are continuously present in the safety zone during bunkering; | |
| ii. second party personnel (port and terminal operator, other vessel crew) are continuously present directly outside the safety zone during bunkering; | ||
| iii. third party personnel (passengers and other persons visiting the site) can be present, but will not be continuously exposed to the risk; | ||
| iv. third party personnel continuously present (residential areas, schools and hospitals) will be outside the risk contour for third party acceptance | ||
| The risk assessment should consider the risk exposure for first, second and third party personnel. | ||
| Escalating events | The impact on personnel shall primarily assess the initial events. Escalating events will be delayed and the impact should consider the efficiency of evacuation and emergency preparedness | |
| Multiple Failure Scenarios | Multiple failure scenarios, in principle, should not be required. It should be possible to address each hazard for its own risk. As with the escalating events, initial scenarios should be the main investigation points. Should any cascade, domino or escalating events be considered these should be addressed in the context of the HAZID, properly documented before any modelling takes place. | |
| Risk Criteria | Examples of risk acceptance criteria are adopted in ISO/TS 18683 annex A and are shown in Table 3. | |
| Table 3. Examples of risk acceptance criteria, adopted from ISO/TS 18683 – Annex A, Table A.1 | ||
|---|---|---|
| Acceptance criteris | Comment | |
| Individual risk 1st party personnel | IR < 10-5 | Applies to crew and bunkering personnel directly involved in the activity. |
| Individual risk 2nd party personnel | IR < 5 · 10-6 | Port personnel and terminal personnel. |
| Individual risk 3rd party personnel with intermittent risk exposure | Risk contour for IR < 5 · 10-6 | 3rd party personnel should not have access for prolonged period. |
| Individual risk 3rd party personnel with prolonged risk exposure | Risk contour for IR < 10-6 | General public without involvement in the activity. No residential areas, schools, hospitals etc. inside this risk contour. |
The suitability of using annual (i. e. yearly) fatality criteria requires further consideration. This is because the bunkering operation may be infrequent and of a very short duration, and hence the risk is likely to be small when averaged over a year. Based on this, a safety zone of short extent might be set that would offer little protection in the event of a leak. In simple terms, the yearly “averaged” criteria can mask peaks in risk related to periodic but infrequent short-duration operations.
An alternative to fatality risk is to set safety zone extent based upon the likelihood that flammable gas is present. That is, for a representative set of events, the distance at which the lower flammability limit is reached for an agreed likelihood. This likelihood could be per year or per bunkering operation. However, an annual likelihood would suffer from the same concerns noted above for “averaging the fatality risk” over a year. As such, likelihood per operation might be preferable. For this approach to be used, further investigation and agreement is needed on likelihood criterion, for example, 1 in a million or 1 in 10 million per bunkering operation.
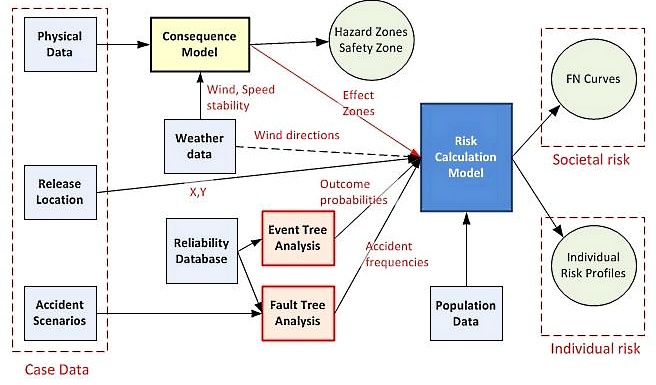
Figure 6, below, presents the generic diagram where all elements contributing Risk-Based Safety Distances are included.
Computational Calculation
In the recent years, the CFD modelling has become a very useful tool for many research areas. This is connected with the increasing power of desktop computers. Accordingly to that, the computations for which we needed supercomputers can be done on regular PCs. The ability of CFD to predict fluid flow and concentration of dangerous gases is essential to the people working on safety analysis. There are today many programs developed for the prediction of hazardous gas cloud spreading. Starting from very simple Gaussian models for the light gases (the density of gas is less or equal to that of air) continuing with box models for heavy gases (the density of gas is higher than that of air) and ending with complete solving 3D balance equations for mass, momentum and energy (CFD). The use of CFD models has high potential to be a tool which can after some adjusting and modification replace the experimental modelling or at least reduce the number of experimental trials.
For LNG bunkering computational calculations represent a mix between deterministic and probabilistic approach. On one hand the aim of the model is to determine a more realistic or representative pattern for LNG vapour cloud dispersion but, on the other hand, in doing so, there are a number of assumptions for the model construction, and subsequent analysis, which are based on more or less likely scenarios.
Weather data would typically be available with a generic historic data record, potentially plotted on a rose-wind chart as the one presented in table 4. Such weather data brings a probabilistic element into the computational calculation and it is important to have this into account when supporting decision making on safety zones only on computational calculations like CFD.
Different options exist for computational modelling of LNG accidental releases during bunkering operations, differing essentially on how demanding they are in terms of computational effort and on how accurately they can model the LNG spillage physical phenomena under specific conditions. Table 4 presents the 3 main types of computer models used for LNG vapour/gas dispersion.
| Table 4. Examples of risk acceptance criteria, adopted from | |
|---|---|
| Computational model | Summary Description |
| Integral Models | Integral Models are the less computer-consuming tools that can be used to model LNG spillages, pool formation, evaporation, gas dispersion and fire. They use algebraic equations to obtain solutions and are usually limited to modelling of circular pools, flat substrates, and heat transfer only from the substrates. |
| Modelling pool formation with Navier-Stokes models can be time-consuming because of their complexity. As a result, researchers prefer to model pool formation with integral models and then transfer the data over to Navier-Stokes models for further analysis. | |
| Typical entries for Integral Models account for: release characteristics (rate, height, orientation), spill volume, spill rate, vaporization rate, presence of obstacles, and atmospheric conditions are considered to be key parameters in determining the LFL extent and time-spatial distribution Examples of Integral Model software are: SOURCE5, GASP, SafeSite3G, PHAST, ALOHA, ABS Consulting model, LNGMAP, and FLACS. | |
| PHAST has, in particular, gained visibility from application in several recent LNG Bunkering consequence modelling. Some of the advantages presented by PHAST, when compared to other Integral Model codes are: | |
| 1) ability to model LNG spills onto water and land, | |
| 2) possibility to model non-circular pools. | |
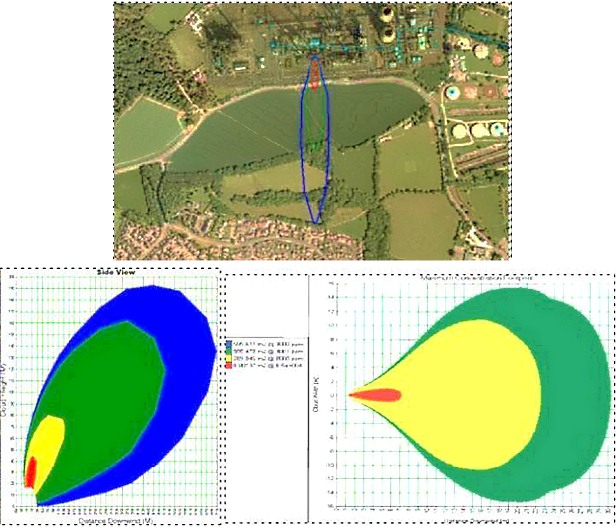 | |
| ↑ Fig. 7 PHAST interface representation. Example of dispersion top view over terrain top view, side view and top view for plume dispersion | |
| Box or Top-Hat Models | There are two types of box or top-hat models: modified Gaussian models and similarity-profile models, depending upon the complexity of conservation equations that must be solved. The modified Gaussian models are the simplest because the Gaussian equation is used for the mass conservation while neglecting or simplifying those for momentum and energy. The similarity-profile models use simplified conservation equations with a mathematical complexity of one dimension. Such simplicity is achieved via averaging the LNG cloud properties across the surface of the entire cloud or over the cross wind plane. |
| To regain the structural loss because of averaging, similarity profiles are used, therefore leading to quasi-three-dimensional solutions (explored in 3D for SLAB3D). | |
| Examples of similarity-profile models include SCIPUFF, TWODEE, SLAB, HEGADAS, DEGADIS. | |
| ALOHA and GASTAR. Of these models, the most commonly used are SLAB, HEGADAS, DEGADIS, and ALOHA. | |
| SLAB and ALOHA seems to be the most widely used for safety engineering modelling applications in industry because of its fast computational time and reasonable accuracy. | |
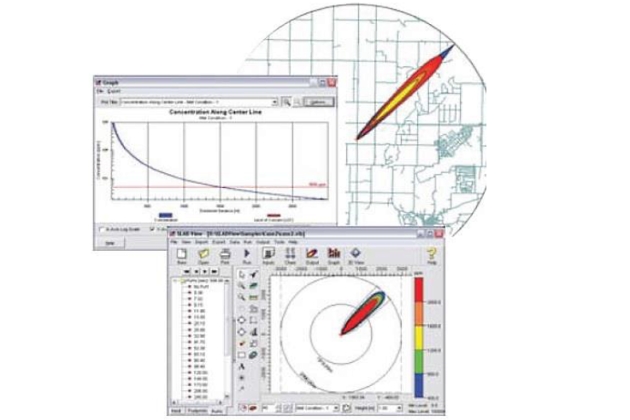 | |
| ↑ Fig. 8 SLAB interface representation. 2D dispersion (SLAB 3D commercial suite already available with improved visualization options) | |
| Navier-Stokes Models | Navier-Stokes Models. The Navier-Stokes models contain the most physically complete description of the LNG dispersion process and are constructed from three-dimensional and time-dependent conservation equations of momentum, mass, energy, and species. |
| Examples of Navier−Stokes models that have been used for denser than air modelling include FEM3, FEMSET, FLACS, HEAVYGAS, and ZEPHYR. FLUENT and CFX numerical models have been the main Navier-Stokes models used for modelling. This is largely due to the key advantages of these models, including robustness, multiple solving methods, high levels of accuracy, and ability to add to the coding for specific simulations. | |
| Although giving a more complete description of the physical processes available and performing better than box or top-hat models, the Navier-Stokes models are the more demanding in terms of computational resources. | |
| Some examples of CFD visual outputs can be seen hereunder, in figures 9 to 11. | |
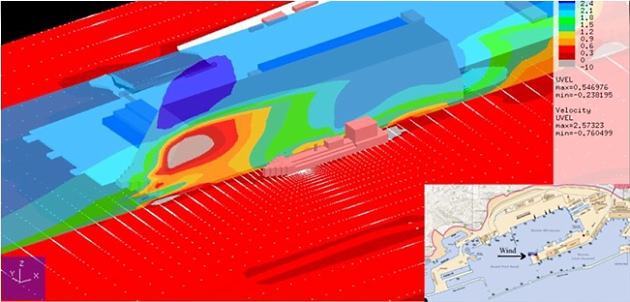 | |
| ↑ Fig. 9 CFD representation of an LNG cloud release, following a modelled STS bunkering. | |
| Local wind and turbulence effects are modelled, providing a more accurate analysis of non-linear situations. To be noted the effect of the inter-ship space, where LNG cloud dispersion is bounded by the ship’s shape, leading to a dispersion progression which is far from regular. (courtesy: LR/Port of Marseille). | |
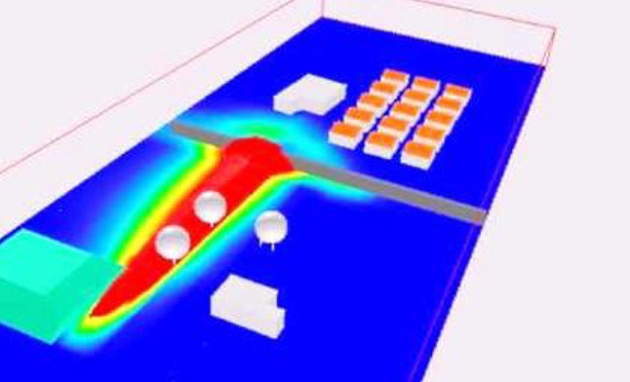 | |
| ↑ Fig. 10 CFD render representation. Plume dispersion meeting terrain obstacles. The figure, in particular shows the effect of a fence/wall as an obstacle to the progression of the LNG cloud, under certain local conditions and prevailing wind | |
 | |
| ↑ Fig. 11 CFD render representation. Plume dispersion following PRV actuation and venting up from a type-C LNG tank | |
When assessing results based on computational calculations PAA should have consideration for the following important elements:
(1). Computational tool used:
a Identification of the Code used for modelling & analysis, including year and version.
b Evidence of proven experience with the reference software, including identification of general elements from other projects.
c Commercial software or self-developed.
d List of particular limitations of the model.
e References.
(2). Assumptions:
a Assumptions used for the modelling & analysis of the different LNG release situations.
b Identification of approximations, averaging, rounding mechanisms used with the objective of computational simplification.
c Wind directions studied.
d LNG release parameters (flow rate/volume, height a location of release, release orientation).
e Temperatures.
f Rate of evaporation assumed for possible pool modelling.
(3). Model Construction:
a Site modelling, port local infrastructure, including boundary conditions assumed on different parts of the model.
b Simplifications.
c Possible planes of symmetry used.
d Mesh constructions and refinements, with the clear indication of refined meshing on specific areas of interest.
(4). Analysis:
a Calculation methodology.
b Convergence analysis, with adequate demonstration of convergence for all the solutions presented
(5). Verification:
a Procedure for code verification (particularly important for self-developed CFD software).
b Verification procedures for quality assurance.
c Error estimation or, in case of difficult assessment of error magnitudes, arguments on specific modelling features that may potentiate errors.
(6). Validation:
a Evidence of any validation experiments to support the tools used.
When the determination of a Safety Zone is supported by computational calculations, PAAs must take special consideration to representativeness of the model, not only for the local conditions (boundary conditions, wind, temperature) but also to the LNG bunkering operation parameters (flow rate, transfer pressure, bunkering line location). This will be an important point to take into account for any of the models presented in the table above.
Read also: LNG (Liquefied Natural Gas) as Fuel
Many factors contribute to the quality of the computational model & analysis. PAAs should, in principle, be able to revise reports with computational calculation results and, even if not in detail, be able to promote a dialogue and exchange on the parameters, basic modelling assumptions, parametric options and necessary quality control for any computational model.
Table 5, below, lists some of the important factors that directly affect the quality of computational models, with a particular focus on CFD. PAAs should be prepared to question the assumptions behind any computational calculation result, in particular if this is presented as a render image output.
| Table 5. Main factors affecting the quality of computational model calculations. Quality Criteria for computational modelling & analysis of LNG vapour dispersion | |||
|---|---|---|---|
| Computational model | Summary Description | ||
| Calculation Codes | Integral, Box/Top-Hat or Navier-Stokes CFD are possible calculation codes with different complexities and corresponding computational calculation times, with CFD suites being the most demanding with a very high number of numerical iterative calculations. It should be important to note that, in particular for modelling of LNG vapour dispersion, following an accidental release, there should be some consideration for cost-benefit of which model to use. In addition and related to this, there should be a critical notion on the necessity to picture smaller scale turbulence effects (demanding for computational calculation) when the objective is to set higher level Safety Distances of a scale much larger than the smaller eddy/turbulence level. Clarification on the model used should allow PAAs to check for the maturity of the computational tool, which can be directly related to the quality of the Technical Competence. | ||
| Technical Competence | The competence of the analyst responsible for the model, analysis and report presented to the PAA should be one of the main aspects to question. Evidence of experience should be available to PAAs on request. For those analysts with less experience PAAs should require for evidence of an internal verification/approval procedure shared responsibility with more experienced professionals. Identification of the responsible analyst, and possible chain of verification, should always be clearly stated in the final report. | ||
| Boundary conditions | Boundary conditions are important aspects to all models. They impose constant physical values or constraints with the main objective to approximate the LNG vapour dispersion to real conditions. CFD models are only as good as the physical models produced. In the same way, the accuracy of the CFD solution is only as good as the boundary conditions provided to the numerical model. Many different constraints and boundary conditions specifications can be imposed in the model. These will affect directly the shape of the LNG dispersion. Figure 12, below, shows some of the possible boundary conditions that can be used to shape the approximation to reality. | ||
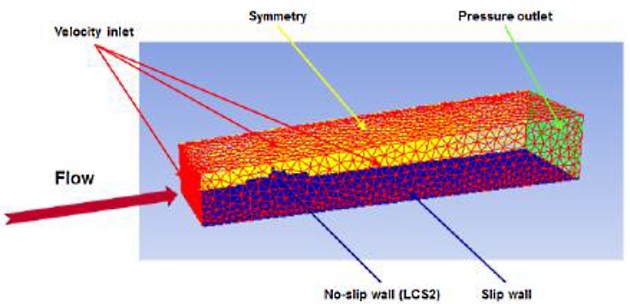 | |||
| ↑ Fig. 12 Identification of boundary conditions in a simplified regular CFD control model volume | |||
| All boundary conditions must be reported and justified. | |||
| Modelling of local conditions | Local conditions must be chosen in agreement with PAAs, using available data for wind and temperature, preferably for the location of interest (intended LNG bunkering location). If no local information exists, such as actual local wind information, the model should consider the possibility of creating a far field wind profile, with obstacles and infrastructure modelled so as to create a turbulent and more realistic air flow pattern at the location of studied LNG release. | ||
| Important weather/local parameters to consider: | Wind | ||
| Temperature (air and surface boundaries) | |||
| Atmospheric stability (more relevant in terms of fire studies, with relevance for convection modelling of vertical fire columns). | |||
| Wind is probably the most important local condition that will dictate, together with temperature the progression of LNG cloud dispersion. Which wind strength and direction to use will typically derive from available wind-rose distribution charts like the one presented to the right, in figure 13. | |||
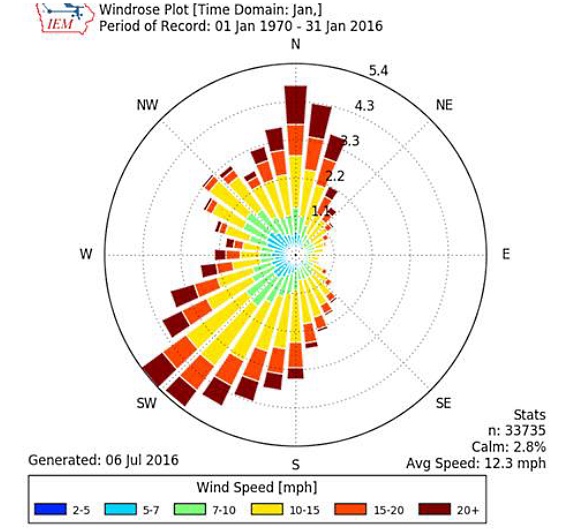 | |||
| ↑ Fig. 13 Wind-rose distribution chart, including wind direction and speed radial histogram | |||
| The final report, with results from computational calculations, should include the rationale for the choice of important local parameters. It is important that PAAs are involved in the modelling of local conditions, not only being able to provide available data sets but, furthermore, bringing the local experience into the model. Some local wind effects are very difficult to capture only by historic data, especially when that data is available for otherwise undisturbed locations. In addition to the above, and because each calculation set will be based on specific conditions, it will be important to check from which direction to model the wind and, again, what wind field flow pattern is imposed in modelling. Failure to be consistent with local conditions will derive in lack of representativeness of the computational model and results. | |||
| Modelling of bunkering conditions | Bunkering operation details should be well represented in the model, with the main parameters representative of actual operational conditions. | ||
| The following parameters are relevant: | LNG transfer pressure; | ||
| LNG transfer rate; | |||
| Exact location of LNG bunkering point; | |||
| LNG temperature. | |||
| Release Scenarios | Release scenarios should be agreed with the PAA, based on local conditions and expertise from analyst consultants responsible to undertake the modelling. | ||
| As a minimum good practice the following scenarios should be calculated: | ISO (a): Release of the trapped inventory in the bunkering transfer line | ||
| ISO (b): Constant pressure release of LNG through a broken instrument connection (25 mm instrument connection) | |||
| Constant pressure release study for 13 mm and 6 mm holes in hose assuming: | .a) ESD shutdown time of 1 min. | ||
| .b) ESD shutdown time of 30 sec. | |||
| .c) ESD inoperative: 2 min to pump stop and manual isolation. | |||
| Possibility of other scenarios to be studied based on agreement between PAA and analyst. Possible national requirements to be evaluated. | |||
| Grid | Whichever results are derived from CFD calculations they will be as good and accurate as the grid used to describe them. Figure 14, below, present the effect over flow calculations of having a coarse or finer mesh. | ||
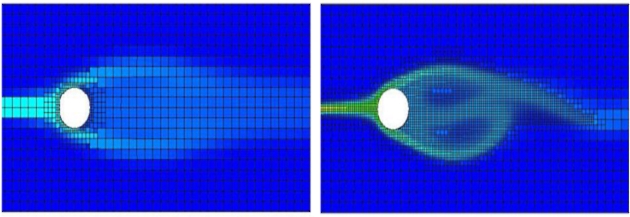 | |||
| ↑ Fig. 14 Flow around a cylinder – CFD representation with coarse mesh and with finer mesh in the locations of interest (wake field) | |||
| It may be argued that finer mesh detail, introducing more calculations will inevitably burden over computational calculation times. There should be a cost-benefit balance between the mesh structure used and the purpose of the work. To support decision-making in setting Safety Distances there should be, in principle, no special need to be excessively detailed in terms of detailed turbulent structures. The main objective/goal should be the overall definition of a zone where LFL may travel through potentially meeting ignition source. For that purpose the non-linear small scale effects are, in principle, not relevant. | |||
| Convergence will likely be the main measure of quality of a Computational Calculation. Through a Convergence Test it is possible to compare the quality of results of a given model along iterative calculations, determining a minimum acceptable difference/error (%) between two consecutive iteration results. LNG cloud dispersion problems following LNG accidental releases, as other fluid flow problems, are highly nonlinear in nature. Only through imposing restrictive conditions can the governing Navier-Stokes equations be solved analytically. As a result, CFD solutions must be calculated iteratively. This begs the question: How do I know when my solution has approximated enough to reality? If no real world results are known for validation, this will be done iteratively between two consecutive results. The question is then how do the analyst, and the PAA, conclude that the solution has converged (to acceptable result). Since the point at which the analysis is deemed converged is defined by the judgment of the analyst, he should have a solid understanding of when the analysis has reached its final solution. | |||
| Typically, when assessing the convergence of a steady state CFD analysis, at a minimum monitor the following three criteria as the analysis progresses: | Residual Values; | ||
| Solution imbalances; | |||
| Quantities of interest. | |||
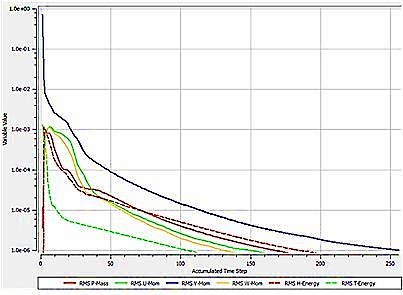 | |||
| ↑ Fig. 15 RMS convergence diagram – Minimization of root mean squares of residuals between consecutive iterations | |||
| For CFD, RMS79 residual levels of 1E-4 are considered to be loosely converged, levels of 1E-5 are considered to be well converged, and levels of 1E-6 are considered to be tightly converged. For complicated problems, however, it’s not always possible to achieve residual levels as low as 1E-6 or even 1E-5. PAAs should, in particular for the CFD results provided, as for any convergence results or, at least, procedures, to be explained in the final report. | |||
The factors included in table 5 all contribute collectively to the quality of computational calculations for LNG vapour cloud dispersion. They are mostly related and relevant to CFD calculations. Integral models programming and inputs also have different variables that are to be taken into account. Reports on computational calculation should all include the relevant parameters and assumptions to allow the quality assessment of any computational generated results.
Summary Table
Table 6, below, includes a summary of the methodologies, presented in the previous sections, for Safety Distances calculation.
| Table 6. Methodologies for Safety Distance Calculation – Summary Table | ||
|---|---|---|
| Method | Advantages | Disadvantages |
| Analytic | Good for a first coarse estimation. | May involve complex mathematical calculations. |
| No need for complex software, taking into account fundamental first principles. | Difficult geometric visualization of dispersion patterns. | |
| Prone to error | ||
| ISO (a) Release of the trapped inventory in the bunkering transfer line | Easy to use curves, available in ISO standards. | Lack of information on parameters and conditions behind the curves. |
| ISO (b) Constant pressure release of LNG through a broken instrument connection | Scenarios for both cases (a) and (b) may not be fully realistic. | |
| For (a) a 25 mm hole is seen as a less credible scenario. | ||
| Computational – Integral | Easy to use, with accessible software. | Usually limited to modelling of circular pools, flat substrates, and heat transfer only from the substrates. |
| Lighter computational demand, when compared to more complex computer CFD tools. | May be insufficient to model situations where LNG vapour dispersion flow is predominantly non-linear. | |
| Adequate for the purpose of setting Safety Distances when local conditions do not present complicated constraints. PHAST ability to model spills on both land and water. | ||
| Computational – Box/Top-Hat | Fast computational time. | Loss of LNG cloud complete structure due to averaging. |
| Reasonable accuracy. | Cannot model complex terrain or flow around obstacles. | |
| Computational – CFD/Navier-Stokes | Can model complex terrain and flow around obstacles. | Excessive computational effort and long calculation times. |
| Typical customised and easy to use interface. | May introduce errors which are difficult to visualize. | |
Developing Practice
Developing practice is to set the safety zone based on the flammable extent from a maximum credible release of LNG where:
- Maximum credible release is determined by consideration of potential failure scenarios;
- and Flammable extent is the distance to the lower flammable limit (LFL) of the dispersing gas which is approximately 5 % methane in air.
The concept of a maximum credible release acknowledges that it is not always possible to set a safety zone based on a worst-case release, but it is always appropriate to set a zone that provides protection of persons in the majority of release scenarios, so called, meaningful protection. It is therefore important that flammable extent is calculated accounting for representative weather and operational conditions, that is, atmospheric stability, wind speed, temperature, humidity, transfer pressure, hose diameter and time to isolate the release. Calculation will also need to consider:
- release orientation, although results suggest that generally downward releases provide the greatest flammable extent;
- and release height and surface, as both of these influence dispersion.
Established models using empirical relationships of dispersion phenomena can be used. However, this may need to be supplemented by expert judgement and/or modelling using computational fluid dynamics (CFD) where large obstacles such as ships, buildings and terrain can channel dispersion and significantly increase or decrease horizontal and vertical flammable extent.
It will be interesting: LNG Regulatory Framework International and European Maritime Safety Overview
Considering release sources and likelihood, and emergency shutdown arrangements, developing practice is tending towards a maximum credible release based on instrument failure. In such cases, and for dispersion modelling purposes, effective release diameters representing 1/2 inch or 1/4 inch have been used (modelled as 5 mm, 6 mm, 10 mm or 13 mm diameter). Obviously, the effective diameter must be determined based on equipment specifics, therefore, ½ inch and ¼ should not be simply assumed as appropriate without justification.
Few modelling results have been published. Table 7 provides some indicative flammable distances (extents) using “empirical relationship” type models. These distances are for guidance only and are not intended to replace modelling and expert judgement/analysis with respect to bunkering specifics.
| Table 7. Indicative Flammable extent (meters) – Summary Table | ||||||
|---|---|---|---|---|---|---|
| 3 | 5 | 6 | 7 | 9 | ||
| F2 – stability F, wind speed 2 m/s | Release at 1 m elevation onto | |||||
| Water | 100 | 115 | 120 | 125 | 130 | |
| Land | 95 | 100 | NA | 110 | 115 | |
| Release at 3 m elevation onto | ||||||
| Water | 100 | 115 | 120 | 125 | 130 | |
| Land | 95 | 100 | NA | 110 | 115 | |
| A1 – stability A, wind speed 1 m/s | Release at 1 m elevation onto | |||||
| Water | 40 | 45 | 50 | 55 | 60 | |
| Land | 40 | 45 | NA | 55 | 60 | |
| Release at 3 m elevation onto | ||||||
| Water | 50 | 55 | 60 | 60 | 65 | |
| Land | 45 | 55 | NA | 60 | 65 | |
- All values above refer to horizontal extent from the release point. Vertical extent approximated 5 m in all cases.
- Effective release diameter, ½ inch. 4 inch diameter hose.
- Downward releases determine maximum extent in F2 (clear night, low wind speed, little or no cloud cover).
- Horizontal impinged releases determine maximum extent in A1 (hot still day, no clouds cover).
- Modelled using PHAST assuming: 100 % methane, 420 kg/m3; continuous release at transfer pressure; 74 % relative humidity; surface roughness of 0,1 for releases onto land (concrete) and 5 mm for releases onto water; operating temperature of minus 160 °C; lower flammable limit (LFL) of 5 % at 44 000 ppm (v/v); and a default “averaging time” of 18,75 s.
Approval
Approval of Safety Zone is of the responsibility of the PAA during Permitting, subject to Confirmation prior to each Operation, at Pre-Bunkering phase:
- Permitting: During presentation of the project/facility for Permitting, where the intended Safety Zones should be specifically indicated in the LNG Bunkering Management Plan. Operators will include the calculation.
- Pre-Bunkering: Prior to LNG bunkering operation, PAA should check consistency with permit approved Safety Zone.
The following elements should be checked for approval of Safety Zones by PAAs:
1 Permitting (Approval of Safety Zone):
A Identification of Safety Zone in suitable diagrams/plans where the whole LNG bunkering system is represented, including surrounding infrastructure elements. All relevant areas within the proposed Safety Zone should be clearly identified with the indication of points of contact for each area.
Areas in the vicinity of the LNG Bunkering Safety Zone should also be clearly identified in particular indicating the existence of:
- Hazardous Zones;
- Populated areas;
- Potential Ignition sources
- or Gas trapping points.
Should different Safety Zones have been approved during Permitting, all should be included in the diagram view, with the reference to the parameters followed.
B Supporting Report with Calculations for the definition of the Safety Zone. One or more of the references below should be presented:
i. Analytical Calculations, based on first principles calculation, following.
ii. ISO Methodologies, following ISO/TS 18683, or ISO 20519, curves for ISO (a) or (b) methods, with the clear indication of the parameters assumed to read from the curve
iii. Computational calculations/CFD, identifying the responsible person for the calculations, the code used, assumptions followed and parameters used for modelling, verification & validation procedures, including convergence of model, with an RMS of less than 1E-5, mesh refinement location, boundary conditions.
C LNG Bunkering Management Plan, to be checked for reference to Safety Zones, in particular provisions for its establishment and control.
2 Pre-Bunkering (Confirmation of Safety Zone):
A Confirmation of LNG bunkering parameters, as indicated in the LNGBMP. Prior to initiation of LNG Bunkering Safety Zone must be Confirmed, taking into account the verification of the LNG bunkering parameters, local conditions, potential restrictions and other factors that may have to be accounted for by PAAs, in conjunction with Operators. (RSO and BFO).
B Safeguards, with the verification that safeguards contributing to the definition of the Safety Zone, possibly defined in a risk assessment, are implemented.
C Context Evaluation, considering any operational aspects which had not been foreseen during permitting, including any possible construction/maintenance works, temporary modifications.
As per the above it is important to note that a Safety Zone should only be implemented if: Approved and Confirmed. Elements relevant to the Approval should be documented as part of the Permitting/Certification documents. Those relevant to the Confirmation should be part of the Authorization documents, i. e. supported by check-list procedure.
Enforcement
Following its Approval and Confirmation, the Safety Zone is implemented by the Operators (BFO/RSO) and controlled/verified by the PAAs. Other arrangements are however possible, based on each port regulation or possible agreement with between operators and PAAs.
The following elements should be in place to enforce the Safety Zone:
- Physical barriers
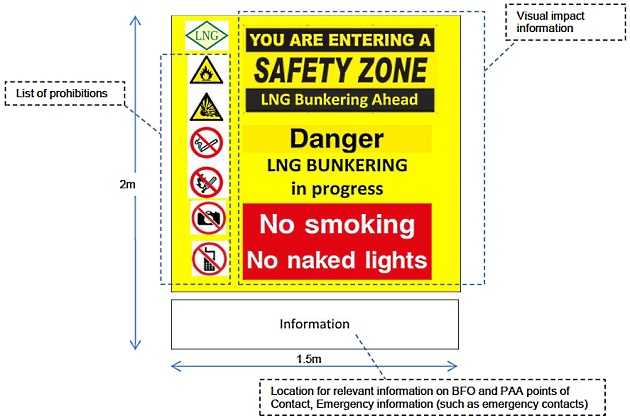
- Visual support with warning, prohibitions and information on points of contact for BFO and PAA (figure 16).
- Contacts for Emergency.
- Portable semaphores (wherever found relevant for traffic control, inside the port area or in any adjacent road).
All the resources and means to establish monitor and control the Safety Zone should be provided by the Operators, subject to inspection/verification by PAAs.
The exact number of barriers and their location will be highly dependent on the local infrastructure and access points. Special attention should be given to areas where the proximity of densely populated areas requires the introduction of possible safeguards defined in a Risk Assessment. All the defined safeguards as described in the LNGBMP should be enforced as appropriate.
Implementation
The implementation of the LNG Bunkering Safety Zone may find some particular aspects that should be evaluated in a risk assessment. Each port will represent a particular challenge to implementation with different operational constraints and proximity to populated or commercial areas. In this section two special situations are addressed:
- Proximity of a public road.
- and Other ships crossing the Safety Zone.
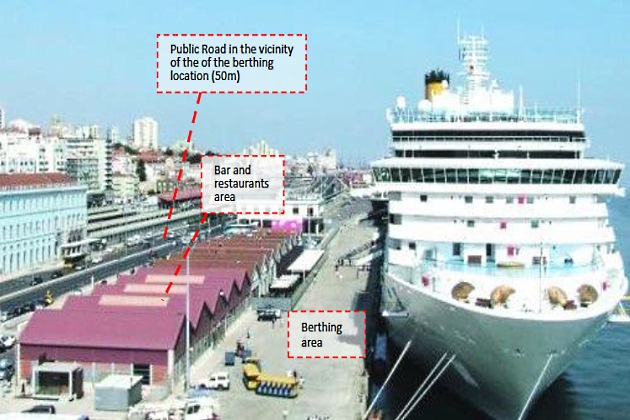
1 Proximity of a public road
Where the Safety zone is crossed by traffic routes which cannot be halted for long periods (typically in ports highly integrated with more populated locations) there should be control over traffic lanes that could, in the event of an LNG accidental release, be stopped. This can potentially be achieved with good coordination and alarm dissemination that allows, on one hand the normal traffic operation and, on the other hand, the LNG bunkering location in a densely populated area.
Read also: The Role of LNG Bunkering Infrastructure
An example is shown in figures 17 on how a Safety Zone can be established in a berthing location of a port which is highly integrated with a public area within a city. The example shown is characteristic of many cruise ship terminals, reflecting an aspect which is familiar in many ports in Europe.
LNG bunkering in such situations would necessarily have to address all the context elements in a risk assessment. In the case presented below the elements are only shown as an exercise under the topic of “safety zone enforcement”.
It is here assumed that all define safeguards were derived from a risk assessment approved by PAAs.
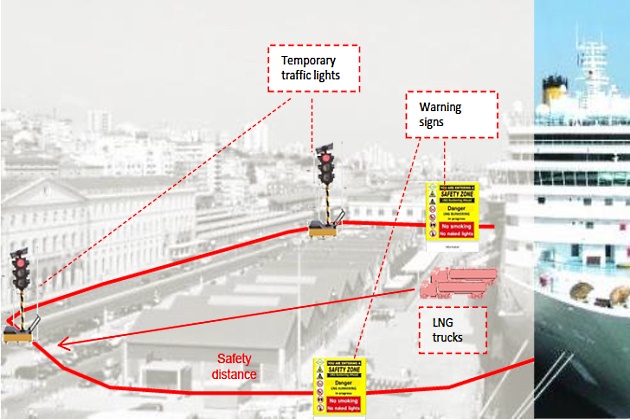
Referring to the example in figures 18, the following measures could be considered for the implementation and enforcement of the Safety Zone:
- Confirm the Safety Zone as outlined in “Approval”, verifying elements from the LNGBMP.
- Define physical barriers where feasible, as shown in figure 18 (below), at the top ends of the berth.
- Introduce Warning Signs, with information on both ends of the berth.
- Include all commercial areas inside the Safety Zone, ensuring Ventilation intakes not in operation and isolated.
- Place mobile/portable traffic lights, automated and, if possible ESD-connected, to halt traffic in the event of an accident.
The procedure above would have to be the result of a risk assessment, respecting the safeguards discussed and in place.
Such a bunkering operation would preferably take place at times when restaurants would still be closed and with minimum typical traffic intensity.
Even though ISO/TS 18683 and ISO 20519 definition is clear in indicating define LNG Bunkering Safety Zone as the area around the bunkering station where only dedicated and essential personnel and activities are allowed during bunkering, it should be possible to consider crossing of a Safety Zone area, if sufficient safeguards and risk mitigation measures are put in place.
2 Other ships and the Safety Zone
Another possible implementation challenge that may arise during LNG bunkering operation is the possibility for other ships intending to cross the Safety Zone. How to consider this situation should be a possibility addressed in the context of a risk assessment. Figures 18 illustrate this situation and (vessel identified with nr.3), adding 2 more vessels: one at berth, inside the Safety Zone (nr.4) and another in the vicinity of the Safety Zone (nr.6).
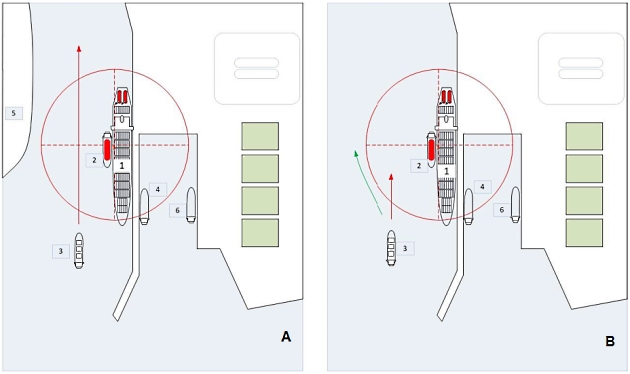
For vessel nr.3, in situation “A” (figure 19), the restricted channel gives it no chance to deviate from the Safety Zone, whereas in “B” this is not the case and sufficient clear waters exist to avoid crossing the Safety Zone established for the STS operation, should it be signalled. PAAs should ensure that both these situations are addressed.
Should passing through the Safety Zone be inevitable (situation “A“), there should be in place a procedure to make the LNG Bunkering Safety Zone limits well visible and to allow the passing vessel to do so in the safest way possible. On the other hand for passing vessels which have the option to pass farther they should be directed to do so, avoiding the Safety Zone.
All communications to be done should be established in the port radio call frequency.
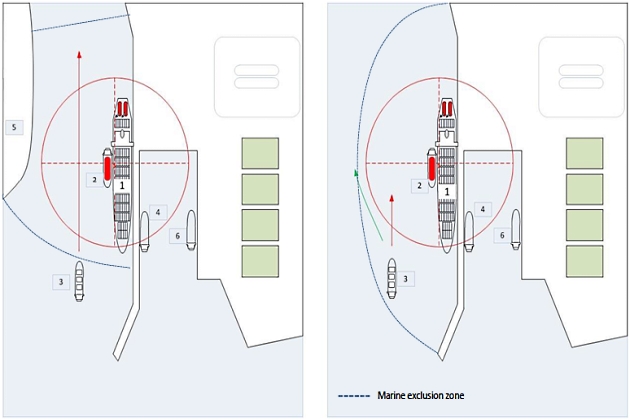
An alternative would be to create a Marine Exclusion zone, as defined in figure LNG Bunkering Hazardous Zone“Control Zones – Hazardous and Safety Zone, Monitoring and Security Area Marine Zone and External Zone also represented” (SGMF Guidelines v2, 2016), introducing a higher disruption in the port activities and operations, but making it possible to prevent any passages through the Safety Zone (see figure 19).
For passing vessels the following possibilities are available to PAAs which, for allowing other ships to pass the Safety Zone, can establish.
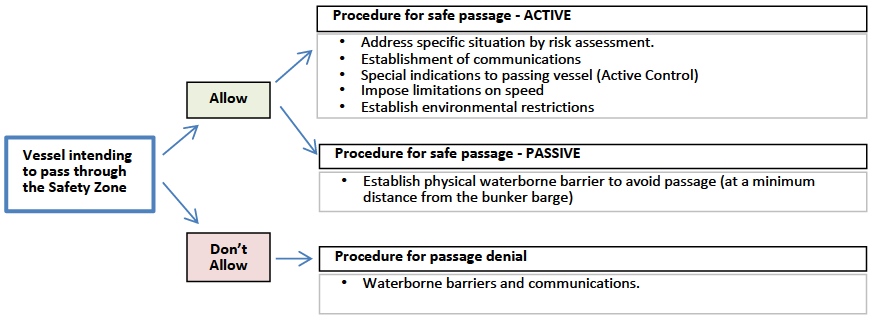
For vessel nr.4, at berth, just inside the Safety Zone, there should be given indication for special protective measures to be implemented. The establishment of communications and the designation of a point of contact onboard should be the main measures to consider. In the event of an accidental LNG release it is important to disseminate alarm and give the possibility for other vessels within the Safety Zone, or in a nearby location, to shut-down ventilation and establish other measures for the immediate mitigation of ignition risk.
For vessel nr.6, at berth in a nearby location, the measures to consider should be judge by the PAA. In principle, as a good practice orientation, should the vessel be just outside the Safety Zone, the procedure to implement should be exactly the same as with nr.4.
Read also: LNG IMO Tanks/Containment Systems
It is important that the Safety Zone is not regarded as a fixed boundary where risk increases from “no risk” to “maximum risk” just by crossing the virtual boundary of the LNG Bunkering Safety Zone. More than the geometric exercise of the Safety Distance it should be important to check for actual meaningful protection within the Safety Zone and in its vicinity, where justifiable and appropriate.
Finally, for every case presented, it is important to make note that each port will necessarily present a different specific reality and context. Each port will be different in terms of spatial planning, restrictions, intensity of nautical traffic or operations within the port area in a multi-operator environment. All measures should however be taken, in cooperation between operators and PAAs, so that LNG bunkering takes place at a location and time where and when less disturbance is expected.

- Study on the completion of an EU framework on LNG-fuelled ships and its relevant fuel provision infrastructure, LOT 1 Position paper: Towards harmonized EU LNG bunkering guidelines, DNV-GL, 2016.
- Study on the completion of an EU framework on LNG-fuelled ships and its relevant fuel provision infrastructure, LOT 1 Final Report, DNV-GL, 2016.
- LNG Bunkering Guidelines IACS Recommendation n. 142, on LNG Bunkering, IACS, 2016.
- ISO/TS 18683:2015. (15-Jan. 2015). Guidelines for systems and installations for supply of LNG as fuel to ships. Technical Specification.
- Society for Gas as a Marine Fuel (SGMF). (2015). Gas as a marine fuel, safety guidelines, Bunkering. Version 1.0, February 2015.
- ISO 20519:2017. Ships and marine technology – Specification for bunkering of gas fuelled ships. (International Standard).
- IEC 60079-10-1. (2015). Explosive atmospheres – Part 10-1: Classification of areas – Explosive gas atmospheres.
- Directive 1999/92/EC – ATEX of the European Parliament and of the Council of 16 December 1999 on minimum requirements for improving the safety and health protection of workers potentially at risk from explosive atmospheres (15th individual Directive within the meaning of Article 16(1) of Directive 89/391/EEC).
- API RP-500. 1997. Recommended practice for classification of locations for electrical installations at petroleum facilities classified as CIass 1, Division 1 and Division 2. Washington. D.C: API.
- API RP-505. 1997, Recommended practice for classification of locations at petroleum facilities classified as Class I, Zone 0, Zone 1 and Zone 2. Washington, D.C. API.
- NFPA 497. 2012, Recommended practice for the classification of flammable liquids, gases or vapours and of hazardous (classified) locations for electrical installations in chemical process areas. Quincy, MA: NFPA.
- IEC EN 60079-10-1 Ed.1.0, 2008. Electrical apparatus for explosive gas atmospheres – Part 10-1: Classification of areas – Explosive gas atmospheres. International Electrotechnical Commission.
- Commission Decision 2010/769/EU of 13 December 2010 on the establishment of criteria for the use by liquefied natural gas carriers of technological methods as an alternative to using low sulphur marine fuels meeting the requirements of Article 4b of Council Directive 1999/32/EC relating to a reduction in the sulphur content of certain liquid fuels as amended by Directive 2005/33/EC of the European Parliament and of the Council on the sulphur content of marine fuels (OJ L 328, 14.12.2010, p. 15).
- USCG CG-OES Policy Letter 02-14 – Guidance Related To Vessels And Waterfront Facilities Conducting Liquefied Natural Gas (LNG) Marine Fuel Transfer (Bunkering) Operations.
- ADN – European Agreement concerning the International Carriage of Dangerous Goods by Inland waterways (Update version ADN January 2017).
- ADR – European agreement concerning the International Carriage of Dangerous Goods by Road (Update version ADR January 2017).
- Rhine Vessel Inspection Regulations (RVIR).
- EU general risk assessment methodology (Action 5 of Multi-Annual Action Plan for the surveillance of products in the EU (COM(2013)76) – Document 2015-IMP-MSG-15 – 16 October 2015.
- Safety Study, Chain analysis: Supplying Flemish ports with LNG as a marine fuel, Analysis of safety aspects, June 2012.
- EN 1160 – Installations And Equipment For Liquefied Natural Gas – General Characteristics Of Liquefied Natural Gas, NBN, 1st edition, August 1996.
- ESD Arrangements & Linked Ship/Shore Systems for Liquefied Gas Carriers, SIGTTO First Edition 2009 – SIGTTO.
- M. Kofod & S. Hartman, T. Mundt – Review of Recent Well-to-Wake Greenhouse Gas Studies evaluating the use of LNG as a marine Fuel, IMO MEPC/INF.15.
- LNG Access Code for Truck Loading for The Zeebrugge LNG Terminal – Based on version approved by the CREG on September 19th 2013 – Applicable as of January 1st 2014 – FLUXYS.
- Guidance for the Prevention of Rollover in LNG Ships – SIGTTO – First Edition 2012.
- Wang, Siyuan & Notteboom, Theo – The role of port authorities in the development of LNG bunkering facilities in North European ports, 14 January 2015, World Maritime University 2015.
- Verhoeven P (2010) A review of port authority functions: towards a renaissance? Marit Policy Manag 37:247-270.
- Society for Gas as a Marine Fuel (SGMF). (2017). Gas as a marine fuel, safety guidelines, Bunkering. Version 2.0, February 2015.
- COM(2003) 515 final – Communication from The Commission concerning the non-binding guide of good practice for implementing Directive 1999/92/EC of the European Parliament and of the Council on minimum requirements for improving the safety and health protection of workers potentially at risk from explosive atmospheres, Brussels, 25.8.2003.
- Davies, P. (2016) – Bunkering LNG: Setting the Safety Zone, 7th Motorship Gas Fuelled Ships Conference, November 2016.
- International Association of Oil & Gas Producers. (1-Mar 2010). Risk Assessment Data Directory – Process Release Frequencies. Report No. 434 – 1, 1 March 2010). Pertinent data from this report is summarised in: Davies & Fort, (Sept 2012), LNG as Marine Fuel – Likelihood of LNG Releases, Journal of Marine Engineering and Technology.
- PGS2 – TNO Yellow Book – Methods for the calculation of physical effects, due to releases of hazardous materials (liquids and gases) – CPR 14E (3rd Edition, 2005) – TNO – The Netherlands Organization of Applied Scientific Research.
- OECD Guiding Principles for Chemical Accident Prevention, Preparedness and Response, Guidance for Industry (including Management and Labour), Public Authorities, Communities, and other Stakeholders – 2nd Edition (2003) – OECD Environment, Health and Safety Publications.
- DNVGL-RP-G105 Edition October 2015 – Development and operation of liquefied natural gas bunkering facilities, Recommended Practice, DNV GL, 2015.
- USCG CG-OES Policy Letter No. 01-17 – Guidance for Evaluating Simultaneous Operations (SIMOPS) during Liquefied Natural Gas (LNG) Fuel Transfer Operations.
- LGC NCOE Field Notice 01-2017 – 14-Aug-17 – Recommended Process For Analysing Risk Of Simultaneous Operations (SIMOPS) During Liquefied Natural Gas (LNG) Bunkering.
- An Overview of Leading Software Tools for QRA, American Society of Safety Engineers – Middle East Chapter (161), 7th Professional Development Conference & Exhibition, March 18-22, 2005.
- Walter Chukwunonso Ikealumba and Hongwei Wu (2016) Some Recent Advances in Liquefied Natural Gas (LNG) Production, Spill, Dispersion, and Safety School of Chemical and Petroleum Engineering, Curtin University.
Did you find mistake? Highlight and press CTRL+Enter