Natural gas has solidified its position as a critical component of the global energy landscape, serving as a vital source for electricity generation, industrial processes, and residential heating. The journey of natural gas from extraction to end-user is complex, influenced by a myriad of factors that ultimately dictate its market price. Understanding “Natural Gas Energy Pricing” is not just about observing numbers on a screen; it’s about delving into the intricate interplay of supply and demand, geopolitical events, technological advancements, and environmental policies.
- Introduction
- Energy pricing, supply, and demand
- Sustainability and the Increasing Fascination with Natural Gas
- Is Natural Gas Always “Nonrenewable”
- US Natural Gas: Pricing, Markets, Risk Management, and Supply
- Some Features of Current Natural Gas Pricing in the United States
- US Energy Markets: The Regulation – Deregulation Nexus
- Energy Price Volatility and Derivatives
- Natural Gas Supply in North America
These elements collectively shape the cost of this essential fuel, impacting economies, industries, and households worldwide. As the world navigates energy transitions and strives for sustainability, the dynamics of natural gas pricing remain a pivotal area of focus for policymakers, investors, and consumers alike.
Introduction
The pricing of natural gas as an energy commodity presents a number of features of historic significance. These historical elements relating to the politics and economics of the development of oil and gas resources are highly significant in their own right. Indeed, natural gas is playing an increasingly important role as an alternative to crude oil and the gasoline and numerous other by-products refined from petroleum. At the same time, a number of nonhistorical components also enter into the pricing of natural gas as an energy commodity. Some of these elements, especially those implicated in Prevention of Environmental Pollution by Tankers in the Event of Chemical Spillsenvironmental pollution, have an intangible connection to gas pricing, although one would be hard-pressed to ferret out its exact contribution to consumers’ expense. Appropriate intervention by the working engineer can do wonders for preserving the environment and all of us living in it from serious harm in the short term and the long term. Nothing including the most precious energy commodity, can have a higher value than human life, which forms the starting point of this chapter.
Although natural approaches in general, and their usefulness for addressing environmental problems created by current energy development technologies and approaches in particular, are beyond the scope both of this chapter and of conventional concerns about gas pricing, throughout the rest of this chapter some of the obstacles that have been strewn along and throughout the various paths toward the goal of knowledgebased, all-natural, researched solutions to what some have called “our technological disaster” – solutions that would prove innovative, economically attractive, environmentally appealing, and socially responsible – will be pointed out. The principal goal of this chapter is to examine natural gas energy pricing with the aim of answering the following question: considered from an engineering standpoint, how consistent with their actual potential are the patterns, changes, and trends in the supply of and demand for so-called “nonrenewable” energy commodities?
Energy pricing, supply, and demand
In recent years there has been an increasing recognition that the actual supply and demand for energy commodities diverge significantly from the conventional economic notions and expectations concerning the supply and demand of commodities. Much effort has been expended to define and account for the divergence as an exception relating mainly to the strategic character of energy as a commodity in a globalized marketplace. The problem with an analysis that goes only this far, however, is its failure to explain why current economic theory as a body of theory fails to account for, or predict, the energy exception. Without such comprehension at the level of theory, it becomes difficult, if not impossible, to discover or elucidate any paths that could or might overcome the numerous contradictions and downsides inherent in the present marketing and pricing arrangements in place for energy commodities.
Source: AI generated image
What do such considerations have to do with the price of gas? Consider what happens with the hydrogen sulfide (H2S) stream recovered from the natural gas-processing scenario. The recovered hydrogen sulfide gas stream itself is considered an object of “waste management“. It “may be either vented, flared in waste gas flares or modern smokeless flares, incinerated, or utilized for the production of elemental sulfur or sulfuric acid”. Any of the first three options require regulation as potentially hazardous emissions. Again what is being proposed is to burden society with a further problem arising from the original technological decision to “sweeten” the gas as “efficiently” as possible rather than innovate delivery systems that would avert creation in the first place of additional waste management expense. What these waste management expenses actually represent for those selling natural gas is a further cost factored into the final delivered price of the product – to pay for meeting the US Environmental Protection Agency (EPA) standard. (The fourth option, which would not only potentially generate new revenue but do so in a manner that undergirds ongoing Usage of Natural Gas Compressors in the Gas Production Operationsproduction of natural gas with an additional productive purpose as a feedstock generator, is neither discussed nor framed in EPA discussions as part of the planning of natural gas processing).
Read also: Guidance on HAZID and HAZOP for LNG bunkering operations
If the recovered H2S gas stream is not to be utilized as a feedstock for commercial applications, the gas is usually passed to a tail gas incinerator in which the H2S is oxidized to SO2 and is then passed to the atmosphere out a stack. Future gas engineering projects might want to take note of the fact that smokestack wastes are one of the most endemically costly and health-threatening Hazards, Risks and Controls available for Safe Containment of Hydrocarbonsenvironmental hazards of modern living and accordingly undertake a waste conversion plan capable of returning a revenue stream that allows the production and transmission costs as well as the delivered price of natural gas either to be reduced or its rate of increase contained. These wastes are especially strongly implicated in the return and increasing occurrence of asthma not only in children, but in many sections of the adult population. In the United States and Canada, the smokestack waste from the Ohio Valley region actually created the well-known problem of “acid rain“. Even as many ingenious methods have been developed to neutralize the quite varied effects of such precipitation on everything from:
- groundwater quality to the health of the southern boreal forest cover of eastern North America in general and its maple and other hardwood tree growth in particular, the geographic region involved takes in the territories of eastern Indiana state, southern Michigan state, and the state of Ohio in the catchment zone of the Ohio Valley;
- southwestern Ontario and southern and eastern Quebec, in central Canada;
- northern New York, Vermont, and New Hampshire in the northeastern United States, the catchment area of the St. John River system in Maine, Quebec, and New Brunswick;
- and the Cobequid Hills of northern Nova Scotia.
A careful and reasoned calculation of all the costs and benefits derivable from taking the particulates vented as smokestack waste in this major acid rain-vulnerable zone and recapturing them for production of nanomaterials would likely prove most instructive as well as enlightening on the matter of how inflexible present production, delivery, and pricing arrangements for natural gas actually are.
Science and engineering issues of technological development have become consciously disconnected from rational considerations of the overall aims and needs of human social life, a disconnection that leads to, and feeds, an incoherence that becomes increasingly intolerable in our current “information age“, when information as the building block of useful knowledge and understanding has become available in quantities and detail as never before, but the research and thinking needed to make such a flood of information coherent, comprehensible, and useful remain extremely rare quantities indeed. The working engineer must never forget that there are alternatives, but, remarkably, while the EPA web site generated 5443 “hits” in response to a query for article titles from its libraries that deal with “glycol and natural gas processing“, a request for article titles discussing “glycol substitutes” returned a grand total of 2 “hits“.
In the course of addressing gas-pricing issues in this chapter, some key elements of the massive disinformation attending the entire notion of “renewable” versus “nonrenewable” energy sources will be mentioned. The price mechanism and price formation for these resources as energy commodities do not depend upon mainly or solely upon any of their inherent material characteristics as raw materials, nor on their particular properties as energy sources. Nor do these price mechanisms and price formation depend purely or even mainly upon the conditions limiting or enabling how humanity accesses them. Not the prices themselves, but certainly the processes of energy commodity price formation and associated price movements remain circumscribed to an uncannily large degree by the evolution of energy policy in the context of world-altering developments at the level of international politics and economics as they emerged at the end of World War I. The decisive role of the overall economic system in these price mechanisms and price formation has been influenced greatly by this context, even into our own time. The leading features of this overall economic system have exercised distorting influences over the engineering approaches taken to the development of these resources.
Practical as the concerns must be of the working engineer, an essential barrier to humanity achieving a truly functional as well as just solution to our current energy supply-demand conundrum is to be found in this historic legacy.
Sustainability and the Increasing Fascination with Natural Gas
The entire question of the sustainability of economies dependent on fossil fuels as their principal energy source – be it for transportation, for domestic uses such as heating and cooking, or for the provision of electrical power for industrial or domestic markets – is affected and influenced by changes over time in the pricing structure of the production and delivery of these resources. However, there still seems to have no price at which humanity will give up seeking and harnessing these resources. Thus, as influential as shifts in prices and production costs may appear in the short term, the price mechanism as such, left to its own devices, is unlikely to play a determining role in how choices are made between different energy alternatives for the long term. As the long term is exactly what sustainability is all about, however, and as evidence has accumulated about the finitude of existing conventional reserves that are either in production or under exploration, a great hubbub has broken out over whether the world is about to enter the era after which oil production will have “peaked“. Matters of this kind insert an element beyond conventional notions of risk assessment that become highly problematic for predicting price trends and resource “futures“. At the same time, it seems likely that a sustainability factor will have to be considered for longer term contracts of the kind, for example, recently signed between China and Iran, locking in production and distribution of the output of the world’s largest gas field to date for the next 30 years. Gas supplies in North America are no less affected by sustainability considerations: if present plans materialize in the next 10-15 years, US imports of natural gas from Canada will more than double, but not on the basis of increasing gas production in Canada so much as by increasing pipeline throughout of liquefied natural gas (LNG) brought ashore at termini in Canadian ports on the Atlantic, the Pacific, and in the St. Lawrence River connected by pipelines to receiving centers in the United States. Interestingly also in this connection, recently revised estimates by the US Energy Information Administration about future supplies of natural gas for the United States from Canadian fields have noted a strong likelihood that increasing quantities of Alberta gas are likely to be diverted as feedstock for the heavy oil-refining process, which extracts “synthetic crude” from the bitumen mass of the oil sands.
An associated aspect of the sustainability problem arising in regard to Canadian-supplied quantities of natural gas for the US market concerns the increasing de facto annexation of Canada and its economic development policy by the United States While consolidation of the pipeline supply from Canada to the United States is bound to improve economies of scale that will drive prices downward for US customers or at least arrest any tendency for the price to rise, the situation viewed from the Canadian side of the relationship may be very different. Already, for example, almost none of the gas piped from the Sable Island gas field off the province of Nova Scotia to New England is diverted to, or even available for, local markets in the Canadian provinces through which the distributing conduit, the maritimes and northeast pipeline, passes en route to Everett, Massachusetts. If the Canadian-accessed share of the increasing gas throughout predicted in the coming years is similarly limited, how much longer can Canadians be expected to support this development without demanding some rearrangement – with difficult-to-anticipate consequences for consumers on both sides of the border?
These scenarios suggest that future gas pricing based on sustaining the status quo arrangements – the present set of relationships – may compel consumers to pay a hefty and possibly unacceptable premium in the name of sustainability of energy supplies. Scientifically, and at a more fundamental level, the sustainability promised by shifting away from refined petroleum toward natural gas may be little more than a chimera.
It will be interesting: Development of the FLNG and FONG for Gas Extraction
Up until now, the world has been sold on the progression “wood-oil-natural gas” as the most concise description of human progress in energy supply, mainly because or in relation to the technologies brought into the process of delivering energy supplies and content from these sources. However, looking at this arrangement in reverse, the raw material from which reservoir sources of natural gas originate is the oldest, geologically ancient, decayed plant material, oil’s sources slightly younger, and wood’s source the newest of all. In terms of natural mechanics, the younger the energy source, the cleaner its combustion relative to the capacity of the surrounding environment to dispose of the waste product. Thus, the increasing refinements in processing and transmission technologies may not be purchasing greater sustainability in the long term at all. Solid answers to these questions require further research, but the questions themselves go to the heart of the question of technology and whether it ensures anything in itself simply because it is available to be applied.
Is Natural Gas Always “Nonrenewable”
Natural gas is often considered, like crude oil, as being of finite availability, as it is “nonrenewable” (e. g., unlike solar or wind power). This designation slides in alongside the “fossil fuel” designation also used commonly to describe natural gas. To think, however, of natural gas as a “fossil fuel” is actually a starting point for considerable confusion. It is true that natural gas is found frequently in connection with crude oil. It is also true that crude oil is deposited as the decayed remains of ancient flora and that these are found in very ancient geological layers of the earth in which fossilized remains also frequently appear.
As a fuel/energy source, however, the valuable active element of “natural gas” is methane. Methane is present throughout the Milky Way galaxy. It comprises a large portion of entire celestial bodies, such as “gas giant” planets like Jupiter. On Earth, it occurs in many places having no connection whatever with fossil layers in the Earth’s geology, for example, as a major by-product of landfills. In the earth itself at very great depths both on land and in the oceans, there are significant quantities of trapped gas seeking a way to be vented. Finally, there is no set formula for “crude oil“, which appears in raw material form as an inhomogeneous, usually liquid, mass of carbon and hydrogen atoms in a wide variety of proportions, but the chemical formula of methane is always the same, CH4, and, moreover, this chemical configuration of a single carbon atom with four available bonding sites filled each by a hydrogen atom is remarkably stable. Only when some pressure confining it, or some level of thermal energy exciting the atoms as a gas, is removed does its physical state become unstable.
“Nonrenewable” is taken to mean, in the case of a generally considered fossil fuel reservoir, that once a reservoir is exhausted commercially – often it is only possible to extract 20 to 40 % of the reservoir’s estimated crude oil and or gas contents – it cannot be replaced in a time frame that would be useful to humanity within the time frames that normally condition or dictate modern economic existence. It was formed over geological time spans of billions of years; even the hugest oil sources located on this planet would last less than 200 years at current rates of economic activity.

Source: AI generated image
Of course, much natural gas comes from these same reservoirs, formed over the same lengthy geological time span and existing under pressure at various depths in the bowels of the earth. However, whereas crude oil really needed that geological time span to form in liquid state, decaying organic material anywhere can begin to produce methane, the active energetic component of natural gas. In addition to being available in reservoir formations as an energy source, natural gas, can also be extracted as an output of a process of waste conversion.
There is a much homelier example of exactly the same idea for a source of natural gas: landfills. It appears that there is no way modern human societies are not going to produce landfills. One can treat them purely as a waste burden on society or research their possibilities and innovate. Russia, already rated as one of the world’s largest single reserves of conventional sources of natural gas, has a further reserve in municipal solid waste landfills. Although enormous quantities continue simply to be incinerated, the largest biogas complex in Europe are two plants on the outskirts of Moscow fed from some of this waste.
A number of observers of the possible further development of natural gas as a substitute for refined petroleum see the downsides that have become undeniable and that emanate from the cartelized development of the petroleum industry. Some partisans of this line of development assert that natural gas can fill the gap so long as it is developed and made available to end users on a competitive, deregulated, and noncartelized basis.
This is in fact a starting point of yet further disinformation. The actual evolution of the expanded production and distribution of natural gas, organized according to the deregulated model pioneered in the United States, is in fact premised on enabling a “soft landing” for Big Oil on the basis of restructuring government incentives to shift investment from Big Oil into natural gas. It is not about independent business entities undertaking free competition and accepting the government as an independent referee-arbitrator-regulator of their relations. If more or less the same financial interests that created Big Oil and brought it to the present impasse end up directing or are otherwise in charge of the processes of substituting natural gas for end uses currently fulfilled by refined petroleum, the interests of consumers will not be advanced one whit; in fact, their powerlessness will have multiplied. There is considerable evidence accumulating of interlocking directorates throughout the energy industry and that the “arm’s length” relationship that is supposed to exist among those invested in Big Oil and entities undertaking major new investments in natural gas processing and marketing is notional. Already by 1993, a study conducted for the EPA but not published until 1999 found a rapid growth of increasing concentration of US natural gas production and markets in the hands of a remarkably tiny percentage of all enterprises involved in the exploration, production, processing, distribution, or Cargo Storage System Concepts for Liquid Natural Gas Tanksstorage of natural gas. Is this some inadequacy of the deregulated system governing natural gas, is it some “externality” that the deregulation process just never took into account, or is it something the entire deregulation scenario was elaborated to conceal?
Read also: Gas Heaters on Liquefied Natural Gas Carriers
Once the fullest and most unbiased inventory of all sources of natural gas – be it methane emissions from waste or disused coal beds, – is compiled, the question as to whether it is indeed economically sounder to continue with conventional approaches or to conduct research into an innovative delivery system can be settled. Elucidating the history of actual development is quite important for shedding light on where thinking became trapped in the past down various blind alleys, especially where various assumptions about crude oil as a nonrenewable fossil fuel were simply transferred and reapplied willy nilly to natural gas.
Another seed of yet further confusion is the very label “natural” in “natural gas“. The methane fresh from the cow and the methane trapped billions of years ago beneath the Earth’s surface are doubtless equally “natural“, but are their actual potentials as sources of useful energy truly equal? Does pointing out that they both contain CH4 shut down all further discussion of this temporal dimension of the very formation of these compounds?
Overwhelmingly, the main natural gas sources discussed by and within the oil and gas industry, and within the engineering fields of work connected with that industry, are those that can be extracted in connection with crude oil, using pipeline rights of way or related distribution systems developed initially by oil companies, etc. In the context of the political and economic implications of how strategic energy commodities in general are disposed of on the world scale, these same elements are also significant as this entire aspect emerges as a prominent feature of the overall picture.
However, in discussions or considerations in purely engineering-based technical writing on the subject, it is still ordinarily and, it must be said, systematically excluded. This separation of engineering from politics and economics has enabled considerable confusion to grow into outright disinformation. This has spread in the form of two key messages:
- that the oil and gas industry is a hostage to “Nature“, which possesses only finite quantities of usable or accessible energy sources to meet the infinitely expanding needs of humanity;
- and that humanity is the hostage of the oil and gas industry for the foreseeable future as no serious alternative sources of comparable energy content are available or conceivable.
US Natural Gas: Pricing, Markets, Risk Management, and Supply
Some Features of Current Natural Gas Pricing in the United States
The first and most outstanding feature of natural gas pricing is that there has yet to emerge anything like a single world price. However, the rates of increase have tracked upward or downward mostly in conjunction with what was happening with the world oil price.
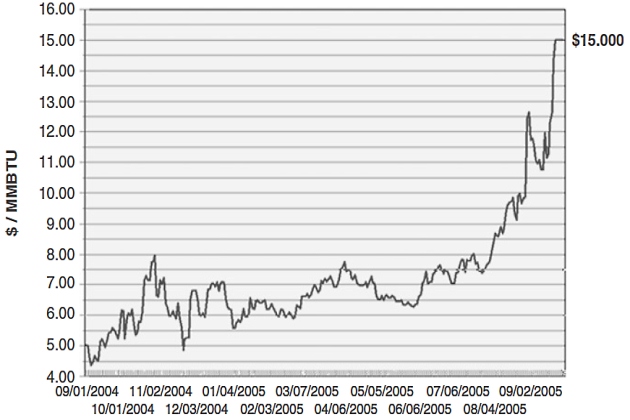
Source: WTRG Economics
The temporary tripling of the Henry Hub spot price for natural gas disclosed in Figure 1 demonstrates the extreme potential effect of a short-term event – in this case, hurricane Katrina, which, in the end, was found to have caused little consequential damage to the gas pipeline network along the Louisiana coast, whose throughput at Henry, Louisana, forms the basis for the so-called “hub price“. This single event and speculation before, during, and after it about the potentially disastrous consequences of the 2005 hurricane season in the Gulf of Mexico never-theless enabled sellers into markets basing themselves on the Henry Hub to double the price from the US $5,00 – 7,50/Mcf band in which gas had traded from 1 September 2004 until the third week of August 2005. Such a jump would not be possible if there was a world price for this commodity. In contrast, in the same time period there was an even shorter-lived “speculative premium” that bumped the price of oil from US $65 to US $70/bbl; it lasted less than 72 h precisely because a world price exists that dampens the impact of such events.
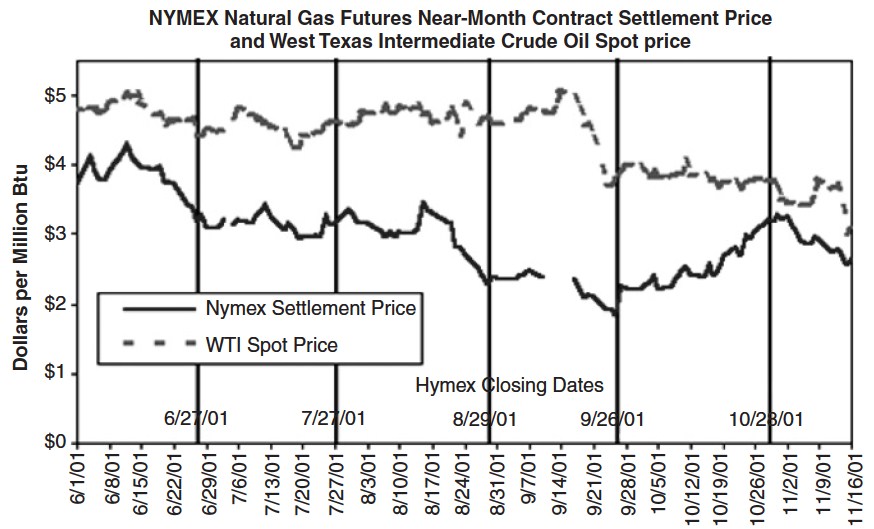
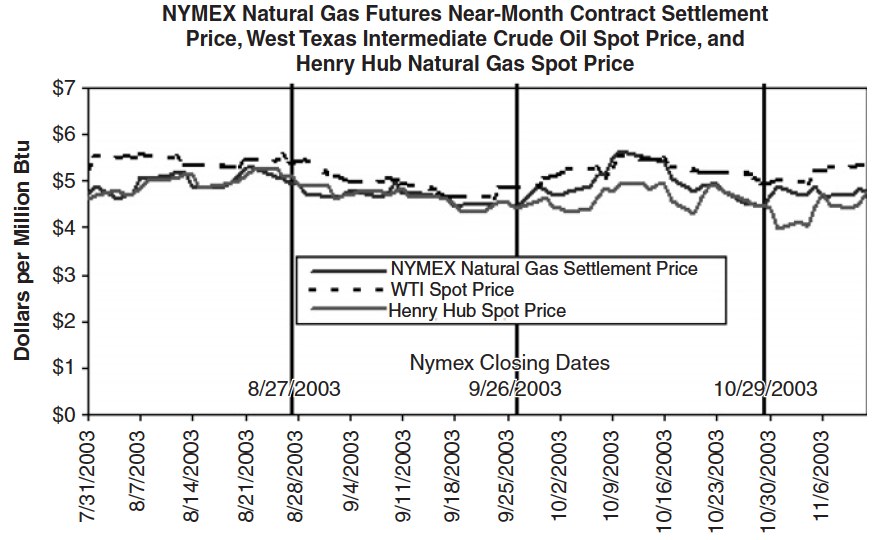
How closely the gas price is hitched to the oil price in the main pricing centers of the United States is clearly disclosed in Figures 2 to 6, documenting the movement of gas and oil prices in a 2 to 3-month window leading up to the third week of November in 2001, 2002, 2003, 2004, and 2005, respectively.
Source: Reuters Information Service
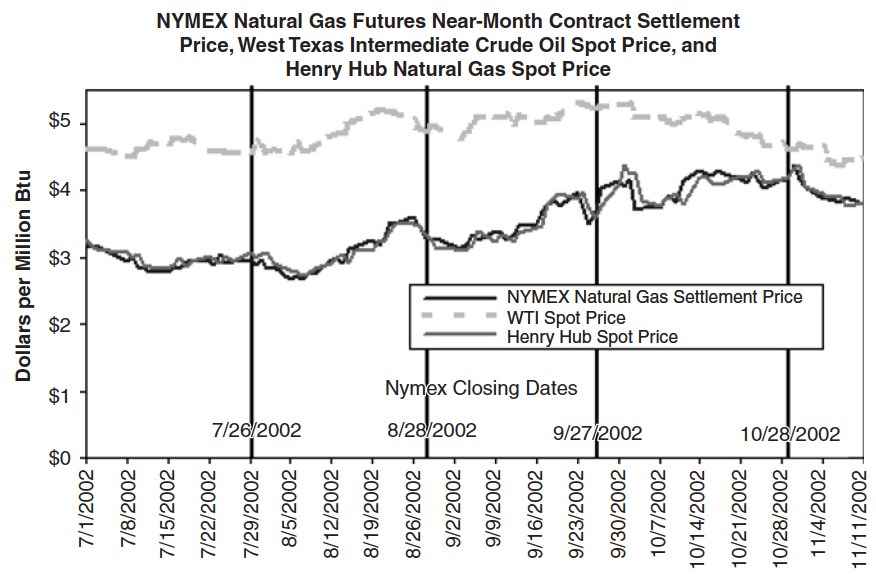
The close tracking of the oil price by that of gas is very evident. When compared in terms of actual energy content, i. e., dollars per million Btu, the prices are rather close but oil is predictably higher, reflecting the widespread industrial demand for feedstock to refine into end products. The same pattern is seen a year later in November 2002 (Figure 3).
Source: NGI’s Daily Price Index
Note: The West Texas Intermediate crude oil price, in dollars per barrel, is converted to $/MMBtu using a conversion factor of 5,80 MMBtu per barrel. The dates marked by vertical lines are the NYMEX near-month contract settlement dates.
By the fall of 2003, the price of gas had risen much closer to that of oil, but the basic pattern of the gas price tracking the oil trend remained intact (Figure 4).
Source: NGI’s Daily Price Index
Note: The West Texas Intermediate crude oil price, in dollars per barrel, is converted to $/MMBtu using a conversion factor of 5,80 MMBtu per barrel. The dates marked by vertical lines are the NYMEX near-month contract settlement dates.
Reflecting the effects of supply constrictions and profit taking occasioned by the US-coalition invasion of Iraq, the price of oil rose. The autumn increase in gas prices is a typical example of how weather predictions, especially of a colder than normal or earlier than normal onset of winter, temporarily perturb the overall pattern until the pattern restores itself (Figure 5).
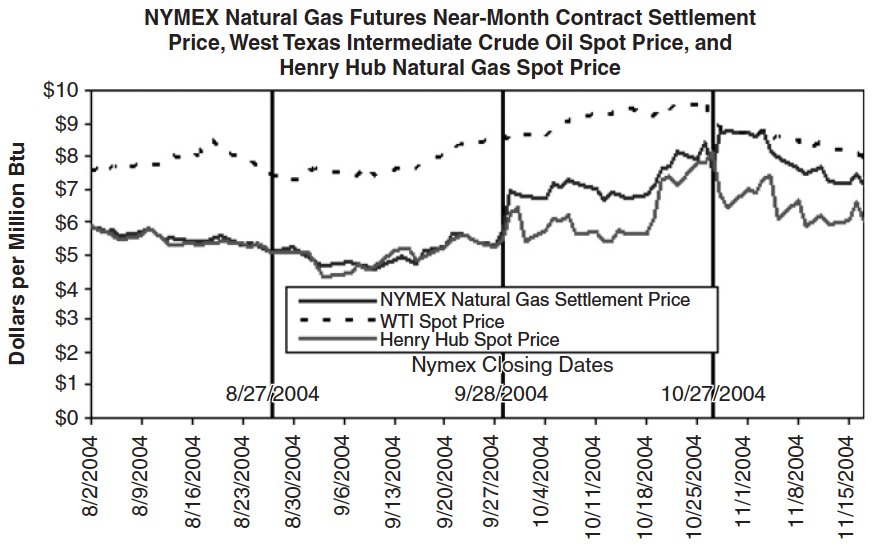
Source: NGI’s Daily Price Index
Note: The West Texas Intermediate crude oil price, in dollars per barrel, is converted to $/MMBtu using a conversion factor of 5,80 MMBtu per barrel. The dates marked by vertical lines are the NYMEX near-month contract settlement dates.
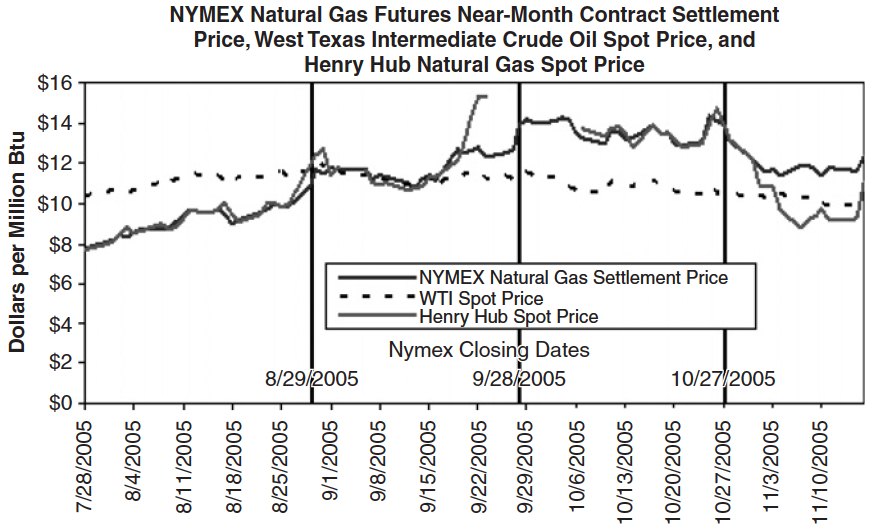
In Figure 6, the effects of the ongoing occupation of Iraq by the US-led coalition in destabilizing the supply of oil to the world market from Iraq, and consequently heightening speculation against the future oil price, are seen in the extremely high level maintained by the oil price trend compared to the preceding years (Figures 5). At the end of August 2005, the US Gulf coast, at the center of the main onshore transfer points of oil and gas from the Gulf into the Pipelines in Marine Terminals: Key Considerations for Handling Liquefied Gaspipeline system that transports large volumes throughout the central and eastern United States, was devastated by hurricane Katrina, an event sufficiently destructive to sink entire portions of the city of New Orleans. Reflecting this development, the gas price topped the oil price for a period, not receding until late October.
Source: NGI’s Daily Price Index
Note: The West Texas Intermediate crude oil price, in dollars per barrel, is converted to $/MMBtu using a conversion factor of 5,80 MMBtu per barrel. The dates marked by vertical lines are the NYMEX near-month contract settlement dates.
Data in these figures suggest that the conventional explanation of an energy market as a price setter and its participant price takers is seriously incomplete, as well as misleading about some crucial underlying influences. The gas trend tracks the oil trend, although the latter reflects a world price that damps down effects of temporary perturbations or incorporates the consequences of longer term ones (like the war in Iraq) in the general price level. Occasional short-term perturbations in the gas market punctuate the overall picture, but these are actually the moments where the anarchy inherent in the market system unveils its whip hand. Thus, contrary to what was promised and predicted, deregulation of gas and electricity prices has essentially failed to bring about any significant orderliness in gas marketing. Indeed, this conclusion could certainly have been suspected from a brief consideration of the financial earthquake unleashed by the bankruptcy of Enron, a pure “deregulated market” player, and its various consequences and ripple effects throughout corporate boardrooms across North America.
US Energy Markets: The Regulation – Deregulation Nexus
As Table 1 illustrates, from the outset, the rising importance of gas within the US energy supply picture could not long be separated from, and was actually decisive in bringing about, challenges to existing regulation. The first 30 years of this process developed from the supply of gas as a customer service being regulated as a residential utility, like electrical service, to its delivery being regulated across state lines on the basis of preventing the emergence and dictate of oligopolistic firms operating as a restraint upon free competition. The exigencies of wartime sequestering of petroleum to meet the demands of modern motorized forms of warfare on land, sea, and in the air opened the prospect of gas being substituted for oil in the supply of electric power to industry and local utilities. By the 1950s, the bias of regulatory effort shifted toward attenuating tendencies among producer oligopolies, pipeline oligopolies, and supplier oligopolies to poach one another’s turf. Conventional economics presents Environmental aspects in Liquefied Natural Gas productionnatural gas production and distribution as a “natural monopoly“, where the costs of business entry and startup, and the likely diminution of any newcomer’s margin of profit, discourage the establishment of competing enterprises in the same market. This fails, however, to explain and actually confuses historical facts. Natural gas went from being highly regulated to being deregulated at its industrial structure was transformed from scores of small local distributors to a network dominated by a handful of major pipeline operators.
| Table 1. Initial Development and Regulation of Natural Gas in the United States: A Timeline Compiled from Fleay (1998) and Natural Gas Organization (2005) | |
|---|---|
| Development and Regulation of Natural Gas | |
| 1859 | Col. Drake, US army, drills first commercial oil well at Spindletop, Pennsylvania. Ambient shows of natural gas are “flared off“. This technique is applied generally in oil fields until the start of World War II. |
| 1900s | Starting in New York and Wisconsin, municipalities enable articulation of gas pipeline networks into urban neighborhoods to provide an alternative to coal for domestic cooking and heating. |
| 1935 | US Federal Trade Commission (FTC) report notes with concern the increasing merger of financial interests from the electric and gas utility industries and recommends intervention to regulate in the interests of consumers. |
| 1938 | US Congress passes Natural Gas Act (NGA) in response to the FTC recommendations and continuing widespread public agitation over cartelization of utilities raising the cost of delivering an essential service on an uncompetitive basis at a time of widespread impoverishment and want. Drawing on the model of the Interstate Commerce Commission Act of 1913, the NGA proposes to arrest their negative consequences of excessive concentration by empowering the Federal Power Commission to regulate interstate development of pipeline networks and sale of gas. |
| 1941/1945 | The United States enters the war against Japan. Within a year, as it becomes clear that domestically produced oil will be needed for the war, especially for the fleet, the US government mandates widespread development of natural gas in the domestic market as a wartime substitute for refined petroleum wherever possible. In the United States, a Supreme Court ruling regulates the wellhead price of gas where the utility and the pipeline are part of the same financial entity. |
| 1954 | Supreme Court renders its decision in Phillips Petroleum Co. v. Wisconsin (347 US 672 [1954]). In this decision, the Supreme Court ruled that any natural gas producer selling natural gas into interstate pipelines fell under the classification of “natural gas companies” in the NGA and were subject to regulatory oversight by the FPC, simultaneously streamlining regulation of both the rates at which producers sold natural gas into the interstate market and the rates at which natural gas was sold by interstate pipelines to local distribution utilities. This sets the stage for the issue on which the deregulation melodrama unfolds, as a liberation of the producers from the tributary yoke of the pipeline companies backed by the FPC. |
| 1970 | US domestic oil production reaches a peak from which it has declined without interruption to date. Energy industry planning of domestic supply centers hereafter around natural gas. |
| 1998 | The role of oil in supplying the commercial energy of the entire globe had fallen to about 40 %; natural gas had risen to about 22 %. Some 60 % of the consumption of oil is been taken up by transport systems: rail, sea, and air. |
As the point of market saturation and the peak in the increase of the rate of return on investment in natural gas production, processing/transport, and delivery was passed, the pressure grew to consider deregulation. This pressure intensified greatly as it became apparent after 1970 that the United States could no longer profitably increase its domestic production of petroleum. Table 2 documents the manner in which, since 1978-1985, deregulation has been introduced.
| Table 2. Timeline of Natural Gas Deregulation in the United States Compiled from LIHEAP Clearinghouse (2005) | |
|---|---|
| A Condensed Deregulation Timeline | |
| 1978 | Natural Gas Policy Act ends federal control over the wellhead price of “new” gas as of January 1, 1985, but keeps in place wellhead price controls for older vintages of gas. According to the American Gas Association, the leading natural gas producers’ cartel in the United States, with this administrative change of everything except the wellhead price for existing supplies, “the laws of supply and demand begin to work again in the natural gas industry”. |
| 1985 | Order 436, issued by the Federal Energy Regulatory Commission (FERC), establishes a voluntary program that encourages natural gas pipelines to be “open access” carriers of natural gas bought directly by users from producers. This order brings the separation of pipelines’ merchant and transportation functions and initiates a restructuring of the natural gas industry’s regulatory structure. |
| 1989 | Natural Gas Wellhead Decontrol Act lifts the remaining wellhead price controls on natural gas. |
| 1992 | FERC Order 636 orders interstate natural gas pipelines to “unbundle“, or offer separately, their gas sales, transportation, and storage services. The goal of this order is to ensure that all natural gas suppliers compete for gas purchasers on equal footing. |
| 1996 | The first residential natural gas customer choice programs are implemented. By 1997, local natural gas utilities in 17 states and the District of Columbia had proposed and/or implemented such residential customer choice policies or pilot programs. |
| 1996 | On 31 August and 1 September, legislature in Sacramento, California, the most populous state in the United States, authorizes deregulation of electric power rates to begin 1 January 1998. |
| 1999–2000 | During one of the hottest summers on record in the state of California, a private corporation in Houston, Texas, set up under the name Enron to purchase electric power from deregulated utilities and resell it to customers in other deregulated jurisdictions, corners the California market and people’s air conditioning bills skyrocket. Mustering the facts of the brownouts and related power cuts and outages caused by the unprecedented demand in conditions of such artificially restricted supply as evidence of the need for massive increases in power supplies generally, lobbyists for the power engineering cartel in Washington, DC put the case for expanded federal subsidies and incentives to construct new power plants across the United States. As an unexpectedly long cold snap hits the populous regions of the US eastern seaboard and southeast in late 2000, the FERC permits a fourfold increase in the wellhead price (Henry Hub) of natural gas – the main proposed feedstock for the proposed future plants. |
Energy Price Volatility and Derivatives
It has been clear for some time that when it comes to energy sources and the maintenance of upstream investment and downstream revenue, the market cannot deliver when left to its own devices. One of the main ways developed to overcome this gap has been the development of risk management strategy as a major part of managing corporate-scale interventions in energy markets.
Derivatives, conventionally defined as “financial instruments (contracts) that do not represent ownership rights in any asset but, rather, derive (emphasis added) their value from the value of some other underlying commodity or other asset”, have been around since the late 1800s in the United States as a tradable agricultural commodity, the most famous example being probably the “pork belly” contract. Within the envelope of the aforedescribed events, and tending to overstimulate the marketing and pricing of both natural gas and electricity, a derivatives market was developed extensively as an instrument for the hedging of risk among entities investing in areas of the energy market undergoing deregulation, especially electricity and natural gas.
It will be interesting: Complete Manual for Engineers about Dew Point Reservoirs
Modernized, streamlined derivatives trading, especially the associated practices of indexing arbitrage and what is known as “program trading” (the preset, computer-regulated sell-off by syndicates of banks, investment dealers, and other large-scale purchasers of shares, usually near the end of a financial quarterly reporting period, of tens and even hundreds of millions of shares of stock in a vast range of entities), were first seen in the stock exchanges of the United States on a large scale during and following the October 1987 stock market crash. However, indictments and convictions shortly thereafter of Michael Milken, Ivan Boesky, and other exchange insiders for abusing the latitude available for those prepared to indulge new areas of risk in the market, far from discouraging their development, generated new interest in taming and stabilizing the playing field to facilitate new entrants. The risks involved are multiplied greatly by:
- the mutual and often reciprocal dependence of different contract performance promises on one another;
- and the legal system’s general posture that contracts between legal entities are deemed to have been entered into freely until otherwise proven in a court of law, and therefore it is no outside body’s business to inquire into or approve in advance any of the terms or requirements of such contracts.
The single most dramatic recent example of what can happen when “contracts” are simply invented without any intention of performing or completing them was seen in the incredibly rapid expansion and equally dramatic implosion of Enron, the derivatives-based energy commodities trader in Houston, Texas, between 1997 and 2001. After the implosion of Enron the EIA commissioned an authoritative study that exculpated derivatives trading as such of any responsibility. Entitled “Derivatives and Risk Management in Energy Industries”, the report documented the litany of disasters that have trailed in the wake of liberating deregulated energy commodity markets into the eager and waiting arms of the derivatives traders:
Although derivatives meet legitimate needs, they have also been implicated in tremendous losses. For example, Orange County, California, lost $1,7 billion in 1993; Metallgesellschaft lost about $1,3 billion in 1993 in energy trading; and in 1998 the Federal Reserve Bank of New York organized a rescue of Long Term Capital Management in order to avoid disrupting international capital markets. And in 2001 Enron became at that time the largest bankruptcy in American history. Enron was a large user and promoter of derivative contracts. Although Enron’s failure was not caused by derivatives, its demise raised significant concerns about counterparty (credit) risk and financial reporting in many energy companies.
The report explains the overall situation of energy commodity Risk Management Techniques used in the Oil and Gas Industriesrisk management and derivatives from the government’s point of view as follows in the report’s summary:
Natural gas and oil pipelines and residential natural gas prices are still regulated. Operating under government protection, these industries had little need for risk management before the wave of deregulation that began in the 1980s – about the same time that modern risk management tools came into use.
There are five general types of risk that are faced by all businesses:
- market risk (unexpected changes in interest rates, exchange rates, stock prices, or commodity prices), credit/default risk;
- operational risk (equipment failure, fraud);
- liquidity risk (inability to buy or sell commodities at quoted prices);
- and political risk (new regulations, expropriation).
Businesses operating in the petroleum, natural gas, and electricity industries are particularly susceptible to market risk – or more specifically, price risk – as a consequence of the extreme volatility of energy commodity prices. Electricity prices, in particular, are substantially more volatile than other commodity prices.
Of course, with the increased use of natural gas as a fuel for new electric power plants, the risk-reward “game matrix” that might be developed to predict investment outcomes for the widened variety of possible scenarios became ever more convoluted, with changes in electricity prices capable of leading or following changes in natural gas prices, and vice versa.
Price volatility is caused by shifts in the supply and demand for a commodity. Natural gas and wholesale electricity prices are particularly volatile, for several reasons. Demand shifts quickly in response to weather conditions, and “surge production” is limited and expensive. In addition, electricity and natural gas often cannot be moved to areas where there are unexpected increases in demand, and cheap local storage is limited, especially for electricity.
Table 3, comparing spot-market price volatility for selected commodities, demonstrates the potential profitability of short-term investing in certain electricity markets over investing in practically any significantly traded other “commodity play” in US markets.
| Table 3. Spot-Market Price Volatility for Selected Commodities (EIA, 2002) Data from Commodity Futures Trading Commission Calculations by Energy Information Administration staff.x | |||
|---|---|---|---|
| Commodity | Average annual volatility (%) | Market | Period |
| Electricity | |||
| California – Oregon border | 309,9 | Spot-peak | 1996-2001 |
| Cinergy | 435,7 | Spot-peak | 1996-2001 |
| Palo Verde | 304,5 | Spot-peak | 1996-2001 |
| PJM | 389,1 | Spot-peak | 1996-2001 |
| Natural gas and petroleum | |||
| Light sweet crude oil, LLS | 38,3 | Spot | 1989-2001 |
| Motor gasoline, NYH | 39,1 | Spot | 1989-2001 |
| Heating oil, NYH | 38,5 | Spot | 1989-2001 |
| Natural gas | 78,0 | Spot | 1992-2001 |
| Financial | |||
| Federal funds rate | 85,7 | Spot | 1989-2001 |
| Stock index, S&P 500 | 15,1 | Spot | 1989-2001 |
| Treasury bonds, 30 Year | 12,6 | Spot | 1989-2001 |
| Metals | |||
| Copper, LME grade A | 32,3 | Spot | January 1989 – August 2001 |
| Gold bar, Handy & Harman, NY | 12,0 | Spot | 1989-2001 |
| Silver bar, Handy & Harman, NY | 20,2 | Spot | January 1989 – August 2001 |
| Platium, producers | 22,6 | Spot | January 1989 – August 2001 |
| Agriculture | |||
| Coffee, BH OM Arabic | 37,3 | Spot | January 1989 – August 2001 |
| Sugar, World Spot | 99,0 | Spot | January 1989 – August 2001 |
| Corn, N Illinois River | 37,7 | Spot | 1994-2001 |
| Soybeans, N. Illinois River | 23,8 | Spot | 1994-2001 |
| Cotton, East TX and OK | 76,3 | Spot | January 1989August 2001 |
| FCOJ, Florida Citrus Mutual | 20,3 | Spot | September 1998 – December 2001 |
| Meat | |||
| Cattle, Amarillo | 13,3 | Spot | January 1989 – August 2001 |
| Pork bellies | 71,8 | Spot | January 1989 – August 1999 |
The conventions of risk management strategy are thus very much in flux in US energy markets, a situation that has become increasingly fluid as interest in the field of econometrics about the relationships elucidated by game theory regarding market uncertainty has developed extensively. John F. Nash was awarded the 1994 Nobel prize in economics for his contributions in this field, and the 2006 Nobel prize for economics was awarded to Thomas Schelling and Robert J. Aumann for their work in this field as well.
Natural Gas Supply in North America
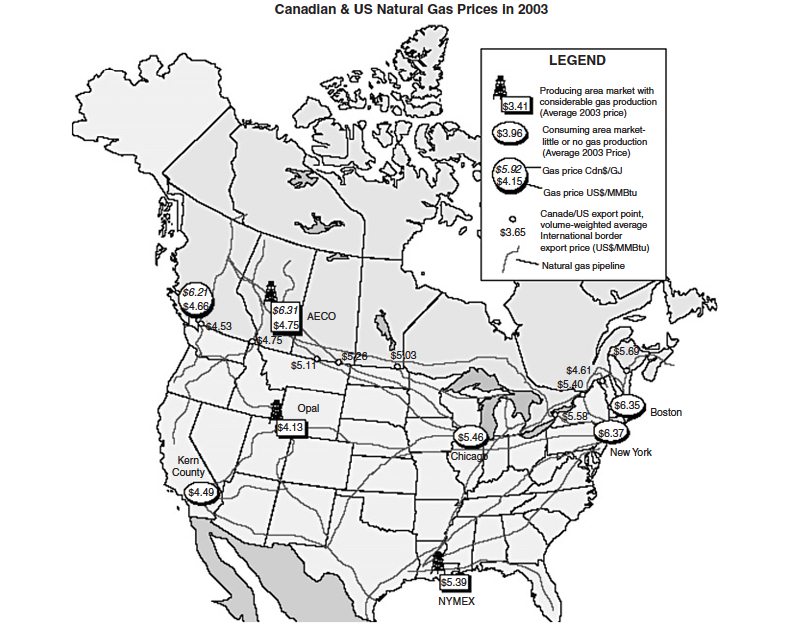
The role of the United States in natural gas production, marketing, and pricing differs in significant respects from the picture just described. It has developed a cartelizing model that has successfully and, in many respects, falsely presented itself as a model and high point of deregulated competition. Figure 7 gives an idea of how the United States supplies its market and hints at how this develops in a manner that also integrates entire portions of the economies of other countries, notably its geographically contiguous neighbors Canada and Mexico, into the economy of the United States.
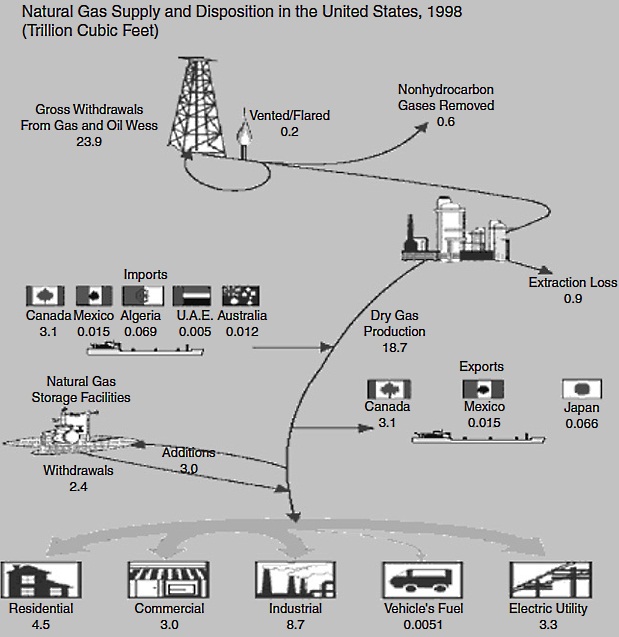
Source: Energy information Administration
The Special Position of the United States
Annual market consumption of natural gas in the United States has increased from about 5 trillion cubic feet in 1949 to a peak of more than 22 trillion cubic feet in 1973. After falling back throughout most of the 1980s and 1990s, it resumed a steady upward climb again to its next peak, at about 23,3 trillion cubic feet in 2000.
Two factors account for most of the postwar expansion: the explosion of the housing market throughout the United States, especially during the main years (1945-1960) of the so-called “baby boom“, and the expansion of medium and heavy industry beyond the coal-and steel belts of the US northeast and Great Lakes to new urban growth centers of the west coast, the “right-to-work” states in the south, and the tremendous expansion of population and industry in Texas and Florida.
By the mid-1990s, however, some 70 % of new homes in the United States were being heated with natural gas. Essentially this market had reached a saturation point. At the same time, as a result of the so-called “deregulation” of natural gas pricing begun in the United States in 1978 and taking effect after 1985, a situation was created whereby the natural gas producers, after having divested themselves of any significant further financial involvement of pipeline and or other distribution networks and infrastructure, were deemed to be no longer in a cartelizing situation.
Read also: Liquefied natural gas (LNG) – The Ideal Gas
At this point, arguing that they would now need to be able to compensate their operations for the future losses in future revenue that could be anticipated from the decline in household demand, the gas producers became free to combine in setting the wellhead price. This – the so-called “Henry Hub” price, based on delivery at the main hub on the US Gulf Coast, where comes some 60 % of US-produced natural gas – quadrupled in 2000. Far from ensuring themselves against future loses of revenue from declining home heating demand, the producers were in fact harvesting the windfall created by deregulation of electricity prices, provision of services and markets in major populated states, starting with California. To keep electric power generation profitable in a deregulated market, natural gas was increasingly substituted for oil and coal. Natural gas would thereafter be produced increasingly as a feedstock commodity for the electricity-generating market, with home heating markets concentrated in the northeast – where population was in long-term decline – contributing a diminishing portion of overall revenue.
Deregulation of electrical power supply and markets opened massive opportunities for outright swindling of the public on an unprecedented scale. The most dramatic result, which came quickly in 2000-2001, was the rise and collapse of Enron – headquartered in Houston at the center of the natural gas boom, but doing most of its business in California in the form of Ponzi-type “contracts for future supplies of electric power”. With its collapse, natural gas prices fell back 50 % from their historic highs, but superprofits were garnered in any event from the happy confluence during the winter of 2000-2001 of an extremely cold and extended heating season in the US northeast along with the Enroninduced brownouts and blackouts visited on residents of California.
The United States’ “long-standing glut of natural gas and electrical capacity, along with the world’s spare oil capacity, vanished simultane ously in spring 2000… Fueled by cheap energy, the US economy grew 60 percent since 1986, an astounding five percent in 2000 alone. Gas consumption grew 36 percent over that period (+43,8 % over the period 1986 to 2000). But it was the demand for electricity… up 5,4 percent in 1998, an astounding rate for such a large economy… that has had the biggest impact on gas prices. To meet… growing electricity needs, utilities have ordered 180 000 Megawatts of gas-fired power plants to be installed by 2005. It was a logical thing to do: gas is the cheapest, cleanest way to convert fossil fuel to electricity. But if ordering one gas turbine makes perfect sense, ordering 1 000 is a recipe for disaster. No one in the utility industry asked the key question: can we produce enough gas to run all those plants? Many experts think the answer is no…” Reproducing a previously published 20-year projection of Global gas market and history of LNG/LPG consumptionnatural gas consumption in the United States for the period 1997-2017 estimating relatively moderate increases in annual industrial consumption (from about 8,7 to slightly more than 9 trillion cubic feet), residential use (from 5 to 5,5 trillion cubic feet), and commercial applications (from 3,2 to 3,5 trillion cubic feet), this same source indicates that gas for electricity generation is predicted to nearly triple over the same period, from about 3,2 to more than 9,1 trillion cubic feet per annum.
The importance of a distribution network cannot be overstated when it comes to natural gas.
Without a pipeline, natural gas is worthless, a constraint first recognized by the Chinese. They were drilling for gas in 1 000 A.D. … but their pipeline materials were limited to bamboo. [sic] American pipelines today could stretch to the Moon. Most date to post-World II, when Gulf Coast supplies were tied to markets in the Midwest and New England. Since pipelines are prone to corrosion, beer keg-sized diagnostic tools called “pigs” are pushed through the lines to search for weak spots, not always in time. In August, 2000, a pipeline exploded in New Mexico, killing 10 people, and crimping gas deliveries to California. Many aging pipelines need to be rebuilt, replaced, or expanded to deliver more gas to urban areas, where the new fleet of gas-fired power plants will be moored. In December 2000, gas delivered to L.A. briefly fetched $69, equivalent to $400 for a barrel of oil.
Canada as North American Gas Supplier
All the aforementioned considerations regarding pipeline connections hold particularly profound implications for the development mainly by US companies of natural gas production in The Gully zone of the Sable Island field along the Atlantic coast of the Canadian province of Nova Scotia. Although the gas find was developed entirely with US markets in mind, its estimated life is only about 20 years and the main longer term asset developed with it seems to be the Maritimes and Northeast pipeline running from Goldboro, Guysborough County, Nova Scatia, where Sable Island gas is brought ashore. This gas pipeline (the solid line in Map 1) runs across central and northern Nova Scotia through the neighboring province of New Brunswick, across the international border with the state of Maine as far southwest as the Boston-area suburb of Everett, Massachusetts, the nearest US gas pipeline distribution point.
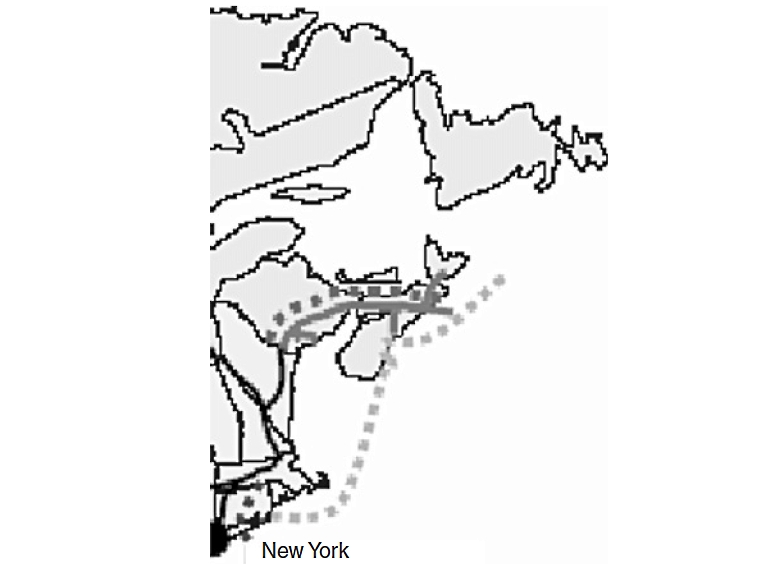
This suggests several hitherto unexamined reasons for the intense rise of US interest in LNG either at portside storage facilities in existing large US urban centers, something that local referenda have defeated repeatedly in a series of downeast ports north and east of the Boston – Portland corridor, or via pipelines that have been built and paid for by others, e. g., the Maritimes and Northeast pipeline.
The most interesting feature in Map 1 is the dotted line. It is the El Paso group’s proposed pipeline from the Sable Island gas field to Connecticut. The stop-off point near Shelburne Nova Scatia is not to serve Canadian gas customers. It creates something novel: a means for a private company to sue the Canadian government under Chapter 11 of the North American Free Trade Agreement should anything happen to the flow of gas to US customers. Neither Shelburne nor the surrounding region in Nova Scotia is a growth center for industry of any kind, now or in the future, and thus there cannot be any other possible interpretation of such a design feature.
It would have been a far more direct route, and less expensive, to lay pipeline on the sea bottom directly from the gas field to the New England coast. The only rational explanation not to do so is that the alternative pictured in Map 1 depicts what amounts to a scheme to annex a large portion of the Canadian 200-mile offshore limit directly to the contiguous US 200-mile limit, setting the stage for massive integrated future offshore oil and gas development. As a result of the implicit underlying annexation and integration of the territorial base, a strong fillip would also be given to the forces working hard to overturn the current moratorium on exploratory oil and gas drilling on the George’s Bank, a rich fishing zone presently divided by the Canada – US boundaries offshore, a moratorium that Big Oil has been unable to budge for the last decade.
It will be interesting: Everything about Natural Gas in Modern Industry
What about objections and alternative proposals from Canadians? A survey of the Canadian energy industry vetted and published in the winter of 2005 by the US Energy Information Administration noted that Эwhile not without controversy, the Canadian LNG terminals have not met with the same level of resistance from local residents and environmentalists that similar facilities in the US have faced”. The reality of the “resistance from local residents and environmentalists that similar facilities in the US have faced” was that local referenda in a series of downeast ports north and east of the Boston – Portland corridor repeatedly defeated bond-issue proposals for such projects. The role of “environmentalists” in these fights was to expose that the smaller and more down at heel the particular port community, the riskier such development could prove in the event of a major “liability event“, such as an explosion, spill, or collision. Notwith-standing the possible stubbornness of this or that local crank or crusading environmentalist, it was only after the liability risks were clarified that the community could exercise its franchise. Once this took place, the process proceeded normally. Contrary to the implication planted within the syntax of the EIA description just quoted, the rejection was not because of this local crank or that environmental crusader. Notwithstanding the generally acknowledged objectivity of the US Department of Energy in maintaining the EIA web site as a source of current and reliable information in this field, to suggest that the way matters turned was an aberration caused by individuals hijacking the democratic process is misleading and – had the individuals been named – probably grounds for a libel suit.
One outstandingly principal reason that “Canadian LNG terminals have not met with the same level of resistance” is that local referenda on such matters are available neither in Canadian community traditions nor laws.
This fact is unmentioned anywhere in the EIA’s online review or other such reviews. While such plebiscites have formed a vital part of the lifeblood of the town-meeting-based “democracy from below” since its invention by New England settlers in the late 1600s, there is in the Canadian system no guaranteed process in the hands of the people to check up on matters arranged between corporate and government bureaucrats. This suggests another possible reason the oil and gas lobby favors going through Canada is that the best way to handle objections is any legal way that would ensure such objections or resistance never attain any legal, public, or widespread airing in the first place.
In connection with the Maritimes and Northeast pipeline, two proposals won approval in principle (i. e., approval pending a formal environmental impact assessment) earlier in 2005 from Canada’s National Energy Board:
Both proposals raise the curtain on yet another aspect of the development of gas pipeline network distribution between Canada and the United States. This is a link that has become critical for the over-all US Offshore supply chain of Liquefied Natural Gasnatural gas supply picture. In total, there are plans to build over 4 billion cubic feet per day of LNG receiving capacity by 2008 in eastern Canada alone. (At this writing in September 2005, there are still several further LNG-terminal proposals on the Pacific and Atlantic coasts waiting to go before the National Energy Board.) Even before the latest Maritimes-based projects mentioned previously, a $1,3 billion, 500-million-cubic-feet-per-day (MMCFD) LNG terminal at Gros Cacouna, Quebec, along the St. Lawrence River to be built by Petro-Canada and TransCanada Pipelines, was approved, apparently in connection with the signing of a deal between Petro-Canada and Russia’s Gazprom to feed the Gros Cacouna terminal from Gazprom’s Shtokman field. This and other proposals are documented in Table 4.
| Table 4. Proposed LNG Terminals in Canada (NRCan Report, 2004) | ||||
|---|---|---|---|---|
| Operator (name) | Location | Projects under review | ||
| Send-out capacity (Bcf/d) | Earliest start date | Status | ||
| Anadarko Petroleum Corporation (Bear Head) | Canso Strait, NS | 1,00 | 2007 | Received federal – provincial environmental assessment approval in August 2004 |
| Irving Oil Limited (Canaport) | Saint John, NB | 1,00 | 2007 | Received federal – provincial environmental assessment approval in August 2004 |
| Enbridge/Gaz Me’tro/Gaz de France (Rabaska) | Beaumont, QC | 0,50 | 2008 | Undergoing federal – provincial environmental assessment Process commenced June 2004 |
| Kelitic Petrochemicals | Goldboro, NS | 0,50 | 2008 | Undergoing federal – provincial environmental assessment Process commenced August 2004 |
| Galveston LNG | Kitimat, BC | 0,61 | 2008 | Undergoing federal – provincial environmental assessment Process commenced August 2004 |
| TransCanada/Petro- Canada (Cacouna Energy Project) | Gros Cacouna, QC | 0,50 | 2009 | Undergoing federal – provincial environmental assessment Process commenced September 2004 |
| Other announced projects | ||||
| Westpac Terminals | Prince Rupert, BC | 0,3 | 2009 | Conceptual. Project not yet under review |
| Statia Terminals | Canso Strait, NS | 0,50 | 2009 | Conceptual. Project not yet under review |
| Total Canada | 4,91 | |||
| Sources: Industry press and company web sites | ||||
Canada currently supplies about 16 % of natural gas consumed in the United States. During the period 2000 through 2003, this represented 57-60 % of all the natural gas produced in Canada. Clearly Canada is not producing gas for itself and exporting what it cannot consume. Rather it is producing gas for export while domestic consumption develops only incidentally.
Much of Canada’s pipeline infrastructure linked to US markets before the 1990s served residential and commercial markets in the larger centers of Alberta as well as southern Ontario and Quebec. However, the Maritimes and Northeast pipeline, one of the newest to the United States and more than 400 km in length, financed in part by generous tax subsidies from the federal and provincial governments involved, was designed without any plan to develop any of the Sable Offshore Energy Project’s gas for a potential residential market of about 1,5 million people in central and northern Nova Scotia and southern New Brunswick. To date, there has emerged only a very vague long-term notion of supplying a tiny industrial market in Dartmouth NS and Saint John NB. This points to a new and rather disturbing feature of the increasing embroilment of Canadian resources and territory for this latest phase of US industrial expansion. Popular Canadian standup comedian Dave Broadfoot joked a few years ago that Canadians’ role may actually be “evolving [from] being mere hewers of wood and drawers of water’ to “expellers of gas” as well”. Table 5 documents the pattern of evidence for the serious side of this claim.
| Table 5. Comparative Data on Canadian Natural Gas Production for Export and Domestic Markets (NRCan Report, 2004) | ||||
|---|---|---|---|---|
| 2003 (Bcf) | 2002 (Bcf) | Change (Bcf) | Change (%) | |
| US residential | 5,085 | 4,890 | 195 | 4 % |
| US commercial | 3,127 | 3,103 | 24 | 1 % |
| US industrial | 6,966 | 7,557 | -591 | |
| US electric power | 4,929 | 5,672 | -74 | -13 % |
| US other Includes pipeline and distribution use, lease, and plant fuel and vehicle fuel.x | 1,769 | 1,796 | -27 | -2 % |
| Total US demand | 21,877 | 23,018 | -1,141 | -5 % |
| US LNG exports | 64 | 63 | 1 | 2 % |
| US exports to Mexico | 333 | 263 | 70 | 27 % |
| Total US gas disposition | 22,274 | 23,344 | -1,070 | – 5 % |
| Canada residential | 675 | 620 | 55 | 9 % |
| Canada commercial | 518 | 486 | 32 | 7 % |
| Canada industrial | 1,029 | 970 | 59 | 6 % |
| Canada electric power | 282 | 261 | 21 | 8 % |
| Canada other Includes pipeline compressor fuel, processing fuel, and line losses.x | 410 | 399 | 11 | 3 % |
| Total Canadian demand | 2,914 | 2,736 | 178 | 7 % |
| Total N. A. Demand | 24,791 | 25,754 | -963 | -4 % |
| Total N. A. Disposotopn | 25,188 | 26,080 | -892 | -3 % |
| Sources: EIA, StatsCan. | ||||
NRCan (“Natural Resources Canada”), the Canadian Federal Department of Energy and Natural Resources, which selectively makes public various developments in Canadian energy production and marketing, has become increasingly sophisticated at producing material for public consumption that goes far beyond just painting the expanded interest of government and private industry in expanding pipeline infrastructure for gas deliveries to US markets in the best possible light. Their materials deliberately suggest that such developments, far from being done at the Canadian public’s cost, are saving the world from “global warming due to excess greenhouse gas emissions”. However, is it really without cost to the Canadian host? Not only does the gas carried by some of these pipelines go straight to markets in the United States almost without stopping, e. g., the Maritimes and Northeast line takes more than 97 % of Sable-Panuke gas to US markets, with only an inconsequential amount is being distributed to selected industries in Halifax NS, Moncton and Saint John NB – but the Canadian federal and provincial governments involved are collecting only a token royalty to reserve the pipeline’s rights of way and fund potential future liabilities, such as environmental damage or property destruction suffered by Canadian residents incidental to maintaining the pipeline. The impression is being created instead that a fate such as “global warming” is important enough to justify enabling private interests, most of them based outside Canada, to obtain access not only to Canadian energy policy-setting structures, but to the treasury as well. Although questions are raised from time to time in the Canadian media about governments’ inability to fund necessary social programs adequately, little effort is made to pursue too closely the connection this bears to tax break incentives for new exploration projects and other “giveaways to the oil companies“.
Read also: Liquefied Natural Gas Fundamental Knowledge and Understanding
Meanwhile, however, it may be inferred from the tenor of the reviews published by the most authoritative governmental sources that while future demand in US markets has been pumped up by the stampede to substitute natural gas as the main fuel source for new electric power plants, Canada as a source of natural gas will become increasingly problematic to the extent that synthetic crude oil exports from Canada become a larger part of projected US “energy security” and security of supply. This follows from the fact that the key to expanding production to meet such enhanced demand for synthetic crude will involve diverting more and more of Alberta’s natural gas reserves to processing tar sand bitumen, the raw material source of synthetic crude. “Canada’s proven natural gas reserves, 56,1 [trillion cubic feet] as of January 2005, only rank 19th in the world. These reserves have decreased by 13,3 percent since 1996, and at current rates, production will completely deplete reserves in 8,6 years“. What could cause such a drastic depletion? “The oil sands industry is heavily reliant upon water and natural gas, which is necessary in both the extraction of bitumen from oil sands and the upgrading of bitumen to synthetic oil”. The vulnerability of existing marketing mechanisms of the entire “downstream” sector of the North American oil and gas sector to increases in natural gas prices or sharp reductions in natural gas supply would be distributed, extremely unevenly, with the oil sands industry likely to experience the most critical repercussions.
One interpolation that is consistent with these facts is that, short of new discoveries of natural gas in Canada, the main use of Canadian territory by the US gas market in coming years will be for transiting LNG from its ports and pipelines to US markets. Adding further credibility to that scenario is a published projection of LNG’s share of the US gas market rising five times over the next 15 years to 2020. The profitability of such arrangements is clearly premised on utilizing new/future supplies gas increasingly and mainly for electrical power generation and related industrial use, and less and less for residential or other commercial uses (e. g., as an alternative to gasoline).
It would seem clear, then, that one major premise built into meeting expanded the US market for natural gas by supplying LNG is an increasing integration and annexation of Canadian territory, resources, and resource-delivery infrastructure by and for US interests. On the one hand, Anadarko, mentioned earlier, exemplifies strategic foreign investing of this type, possessing interests of its own in Alberta oil and gas, and accumulated knowledge of its actual development trends, since the 1960s. For their part, on the other hand, the Irving interests, although both Canadian owned and somewhat insulated from shareholder takeover attempts (hostile or otherwise) as a result of the status of the principal holding company as a privately held corporation, are already extensively connected to the United States from at least two known directions. Irving Oil has long been integrated into supplying US gasoline and home heating fuel markets in northern New England.
The Irving refinery, opened in 1965, was financed to a significant degree by Exxon on the basis of receiving crude for processing from Nigeria, Venezuela, and some other major oil-producing zones outside the Middle East in ocean-going tankers owned or chartered by Exxon Corporation.
Map 2 illustrates the considerable degree to which Canadian natural gas marketing arrangements have already become integrated into the United States.
This is a remarkable annexationist feature built into the evolution of US energy policy. It is something not seen at all in the long-term natural gas delivery contracts negotiated earlier in 2005 between the Islamic Republic of Iran and the People’s Republic of China or between the gigantic Russian gas syndicate led by Gazprom and its various governmental and corporate customers in the European Union or Japan. Far from identifying this as any kind of problem, let alone investigating its import, considerable confusion has been created. An immediate cause at issue is the prospect that US law, which currently explicitly protects the Alaska wilderness refuge, will be gutted by regulations being planned by the Bush administration based on framing an exception for the energy supply needs of “homeland security“. The main threat posed by expanded US petroleum sector investments in exploration and development of new oil and gas fields has been framed in terms of the danger such development could pose for the ecology and natural wilderness spaces of the Arctic zone wildlife refuge areas along the Beaufort Sea coastline of eastern Alaska and near the delta of the Mackenzie River in the Canadian Yukon Territory.
Map 3 clearly indicates how focused upon its current state of relative underdevelopment compared to the United States the interest in Canadian gas actually is. The proportion of gas resources in Canada that are undiscovered or not yet in production is far ahead of the same proportions on the US side of the picture.
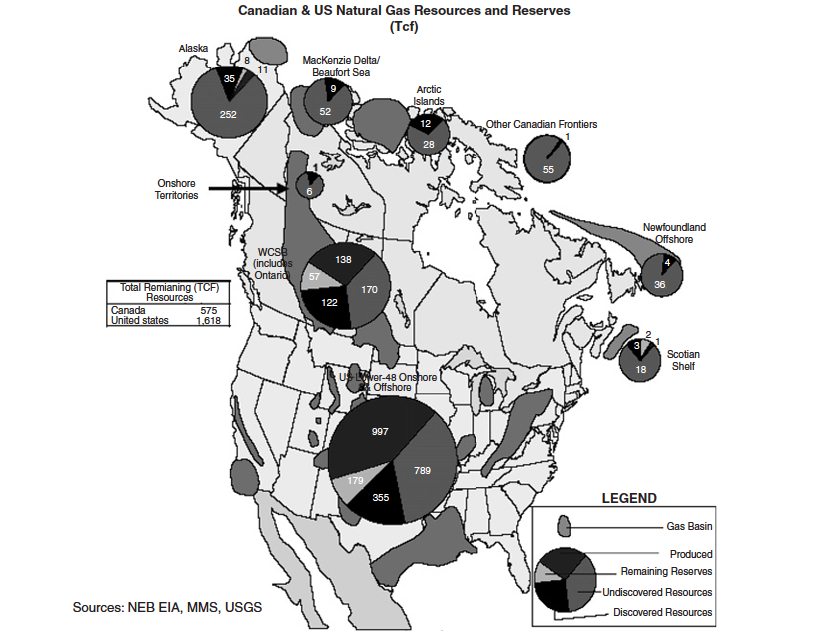
Given such scenarios, it is difficult to credit how serious headway can be made or expected in the direction of actually defending the ecological needs of the natural wilderness without first upholding the sovereign rights of the peoples involved.

- Aumann, R. J., Markets with a Continuum of Traders, Econometrica (1964).
- Aumann, R. J., Subjectivity and correlation in randomized strategies, J. Math. Econ. (1974).
- Aumann, R. J., and Branderburger, A., Correlated equilibrium as an expression of Bayesian rationality, Econometrica (1987).
- Aumann, R. J., and Hart, S., “Handbook of Game Theory with Economic Applications,” Elsevier (Vol. 1: 1992, Vol. 2: 1994, Vol. 3: 2002).
- Bryce, R., “Royal Commission on Corporate Concentration,” Study Report No. 16. The Irving Group, Queen’s Printer, Ottawa (1978).
- EIA, “Derivatives and Risk Management in the Petroleum, Natural Gas, and Electricity Industries,” Energy Information Administration (EIA), U.S. Department of Energy, Washington, DC (Oct. 2002).
- EIA, “Canada – Country Analysis Brief,” Energy Information Administration (EIA), U.S. Department of Energy, Washington, DC (Feb. 2005).
- EPA, “Petroleum Industry,” EPA AP-42 Manual, Chapter 5.3. Environmental Protection Agency (EPA), Washington, DC (Jan. 1995).
- EPA, “Economic Impact Analysis of the Oil and Natural Gas Production NESHAP and the Natural Gas Transmission and Storage NESHAP.” Final Report (EPA-452/R-99-003), Chapter 2, Sections 2.2-3 on Natural Gas Production and Markets in the U.S. for the Period 1983–1993 and Chapter 4, Sections 1.1-3 on the Modeling of Market Adjustments to the Introduction of Deregulation of Natural Gas in the U.S., Environmental Protection Agency (EPA), Washington, DC (May 1999).
- Fleay, B. J., “Climaxing Oil: How Will Transport Adapt?” Paper presented at the Chartered Institute of Transport in Australia National Symposium, Launceston (1998).
- Islam, M. R., and Zatzman, G. M., “A New Energy Pricing Model,” Proceeding of the 8th Mediterranean Petroleum Conference & Exhibition (MPC-2004), 210-226 Tripoli, Libya (2004).
- Islam, M. R., and Zatzman, G. M., “A New Energy Pricing Model: Exploring the Evolving Relationship between International Reserve Currencies and Global Shifts in Access to and Control Over Strategic Energy Resources,” Paper presented at the 3rd international Conference on Energy Resource Development (ICERD-3), Kuwait (2005).
- Izrael, Yu. A., et al., “Russian Federation Climate Change Coun- try Study (Cooperative Agreement DE-FCO2-93PO10118), Final Report (Vol. 1 – Inventory of Technogenic GHG Emissions), Moscow, Russian Federal Service for Hydrometeorology and Environmental Monitoring (RFSHEM) (1997).
- McQuaig, L., “It’s the Crude, Dude: War, Big Oil, and the Fight for the Planet”, Toronto-New York: Doubleday (2004).
- Mokhatab, S., and Purewal, S., “Is LNG a competitive source of natural gas?” J. Petroleum Sci. & Technol 24(2), 243–245 (2006).
- Mullins, B. J., et al., “Atmospheric Emissions Survey of the Sour Gas Processing Industry,” EPA-450/3-75-076, U.S. Environmental Protection Agency (EPA), Washington, DC (1975).
- NRCan (Natural Resources Canada) Report, “Canadian Natural Gas: Review of 2003 and Outlook to 2020,” Ottawa. Energy Policy Sector – Petroleum Resources Branch – Natural Gas Division, Ottawa, Canada (Dec. 2004).
- Sen, C.T., “GTI’s World LNG Source Book 2005,” Gas Technology Institute (GTI), Des Plaines, Illinois (2005).
- Udall, R., and Andrews, S., “Methane Madness: A Natural Gas Primer,” Denver CO: Community Office for Resource Efficiency (2001).
Did you find mistake? Highlight and press CTRL+Enter